

Stellar is still stuck in a tough spot. The price action remains heavy, and the broader trend has not changed yet.
On the 4-hour chart, the XLM price continues to move inside a long-standing downtrend that has controlled price for months. Buyers have tried to step in, but follow-through remains limited.
According to analysis shared by More Crypto Online, the current structure indicates the larger correction may be close to finishing.
That said, the chart still leaves room for one more push lower before the market can fully reset. This keeps the XLM price at an important decision point, where short-term moves matter more than usual.
- XLM B-Wave Bounce Runs Into Key Resistance
- Why Another Low Is Still Possible
- What’s Next for XLM?
XLM B-Wave Bounce Runs Into Key Resistance
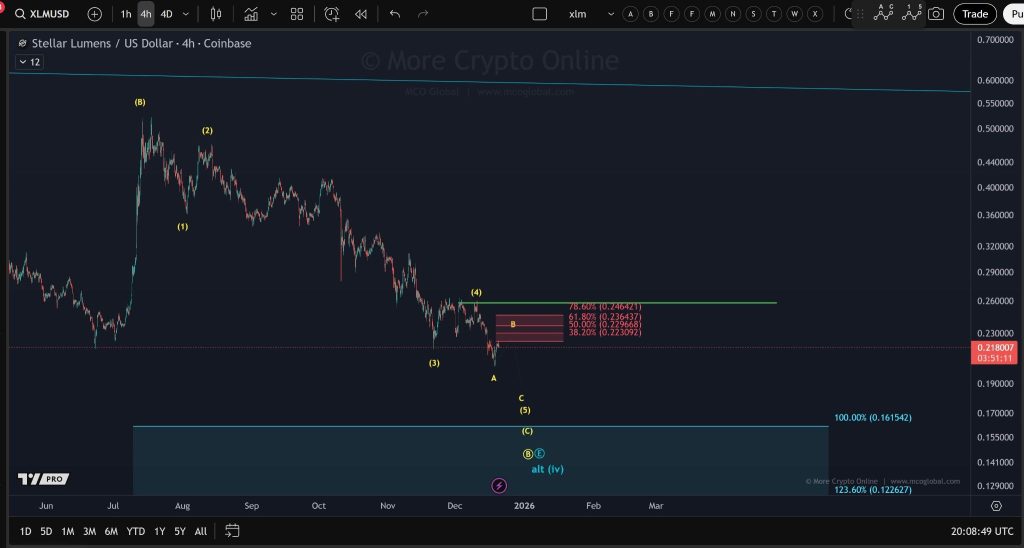
The recent bounce in XLM looks more like a pause than a reversal. On the chart shared by More Crypto Online, this move is labeled as a B-wave, which typically shows up during corrections. It comes after a sharp sell-off that pushed price toward the lower end of the range.

Source: X/@MoreCryptoonl
Right now, resistance sits between 0.223 and 0.246. This area lines up with key Fibonacci levels and has already acted as a ceiling in the past. As long as XLM trades below this zone, the move higher looks corrective rather than a real trend change.
If the XLM price gets rejected here, it would confirm that sellers are still in control. A clean break above resistance, however, would start to challenge that view.
Why Another Low Is Still Possible
Even though selling pressure has eased, the chart still points to the risk of another drop. The current structure allows for one more low in wave c of the 5th wave. If that plays out, price could dip into the broader support zone marked on the chart before the correction fully completes.
This kind of move would not be unusual at this stage. Markets often make a final push lower before turning, especially after long corrective phases like the one XLM has been stuck in.
Read Also: SEI Price Stabilizes After Sell-Off — Can Bulls Push It Back to $0.16?
What’s Next for XLM?
For now, Stellar remains in a waiting game. Bulls need to see a clear move above the resistance zone to shift the structure in their favor. Until that happens, rallies are likely to attract sellers.
The next move will be important. Whether the XLM price breaks higher or makes one last drop could shape price action going into early 2026.
Disclaimer: The information on this page may come from third parties and does not represent the views or opinions of Gate. The content displayed on this page is for reference only and does not constitute any financial, investment, or legal advice. Gate does not guarantee the accuracy or completeness of the information and shall not be liable for any losses arising from the use of this information. Virtual asset investments carry high risks and are subject to significant price volatility. You may lose all of your invested principal. Please fully understand the relevant risks and make prudent decisions based on your own financial situation and risk tolerance. For details, please refer to
Disclaimer.
Related Articles
BTC Breaks Through $73,000, Mainstream CEX Cumulative Short Liquidation Intensity Reaches $834 Million
According to Coinglass data, if the Bitcoin price breaks through $73,000, it will trigger $834 million in short liquidations; if it falls below $69,000, it will trigger $940 million in long liquidations. This demonstrates the potential impact of market liquidity fluctuations.
GateNews2h ago
Ethereum Bottom In at $2,156, Says Tom Lee! Spike Soon?
Ethereum shows signs of stabilization with long-term holders increasing positions despite cautious institutional ETF outflows. This suggests a potential market bottom, though recovery may take time influenced by external factors.
Coinfomania3h ago
Quant enters important supply zone: Will QNT's 24% weekly rally slow down?
Quant (QNT) has shown strong recent performance, rising 4.91% in 24 hours and 24.14% over the week, contrasting with Bitcoin's drop. While a bullish trend is possible, signals indicate a cautious outlook, with key resistance levels to watch.
TapChiBitcoin4h ago
HODL Kings: Bitcoin Leads Diamond Hands Ranking
According to analysis shared by CEX.IO, long-term holding continues to be a defining strategy in the cryptocurrency market. The “diamond hands” metric measures the percentage of a digital asset’s supply that has remained inactive for extended periods, typically over one year. This indicator
Coinfomania4h ago
BNB Chain leads the AI sector with 39.9% market share, so why is the price still falling?
BNB Chain is emerging as a leader in the AI agent ecosystem, holding 39.9% market share. However, its token BNB's price has not reflected this growth, remaining 25.9% below its previous peak, as market sentiment remains cautious.
TapChiBitcoin7h ago
