Date: Fri, Dec 26, 2025 | 11:40 AM GMT
The broader cryptocurrency market is showing modest strength, with both Bitcoin (BTC) and Ethereum (ETH) trading in the green. This steady performance among the major assets has helped stabilize overall sentiment, allowing select altcoins — including** Solana (SOL) **— to begin showing constructive technical setups.
SOL is trading with a modest intraday gain, but more importantly, its price structure is starting to tell a much bigger story. The 4-hour chart reveals a well-defined harmonic pattern that suggests Solana may be preparing for another leg higher in the near term.
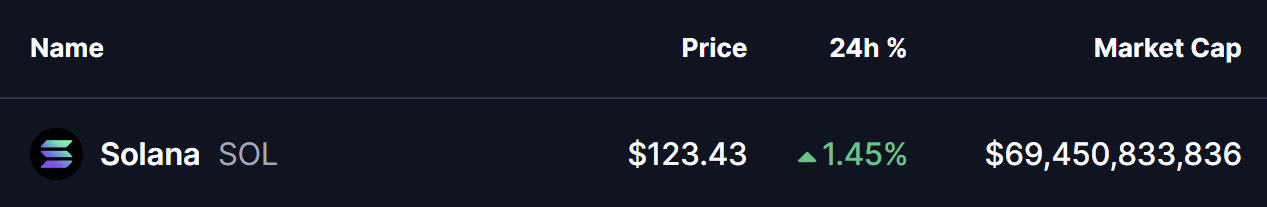
Source: Coinmarketcap
Bearish Bat Pattern in Play?
On the 4-hour timeframe, Solana appears to be forming a Bearish Bat harmonic pattern. While the name may sound negative, this structure typically allows for a bullish move toward the completion point (D) before any potential reversal takes place.
The pattern began at Point X near the $140.11 level, followed by a sharp decline toward Point A. From there, SOL rebounded to Point B before undergoing a deeper corrective move into Point C around $119.24. This zone acted as a key support area, where buyers stepped back in.
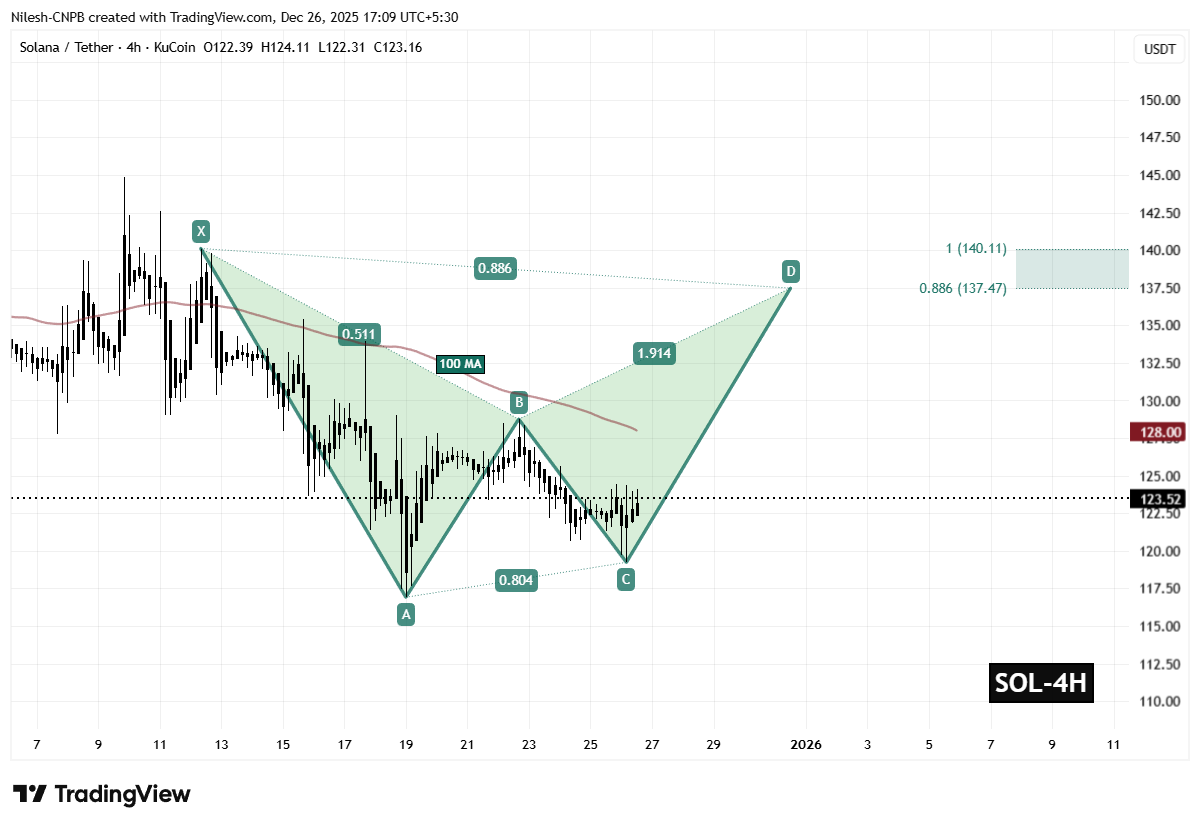
Solana (SOL) 4H Chart/Coinsprobe (Source: Tradingview)
Since printing the Point C low, SOL has started to recover steadily and is now trading near $123.52. This rebound suggests that selling pressure is weakening and that bulls are gradually regaining control.
Adding further technical significance, the 100-hour moving average is currently positioned around $128.00. A successful reclaim and hold above this level would strengthen the bullish case and confirm improving momentum.
What’s Next for SOL?
If buyers continue to defend the $119.24 support zone and manage to flip the 100-hour moving average into support, the Bearish Bat pattern points toward a potential rally into the Potential Reversal Zone (PRZ).
Based on Fibonacci projections, the PRZ is located between:
$137.47 (0.886 Fib extension) and $140.11 (1.0 Fib extension).
This target zone represents an upside of roughly 13% from current price levels and aligns closely with classic harmonic completion areas where price often reacts sharply.
However, if SOL fails to hold above the CD-leg support and slips back below the $119 region, the structure could weaken. In that case, the bullish scenario may be delayed, opening the door for a short-term correction before any renewed attempt higher.
For now, SOL remains technically constructive, with the harmonic pattern suggesting that the next meaningful move could favor the upside if current support levels continue to hold.
Disclaimer: The views and analysis presented in this article are for informational purposes only and reflect the author’s perspective, not financial advice. Technical patterns and indicators discussed are subject to market volatility and may or may not yield the anticipated results. Investors are advised to exercise caution, conduct independent research, and make decisions aligned with their individual risk tolerance.
Disclaimer: The information on this page may come from third parties and does not represent the views or opinions of Gate. The content displayed on this page is for reference only and does not constitute any financial, investment, or legal advice. Gate does not guarantee the accuracy or completeness of the information and shall not be liable for any losses arising from the use of this information. Virtual asset investments carry high risks and are subject to significant price volatility. You may lose all of your invested principal. Please fully understand the relevant risks and make prudent decisions based on your own financial situation and risk tolerance. For details, please refer to
Disclaimer.
Related Articles
Crypto consolidates as volatility cools and futures markets tilt bearish
The crypto market continued to exhibit signs of choppiness on Friday, with bitcoin BTC$67,135.03 trading at $67,000 in the middle of a trading range that spans back to early February.
A selection of altcoins picked up during the lower liquidity Asia hours, prompting the likes of ALGO and RENDER to
CoinDesk1h ago
XRP Eyes $1.50 Breakout as Price Holds Critical Range
XRP trades in a tight range, testing support near $1.33 and resistance $1.40–$1.42.
A breakout above $1.50 could signal bullish momentum toward $1.52–$1.60.
Breakdown below $1.27 may extend the current downtrend and increase selling pressure.
Ripple’s XRP continues to trade within a
CryptoNewsLand1h ago
CryptoQuant: Ethereum derivatives market net traders trading volume turns positive, buyer pressure reaches $104 million
On April 4, CryptoQuant analyst Darkfrost posted a message, pointing out that the Ethereum derivatives market is showing a “structural change.” The net trader execution volume has turned positive for the first time, with buy-side pressure in control, which could help form a market bottom and may kick off a new round of upside.
GateNews2h ago
VanEck Research Director: BTC derivative protective demand hits the 99th percentile historically, signaling a potential contrarian long setup
VanEck Research head Matthew Sigel said that demand for hedging in the Bitcoin derivatives market has reached the 99th percentile in history, suggesting that it may be suitable to establish long positions. At the same time, he warned that high capital expenditures in the artificial intelligence sector could put pressure on the market, especially in the S&P 500.
GateNews4h ago
Bitcoin’s ‘no direction’ action may lead to heavier breakout: Analyst
Bitcoin's prolonged consolidation below $70,000 may indicate a potential rally, despite mixed analyst sentiment. While some predict a breakout, others warn of deeper bearish trends. Current trading is stagnant, with Bitcoin at $66,890.
Cointelegraph5h ago
