 Cardano isn’t making headlines at the moment, and that’s a good thing. After a long period of pressure, ADA has finally stopped falling and has eased up.
There are no sharp sell-offs and no big pumps either. The ADA price is just moving quietly, and that usually means the market is thinking.
When things go quiet like this, it’s often because traders are waiting for clarity. And right now, ADA looks like it’s stuck in that “what next?” phase.
Cardano isn’t making headlines at the moment, and that’s a good thing. After a long period of pressure, ADA has finally stopped falling and has eased up.
There are no sharp sell-offs and no big pumps either. The ADA price is just moving quietly, and that usually means the market is thinking.
When things go quiet like this, it’s often because traders are waiting for clarity. And right now, ADA looks like it’s stuck in that “what next?” phase.
- What ADA Is Doing Right Now
- What the ADA Chart Is Hinting At
- What the Indicators Are Saying
- What’s Next for ADA?
What ADA Is Doing Right Now
On the 4-hour chart, the ADA price bounced off the $0.339 area and has been slowly inching higher since. That bounce was important. It’s where sellers clearly lost momentum and buyers finally stepped in.
Since then, ADA hasn’t rushed upward, but it also hasn’t given much back. ADA has been making small, steady moves, and every dip seems to get bought a little faster than the last one. That’s usually what stabilization looks like after a rough move down.
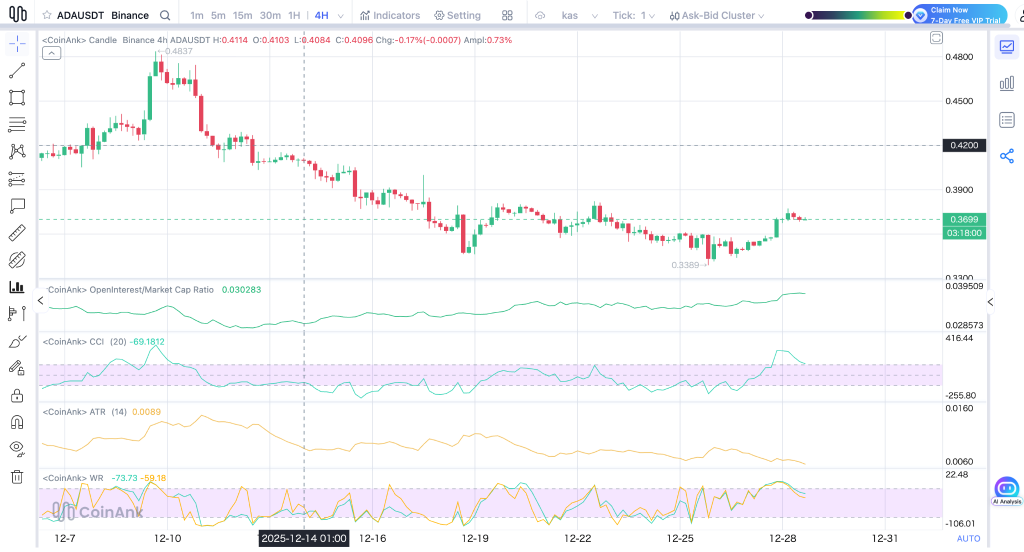
Source: CoinAnk
At the moment, the ADA price is hanging around $0.37. It feels like a decision zone. Price keeps hovering there, which tells you traders are waiting for a clearer signal before committing either way.
What the ADA Chart Is Hinting At
Looking at the bigger picture, ADA is still below the major resistance around $0.42. Until price gets back above that level, it’s hard to say the trend has really changed.
That said, the short-term structure does look better than it did a couple of weeks ago. ADA has stopped making lower lows, and selling pressure has clearly cooled. That alone changes the tone.
If the ADA price can stay above $0.36, a move toward $0.39 or $0.40 later this week wouldn’t feel out of place.
What the Indicators Are Saying
The indicators are pretty much confirming what the price is doing. Momentum has lifted out of oversold territory, which explains why the selling slowed down, but it’s not showing strong bullish energy yet.
Volatility has also dropped off. ATR continues to trend lower, which usually means the market is taking a pause. That often happens before a bigger move, but it also means ADA will need more volume if it wants to break higher.
Williams %R is sitting close to neutral, another sign that price isn’t stretched too far in either direction.
Read Also: From Fantom to Sonic ($S): How a Rebrand Triggered a 97% Sell-Off
What’s Next for ADA?
The rest of the week is important for Cardano, and $0.36 becomes the level of significance. As long as ADA is trading above $0.36, the short-term outlook remains positive, and $0.39-$0.40 becomes the zone of importance.
If the ADA price can push through that zone, $0.42 comes back into play. If not, and the price slips below $0.36 again, the recent low near $0.339 could get tested once more.
Right now, ADA feels like it’s waiting. Panic selling is absent, but buyers are still required. What happens around those levels will provide a good indication as to where the market is headed next.
Disclaimer: The information on this page may come from third parties and does not represent the views or opinions of Gate. The content displayed on this page is for reference only and does not constitute any financial, investment, or legal advice. Gate does not guarantee the accuracy or completeness of the information and shall not be liable for any losses arising from the use of this information. Virtual asset investments carry high risks and are subject to significant price volatility. You may lose all of your invested principal. Please fully understand the relevant risks and make prudent decisions based on your own financial situation and risk tolerance. For details, please refer to
Disclaimer.
Related Articles
Bitcoin Holds $69K–$71K Range Amid Middle East Ceasefire Confusion
Bitcoin hovered in a narrow band between $69,000 and $71,000 as traders weighed mixed diplomatic signals over a possible Middle East ceasefire.
Divergent Signals From Washington
Bitcoin maintained a tight consolidation pattern between $69,000 and $71,000 Wednesday as market participants
Coinpedia2h ago
Dogecoin Tests $0.090 Support After 3.4% Drop as Traders Watch Key Price Range
Dogecoin is currently trading at $0.09061 which is a drop of 3.4 percent, and the price is close to the important level of $0.09011 support.
The chart indicates a series of tests of the support zone of $0.089-$0.090, and the closest resistance is represented by $0.09353.
A hold of
CryptoNewsLand2h ago
Tom Lee Predicts ETH ATH at $15,000 as Ethereum Activity Hits Record Levels
Tom Lee predicts ETH ATH at $15,000 and above.
Ethereum network usage activity hits record levels.
This is a bullish signal, a move unseen since 2021 bull run.
As the price of the pioneer crypto asset, Bitcoin (BTC), continues to try and reclaim prices above $70,000, the pioneer
CryptoNewsLand2h ago
Bitcoin Nearing Undervalued Territory? CryptoQuant Flags Key On-Chain Signal
CryptoQuant sparked fresh debate in markets this week after posting a short-but-sharp take on a once-obscure on-chain gauge: the one-week-to-one-month holding ratio. The firm pointed out that this ratio, a measure of how much Bitcoin is being held for very short windows versus slightly longer
BlockChainReporter3h ago
XRP Holds $1.34 Support While Leverage Heatmap Highlights $1.30 Risk Zone
XRP is trading at $1.36 in a tight range of support at $1.34 and resistance at $1.37.
The heatmap data indicates that there is a huge amount of long positions in the range of $1.30.
Should prices fall to around $1.30, long positions with high leverage in this region might
CryptoNewsLand3h ago
BTC 15-minute decline of 0.60%: key support broken, combined with leverage deleveraging triggering short-term selling pressure
2026-03-11 17:30 to 2026-03-11 17:45 (UTC), BTC's 15-minute return decreased by -0.60%, with prices fluctuating between 70515.2 and 71317.0 USDT, with an amplitude of 1.13%. Trading volume significantly increased compared to the previous period, with selling pressure dominating, short-term market volatility intensifying, and market attention heating up.
The main driver of this anomaly was BTC losing the key support zone at $68,000-$68,200, triggering algorithmic trading sell-offs and stop-loss orders to be released in concentration, leading to a short-term decline. Meanwhile,
GateNews4h ago