Date: Sun, Dec 28, 2025 | 09:40 AM GMT
The broader cryptocurrency market is showing modest strength, with both Bitcoin (BTC) and Ethereum (ETH) trading in the green. This steady performance among major assets has helped stabilize overall sentiment, allowing select memecoins — including SPX6900 (SPX) — to begin showing constructive technical setups.
SPX is trading with a modest intraday gain, but more importantly, its price structure is starting to reflect a classic bullish reversal pattern. After weeks of sustained downside pressure, buyers appear to be stepping back in at key levels, hinting that the worst of the correction may already be behind.
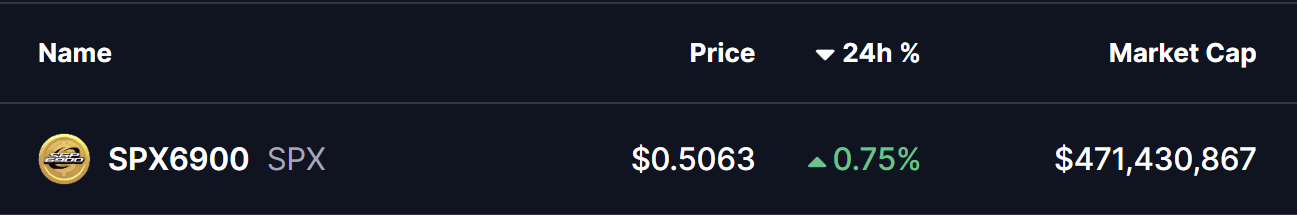
Source: Coinmarketcap
Double Bottom Pattern in Play
On the daily timeframe, SPX is forming a double bottom pattern — a widely followed bullish reversal structure that often appears near the end of prolonged downtrends. The first bottom formed in November when SPX dropped toward the $0.45 region, followed by a recovery that carried price back toward the neckline resistance near $0.7389 in early December.
That recovery attempt, however, was rejected, sending SPX back down to retest the same $0.45 support zone. Importantly, sellers failed to push price meaningfully lower on this second attempt. Instead, SPX printed another strong reaction from the same demand area and has since rebounded to trade around $0.5045.
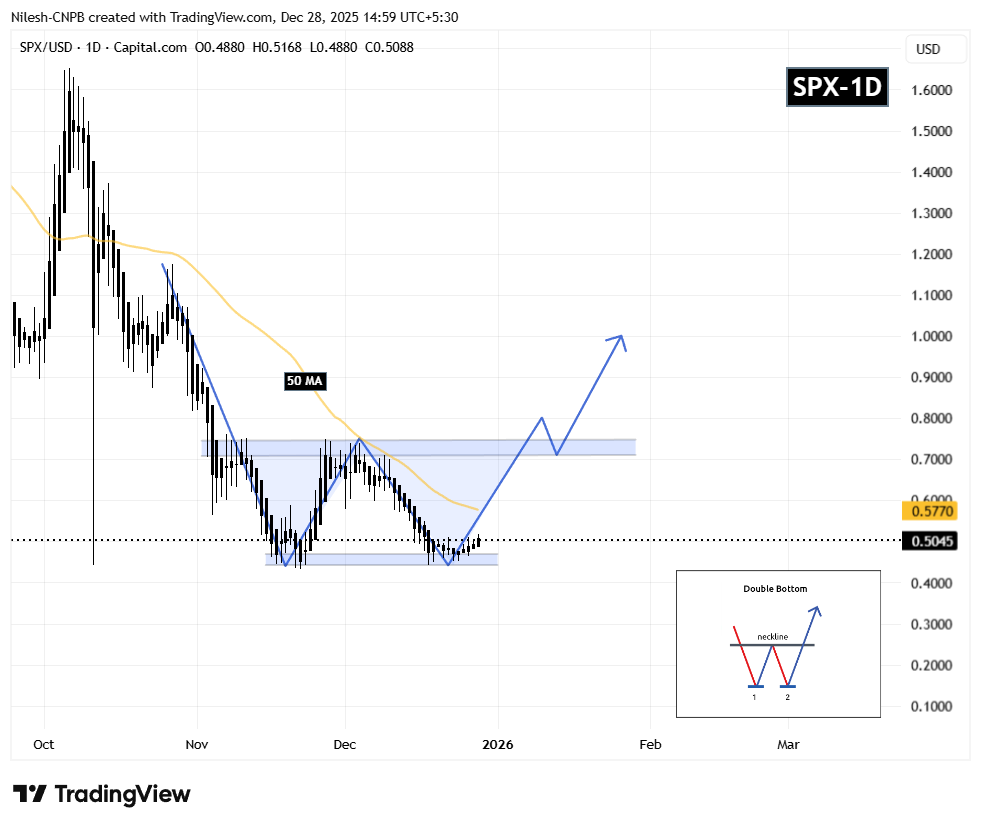
SPX6900 (SPX) Daily Chart/Coinsprobe (Source: Tradingview)
This repeated defense of the same support level is a critical technical signal. It suggests that selling pressure is weakening while buyers are gradually absorbing supply — a behavior typically seen during accumulation phases before trend reversals.
What’s Next for SPX?
For the bullish structure to strengthen, SPX must reclaim the 50-day moving average, currently positioned near $0.5770. A sustained move above this level would mark an important shift in short-term momentum and increase the probability of a continued recovery toward the neckline resistance at $0.7389.
A decisive breakout above the neckline — ideally followed by a successful retest — would confirm the full activation of the double bottom pattern. In that scenario, the technical projection points toward a potential upside target near $1.02, representing a significant expansion from current price levels.
Until then, the $0.45 support zone remains the most important level to watch. As long as SPX continues to hold above this area, the broader bullish setup stays intact and allows room for further upside attempts.
Overall, SPX’s structure appears constructive. The presence of a double bottom, repeated demand at identical lows, and proximity to the 50-day moving average suggest that this could be a pivotal moment as the token attempts to transition from accumulation into a new expansion phase.
Disclaimer
The views and analysis presented in this article are for informational purposes only and reflect the author’s perspective, not financial advice. Technical patterns and indicators discussed are subject to market volatility and may or may not yield the anticipated results. Investors are advised to exercise caution, conduct independent research, and make decisions aligned with their individual risk tolerance.
About Author
Nilesh Hembade is the Founder and Lead Author of Coinsprobe, with over 5 years of experience in the cryptocurrency and blockchain industry. Since launching Coinsprobe in 2023, he has been providing daily, research-driven insights through in-depth market analysis, on-chain data, and technical research.

Disclaimer: The information on this page may come from third parties and does not represent the views or opinions of Gate. The content displayed on this page is for reference only and does not constitute any financial, investment, or legal advice. Gate does not guarantee the accuracy or completeness of the information and shall not be liable for any losses arising from the use of this information. Virtual asset investments carry high risks and are subject to significant price volatility. You may lose all of your invested principal. Please fully understand the relevant risks and make prudent decisions based on your own financial situation and risk tolerance. For details, please refer to
Disclaimer.
Related Articles
Bitcoin may record its second consecutive six-month decline in history, following its first consecutive six-month drop, after which it surged by 208%.
BlockBeats news, on March 29, according to Coinglass data, Bitcoin's return rate for March this year is currently reported at -0.76%, which may mark the sixth consecutive month of decline.
Historically, Bitcoin has only experienced a similar situation once: from August 2018 to January 2019, it fell approximately 54.8% over six months. Subsequently, Bitcoin saw a continuous rise for five months (from February 2019 to June 2019), with a total increase of up to 208%.
BlockBeatNews7m ago
Altcoin XRP Makes Bullish Breakout Against Bitcoin, Projecting a Possible Massive Surge Ahead
Altcoin XRP makes bullish breakout against Bitcoin (BTC).
The asset is projected towards hitting bullish new ATH prices.
The price of XRP could surge over 600% to hit ATH targets over $10.
The crypto market prepares to see Bitcoin (BTC) make its sixth consecutive red close, a pattern
CryptoNewsLand21m ago
Over $14 billion in Bitcoin options will expire on Friday, with the market closely watching the $75,000 "magnetic price level."
This Friday, Deribit will settle approximately $14.16 billion in Bitcoin options, with the market expecting $75,000 as a key "magnet price." The current price of Bitcoin is around $71,617, still some distance from the most painful point of $75,000, and significant volatility may occur in the next two days. Although market sentiment is focused on a rebound, the demand for hedging remains high, reflecting short-term fluctuation risks.
区块客27m ago
Pi Network’s PI Token Rebounds, Bitcoin (BTC) Maintains $66K: Weekend Watch
Bitcoin's price has stabilized above $66,000 despite recent volatility influenced by geopolitical events. Altcoins, including ETH and XRP, have seen minimal movement, while some smaller coins like SIREN and PI experience notable gains. The overall crypto market cap remains steady.
CryptoPotato30m ago
85% or 200% Surge Next for Cardano? ADA Tests Key Level Linked to Historic Breakouts
Cardano’s native token has been among the poorest performers in the past year, with on-chain data suggesting that ADA active wallets are down over 40% on their investments within this timeframe.
However, this could actually be bullish for the underlying asset, especially when it’s combined with ano
CryptoPotato37m ago
The next big Bitcoin shock could be when Wall Street loses confidence and starts selling
Bitcoin's recent drop below $67,000 marks a significant correction, but unlike past declines, market reactions are noticeably calmer. The endurance of the Bitcoin spot ETF in the U.S. suggests that new holders exhibit greater patience. Despite fluctuations and macroeconomic influences, a mass sell-off hasn't occurred, indicating a shift in investor behavior that may define Bitcoin's future cycles.
TapChiBitcoin56m ago
