Date: Fri, Dec 26, 2025 | 11:40 AM GMT
The broader cryptocurrency market is showing modest strength, with both Bitcoin (BTC) and Ethereum (ETH) trading in the green. This steady performance among the major assets has helped stabilize overall sentiment, allowing select altcoins — including** Solana (SOL) **— to begin showing constructive technical setups.
SOL is trading with a modest intraday gain, but more importantly, its price structure is starting to tell a much bigger story. The 4-hour chart reveals a well-defined harmonic pattern that suggests Solana may be preparing for another leg higher in the near term.
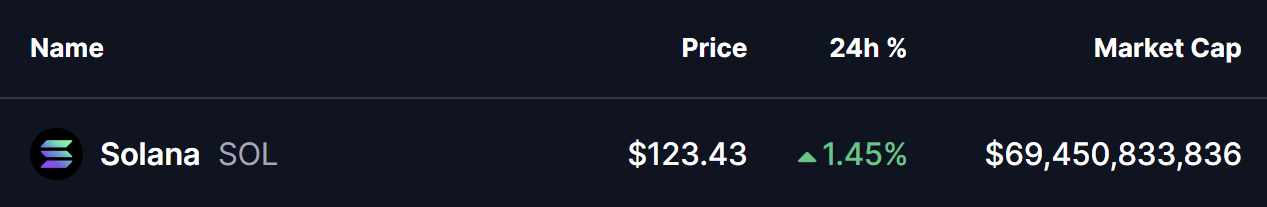
Source: Coinmarketcap
Bearish Bat Pattern in Play?
On the 4-hour timeframe, Solana appears to be forming a Bearish Bat harmonic pattern. While the name may sound negative, this structure typically allows for a bullish move toward the completion point (D) before any potential reversal takes place.
The pattern began at Point X near the $140.11 level, followed by a sharp decline toward Point A. From there, SOL rebounded to Point B before undergoing a deeper corrective move into Point C around $119.24. This zone acted as a key support area, where buyers stepped back in.
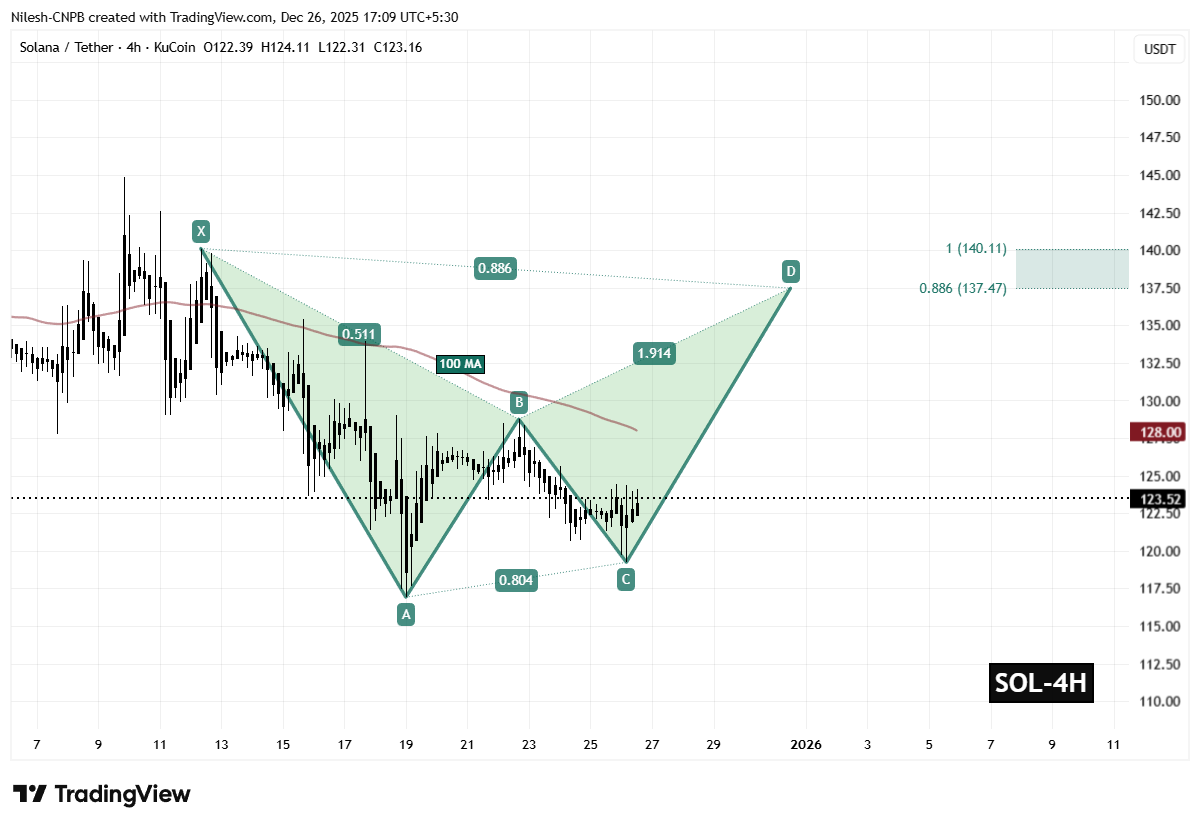
Solana (SOL) 4H Chart/Coinsprobe (Source: Tradingview)
Since printing the Point C low, SOL has started to recover steadily and is now trading near $123.52. This rebound suggests that selling pressure is weakening and that bulls are gradually regaining control.
Adding further technical significance, the 100-hour moving average is currently positioned around $128.00. A successful reclaim and hold above this level would strengthen the bullish case and confirm improving momentum.
What’s Next for SOL?
If buyers continue to defend the $119.24 support zone and manage to flip the 100-hour moving average into support, the Bearish Bat pattern points toward a potential rally into the Potential Reversal Zone (PRZ).
Based on Fibonacci projections, the PRZ is located between:
$137.47 (0.886 Fib extension) and $140.11 (1.0 Fib extension).
This target zone represents an upside of roughly 13% from current price levels and aligns closely with classic harmonic completion areas where price often reacts sharply.
However, if SOL fails to hold above the CD-leg support and slips back below the $119 region, the structure could weaken. In that case, the bullish scenario may be delayed, opening the door for a short-term correction before any renewed attempt higher.
For now, SOL remains technically constructive, with the harmonic pattern suggesting that the next meaningful move could favor the upside if current support levels continue to hold.
Disclaimer: The views and analysis presented in this article are for informational purposes only and reflect the author’s perspective, not financial advice. Technical patterns and indicators discussed are subject to market volatility and may or may not yield the anticipated results. Investors are advised to exercise caution, conduct independent research, and make decisions aligned with their individual risk tolerance.
Disclaimer: The information on this page may come from third parties and does not represent the views or opinions of Gate. The content displayed on this page is for reference only and does not constitute any financial, investment, or legal advice. Gate does not guarantee the accuracy or completeness of the information and shall not be liable for any losses arising from the use of this information. Virtual asset investments carry high risks and are subject to significant price volatility. You may lose all of your invested principal. Please fully understand the relevant risks and make prudent decisions based on your own financial situation and risk tolerance. For details, please refer to
Disclaimer.
Related Articles
Paxos Integrates Solana to Power Enterprise Stablecoin Solutions
Paxos has partnered with the Solana Developer Platform to enhance enterprise capabilities in stablecoin issuance, global payment orchestration, and self-custody solutions. This collaboration aims to streamline financial transactions and ensure compliance for tokenized products.
BlockChainReporter31m ago
Solana Foundation Launches Enterprise Development Platform, Mastercard and Western Union Join
The Solana Foundation launched the Solana Developer Platform (SDP) on March 24, aimed at helping enterprises and financial institutions build financial products on blockchain. The SDP includes three major API modules for issuance, payments, and trading, lowering development barriers for enterprises and has already attracted Mastercard, Western Union, and Worldpay as early adopters. The platform offers a sandbox environment and AI coding integration, enabling institutions to conduct low-risk testing and compliant development.
MarketWhisper53m ago
SOL Breaks Through 90 USDT, 24-Hour Decline Narrows to 1.76%
Gate News reports that on March 24, market data from a certain CEX shows that SOL broke through 90 USDT, now trading at 90.02 USDT, with the 24-hour decline narrowing to 1.76%.
GateNews6h ago
Solana Reclaims $90 as Golden Cross Signals Renewed Momentum
Solana has surpassed the $90 resistance, aided by a golden cross indicating positive momentum, despite low trading volume. Strong on-chain growth supports price stability, and sustained support above $89.50 could push Solana towards $96, though higher volume is crucial for confirming a breakout.
CryptoNewsLand7h ago
Bitcoin and Solana ETFs See Inflows While Ethereum ETFs Record Outflows on March 24
Gate News bot message, according to the March 24 update, Bitcoin ETFs recorded a 1-day net inflow of 2,715 BTC (+$190.21M) and a 7-day net inflow of 1,091 BTC (+$76.44M). Ethereum ETFs showed a 1-day net outflow of 12,464 ETH (-$26.61M) and a 7-day net outflow of 97,844 ETH (-$208.9M). Solana ETFs r
GateNews10h ago
