Tron (TRX) is recorded trading above the $0.2800 USD threshold at the time of writing on Monday, maintaining a sideways movement just below the 50-day exponential moving average (EMA), which currently stands at $0.2859 USD. Notably, Justin Sun – the founder of Tron – announced a $18 million equity investment in Tron Inc., a company listed on the Nasdaq (formerly SRM Entertainment, Inc.), with the goal of further strengthening and expanding the company’s TRX reserves. On the technical side, momentum indicators are signaling positive trends and gradually leaning towards an upward trend. However, in the short term, TRX may face resistance at key overhead levels.
Justin Sun makes a strategic equity investment of $18 million
On Monday, Tron Inc. received an $18 million equity investment from Justin Sun through Black Anthem Limited, aimed at boosting the strategy to expand TRX reserve holdings. The transaction was executed at a price of $1.3775 per share.
As of Tuesday, Tron Inc. holds over 677 million TRX tokens, accounting for approximately 0.716% of the total circulating supply, with an estimated value exceeding $193 million — reaffirming the company’s growing position within the TRON ecosystem.
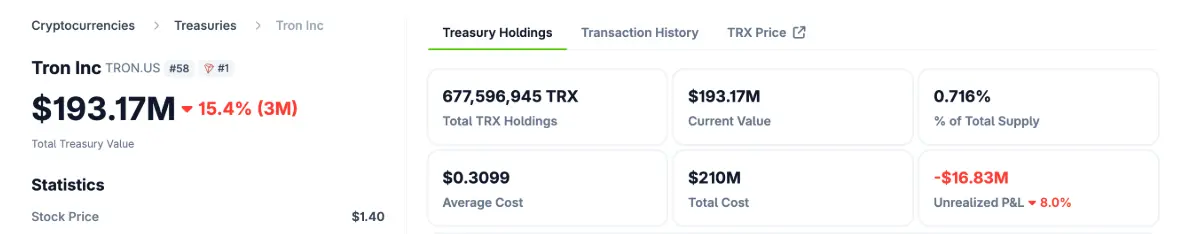 The amount of TRX held by Tron Inc. | Source: CoinGeckoSharing his long-term strategy, Mr. Rich Miller, CEO of Tron Inc., emphasized: “We are proactively positioning Tron Inc. to capitalize on the increasing adoption of the TRON network, blockchain-based global payment solutions, and Web3 infrastructure. The new capital not only strengthens our balance sheet but also expands our digital asset reserves, laying a solid foundation for sustainable value growth for shareholders in the long run.”
Tron’s recovery trend faces a crossroads at the 50-day EMA
The price of Tron (TRX) has established a solid support zone around $0.2764 USD — the low recorded on November 4 — during Thursday’s trading session, before rebounding nearly 2% on Saturday. However, this recovery still encounters significant resistance as it approaches the 50-day exponential moving average (EMA) at $0.2859 USD. Selling pressure around this level is reflected in a series of Doji candles with long wicks, indicating strong indecision between bulls and bears.
Nevertheless, the appearance of long-bodied candles suggests underlying buying interest is quietly accumulating, increasing the likelihood that TRX could break above the 50-day EMA in the coming sessions. A clear close above $0.2859 USD would open up room for further recovery, targeting the 200-day EMA at $0.2944 USD.
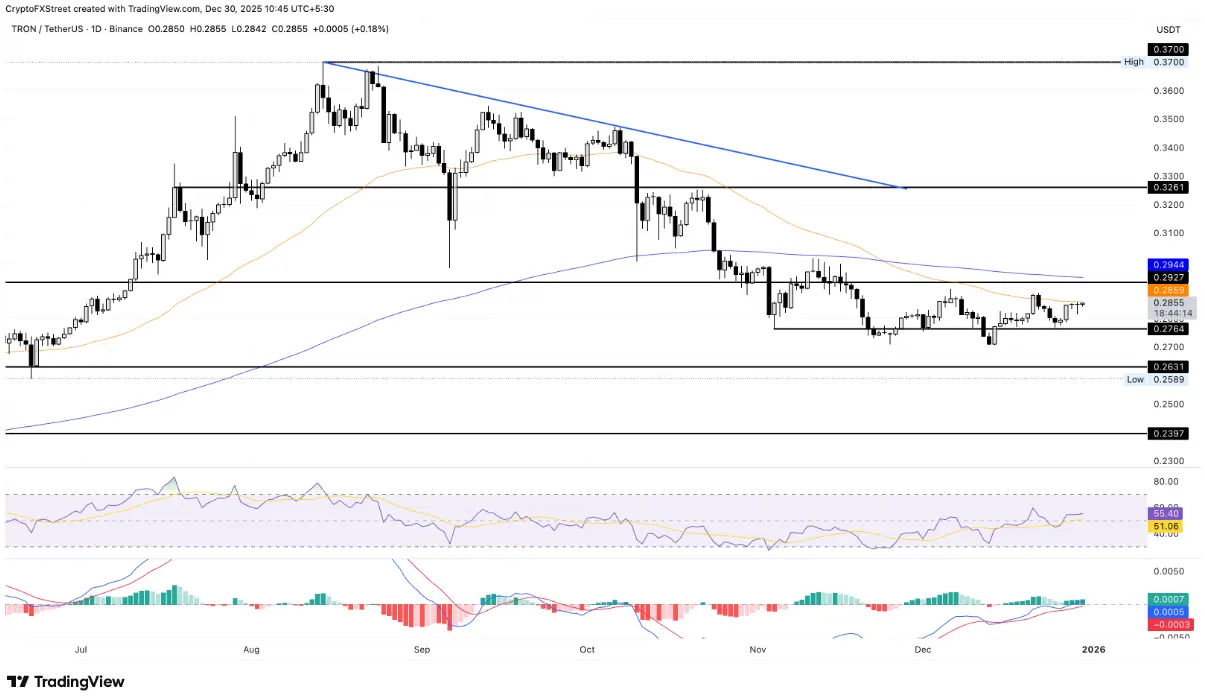 Daily TRX/USDT chart | Source: TradingViewRegarding indicators, the Relative Strength Index (RSI) on the daily timeframe remains around the 55 level and stays above the neutral line, indicating buying momentum has not weakened despite short-term fluctuations. Meanwhile, the MACD line has crossed above zero, with the signal line continuing to trend upward, further supporting a positive outlook for TRX’s short-term trend.
Conversely, if the price reverses downward and loses the support level of $0.2764 USD, the short-term recovery outlook will be invalidated, and there is a risk that TRX could retreat to the May 31 low at $0.2631 USD.
Disclaimer: The information on this page may come from third parties and does not represent the views or opinions of Gate. The content displayed on this page is for reference only and does not constitute any financial, investment, or legal advice. Gate does not guarantee the accuracy or completeness of the information and shall not be liable for any losses arising from the use of this information. Virtual asset investments carry high risks and are subject to significant price volatility. You may lose all of your invested principal. Please fully understand the relevant risks and make prudent decisions based on your own financial situation and risk tolerance. For details, please refer to
Disclaimer.
Related Articles
XRP Faces Pressure as Network Usage and Momentum Decline
Key Insights
XRP Ledger transactions and active accounts dropped sharply, signaling reduced usage and weakening demand that directly impacts the asset’s broader market outlook.
Price continues to face resistance at key technical levels, while compression below moving averages reflects
CryptoNewsLand12m ago
Solana Price Holds Near $80 as Analysts Split on Next Move
Key Insights:
Solana trades near $80 under pressure, with persistent lower highs and weak recovery attempts reinforcing a clear short-term bearish market structure.
Analysts identify the $75 to $45 range as a key accumulation zone, supported by historical demand levels and long-term
CryptoNewsLand22m ago
ETH drops 0.67% in 15 minutes: short-term profit-taking triggers a pullback
During the period from 2026-03-30 19:00 to 19:15 (UTC), the ETH spot return recorded -0.67%, with a price range of 2014.67 to 2032.63 USDT and a volatility amplitude of 0.88%. Trading in the market during this time window was active, with significant short-term fluctuations, drawing investor attention. Market data shows that, compared with the previous trading day, trading volume expanded in parallel, indicating that more capital battles were being concentrated and released in the short term. The main driving force behind this abnormal move was the proactive selling by short-term profit-taking positions and the concentrated execution of certain large sell orders. Intraday market action originally continued the prior uptrend, but then it was interrupted by this sudden fluctuation, leading to increased volatility and a shift in market sentiment.
GateNews36m ago
Bitcoin ETF Investors in Red Amid Price Decline
Bitcoin ETF holders are facing an average loss of 10% as the price of Bitcoin remains below its realized price. This downturn reflects a broader decline in the spot price and raises concerns about market pressure and future trends.
BlockChainReporter48m ago
Shiba Inu Holds Range While Rising Reserves Signal Growing Sell Pressure
Shiba Inu's massive -1,813% spot flow change reflects low baseline distortion rather than actual capital flight, with exchange reserves increasing and modest market activity, indicating steady sell-side pressure but limited momentum.
CryptoFrontNews52m ago
Dogecoin Holds Key Support as 23% YTD Drop Deepens
Key Insights:
Dogecoin has declined over 23% year to date, with broader macroeconomic pressure and weak crypto sentiment driving sustained selling across major digital assets.
The $0.07 to $0.08 range remains a historically strong support zone, previously triggering sharp recoveries and
CryptoNewsLand1h ago
