Just like yesterday, bitcoin’s price has floated in a tight band between $87,831 and $88,067 in the last hour, revealing a market hesitant to make its next move. With a market cap of $1.75 trillion and a moderate 24-hour trading volume of $35.50 billion, bitcoin may be range-bound for now, but the undercurrents are far from still. Price action over the last 24 hours has etched out an intraday range of $86,855 to $88,037, indicating a market caught in a quiet tug-of-war.
Bitcoin Chart Outlook
From the daily chart (1D), the broader trend is gritting its teeth in a cool-down phase after a descent from a swing high near $94,652 per bitcoin. The current structure is defined by lower highs, with the price recently bouncing off support at $83,814 only to be smacked back down near $89,000–$90,000.
The candlesticks are whispering indecision—small-bodied, low volume, and plenty of hesitation. Traders eyeing a break above $88,800 may be chasing ghosts unless volume joins the party. Meanwhile, a dip below $86,500 would be a tell-tale sign that bears still own the stage.
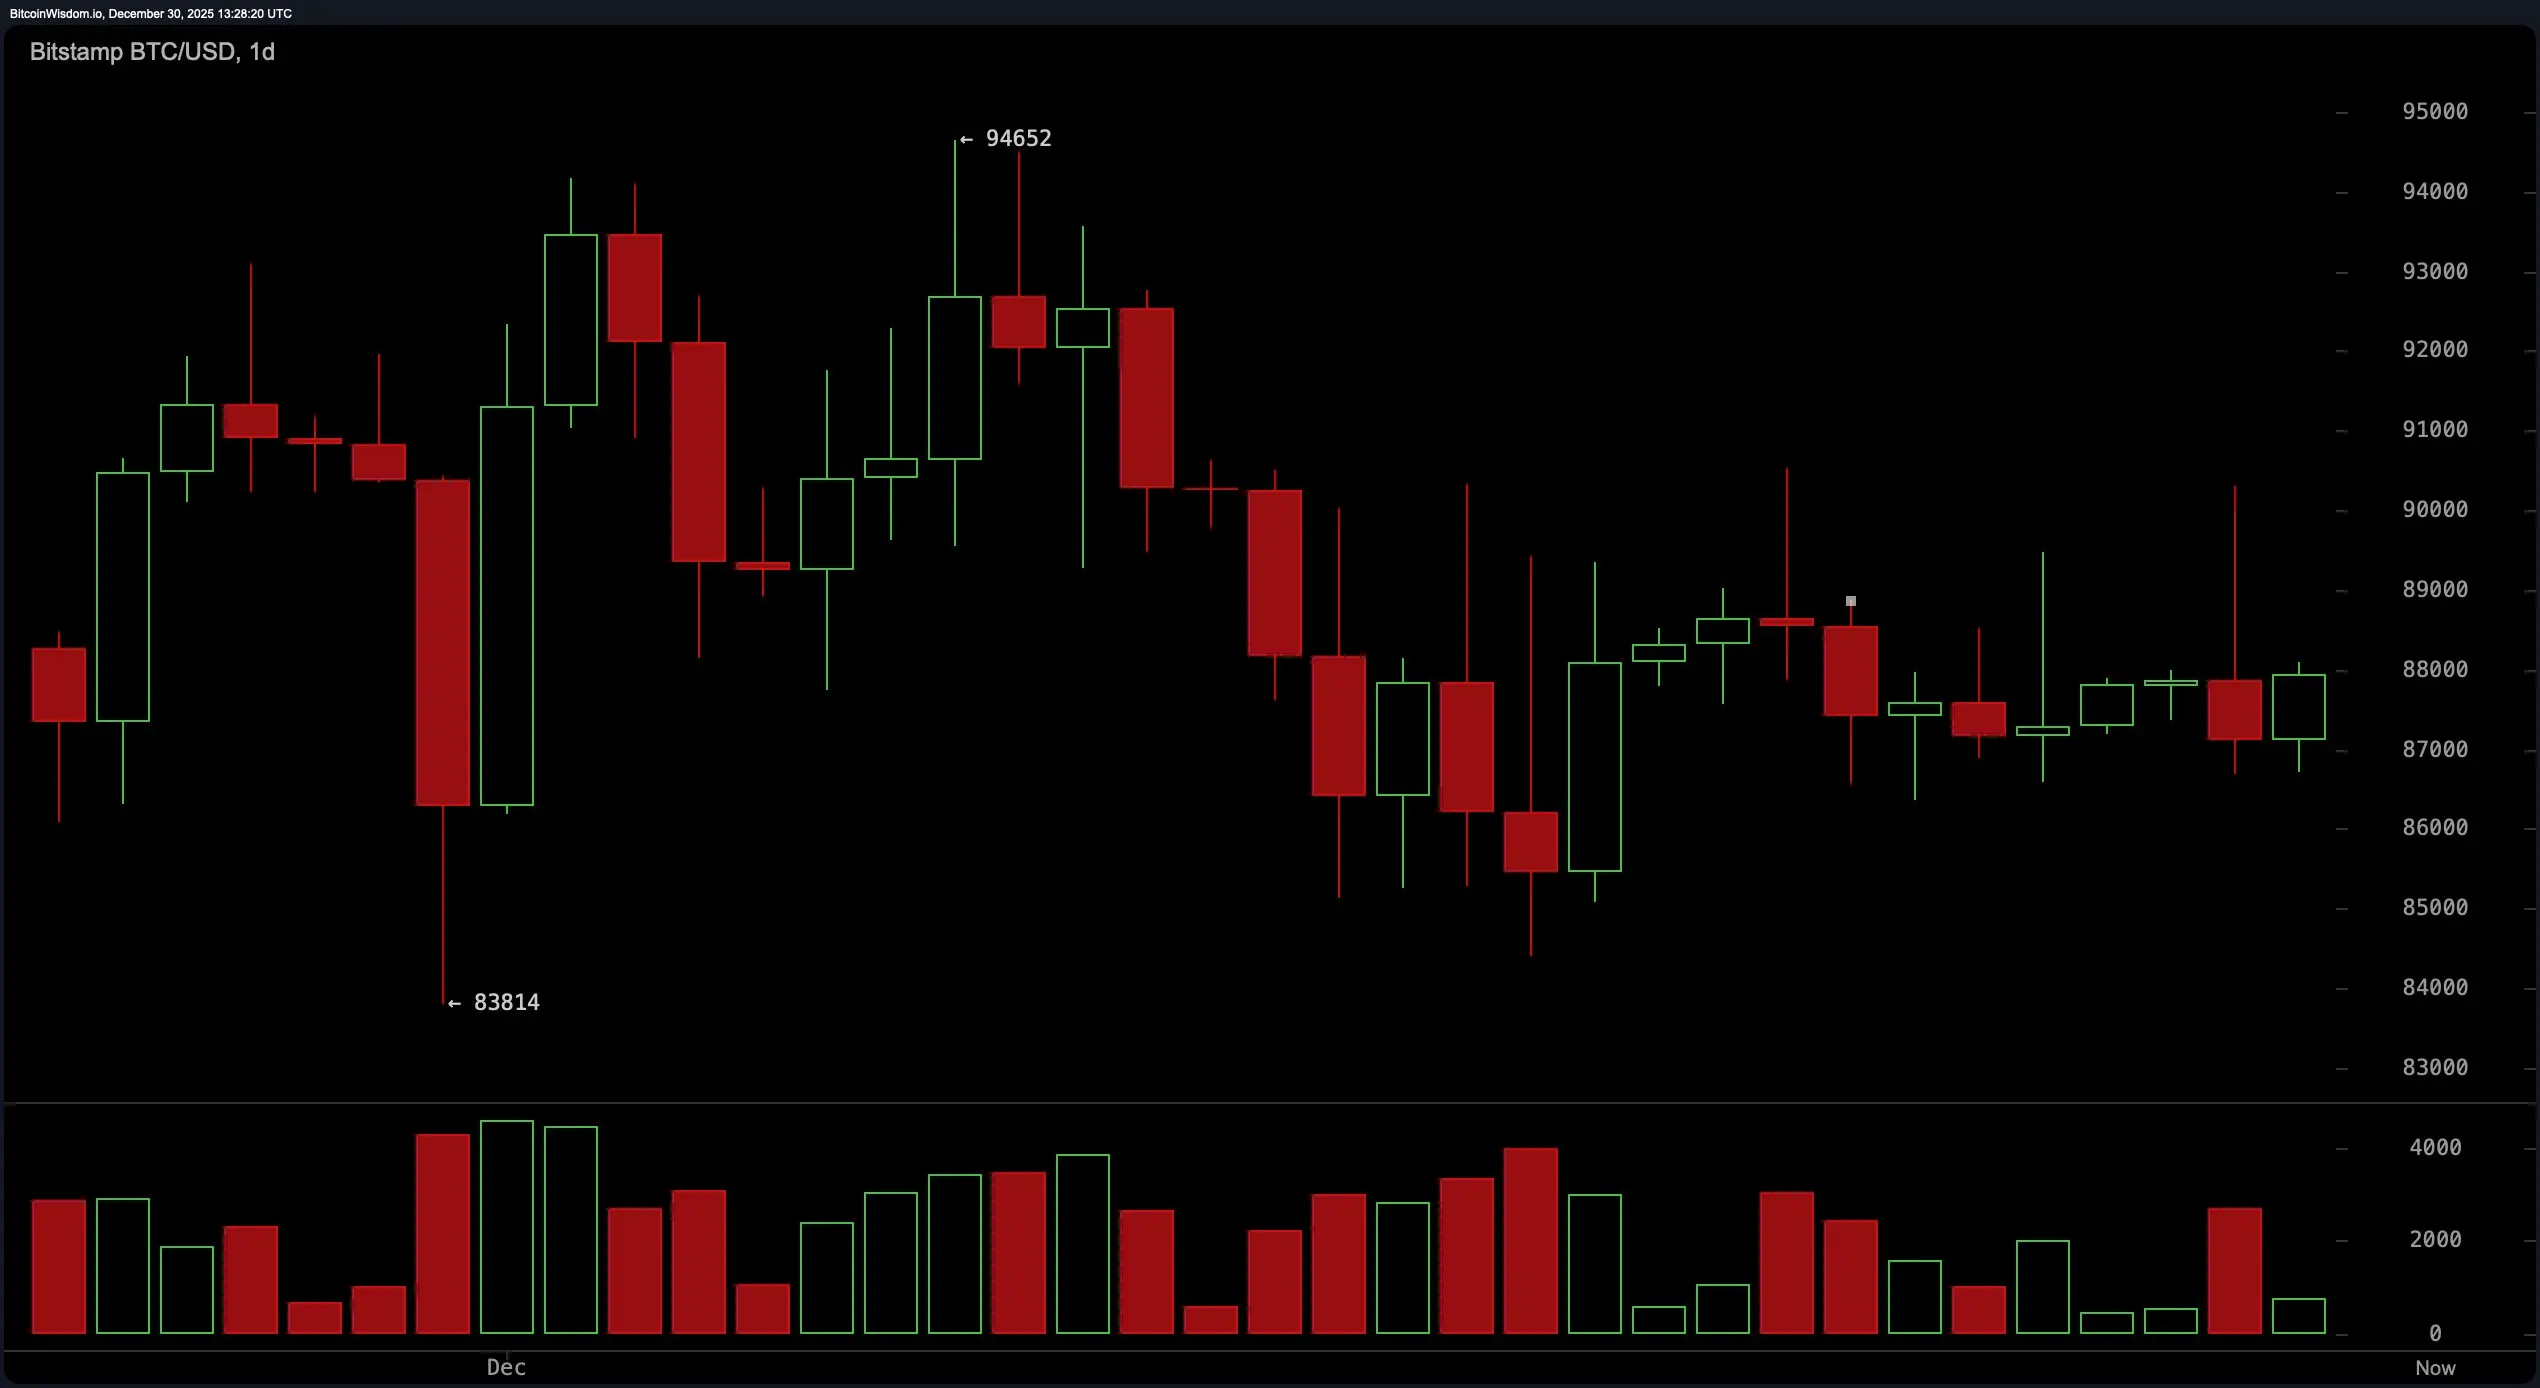 BTC/USD 1-day chart via Bitstamp on Dec. 30, 2025.
Zooming into the 4-hour chart (4H), bitcoin shows signs of bruising after a sharp fall from $90,307 to $86,584, with a half-hearted recovery to the $88,000 region. Resistance is pressing down at $88,200 like a stubborn ceiling, while support below is hanging on at $86,500–$86,800. Momentum here is fragile, and every bullish push lacks conviction, underscored by waning volume. For those watching this timeframe, the market is flirting with potential—just not commitment. The playbook here remains flexible, with short-term moves hinging on volume validation and quick reaction times.
BTC/USD 1-day chart via Bitstamp on Dec. 30, 2025.
Zooming into the 4-hour chart (4H), bitcoin shows signs of bruising after a sharp fall from $90,307 to $86,584, with a half-hearted recovery to the $88,000 region. Resistance is pressing down at $88,200 like a stubborn ceiling, while support below is hanging on at $86,500–$86,800. Momentum here is fragile, and every bullish push lacks conviction, underscored by waning volume. For those watching this timeframe, the market is flirting with potential—just not commitment. The playbook here remains flexible, with short-term moves hinging on volume validation and quick reaction times.
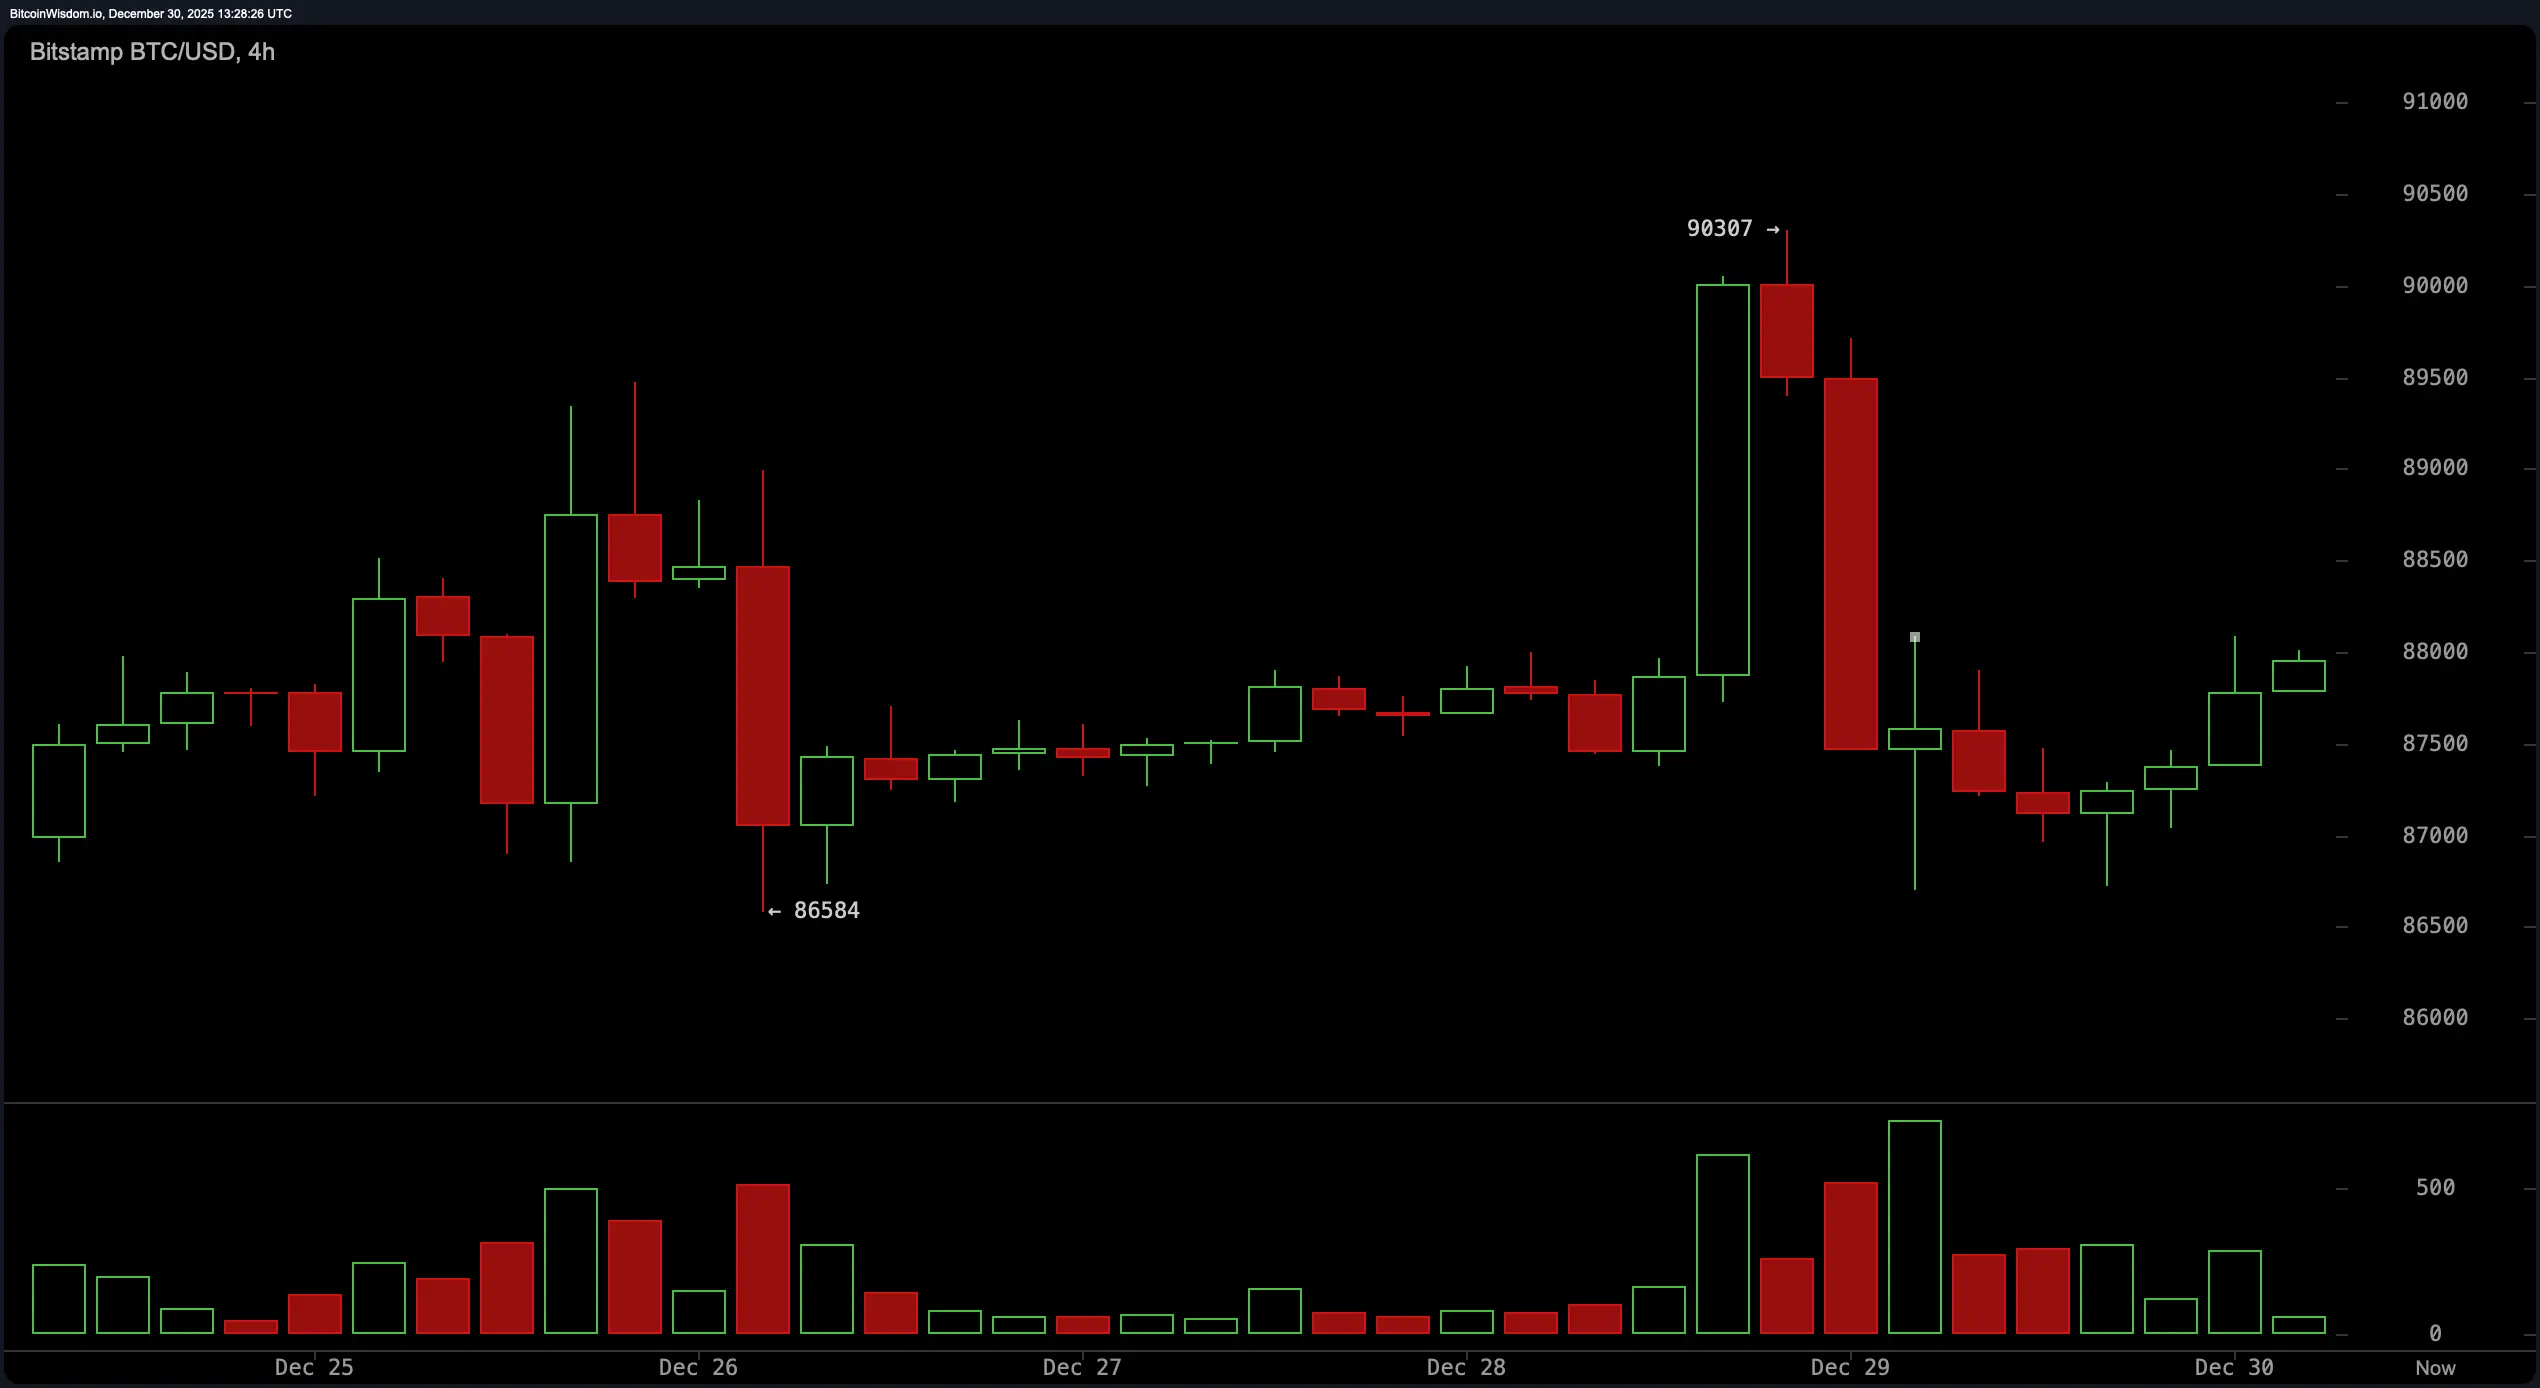 BTC/USD 4-hour chart via Bitstamp on Dec. 30, 2025.
On the 1-hour chart (1H), the tone is cautiously hopeful—but let’s not get ahead of ourselves. Bitcoin recently nose-dived from $90,307 to $86,701 and is now attempting to claw its way back with a rounded base forming near $88,000. This level has been a sticky resistance zone, acting like a bouncer at the club door. While candles are stacking up with more optimism than before, the momentum remains shaky. Traders looking for any decisive move will need to see a clean break above $88,000 with volume that means it. Except the 1H chart looks like a long snake of consolidation going nowhere, at least for now.
BTC/USD 4-hour chart via Bitstamp on Dec. 30, 2025.
On the 1-hour chart (1H), the tone is cautiously hopeful—but let’s not get ahead of ourselves. Bitcoin recently nose-dived from $90,307 to $86,701 and is now attempting to claw its way back with a rounded base forming near $88,000. This level has been a sticky resistance zone, acting like a bouncer at the club door. While candles are stacking up with more optimism than before, the momentum remains shaky. Traders looking for any decisive move will need to see a clean break above $88,000 with volume that means it. Except the 1H chart looks like a long snake of consolidation going nowhere, at least for now.
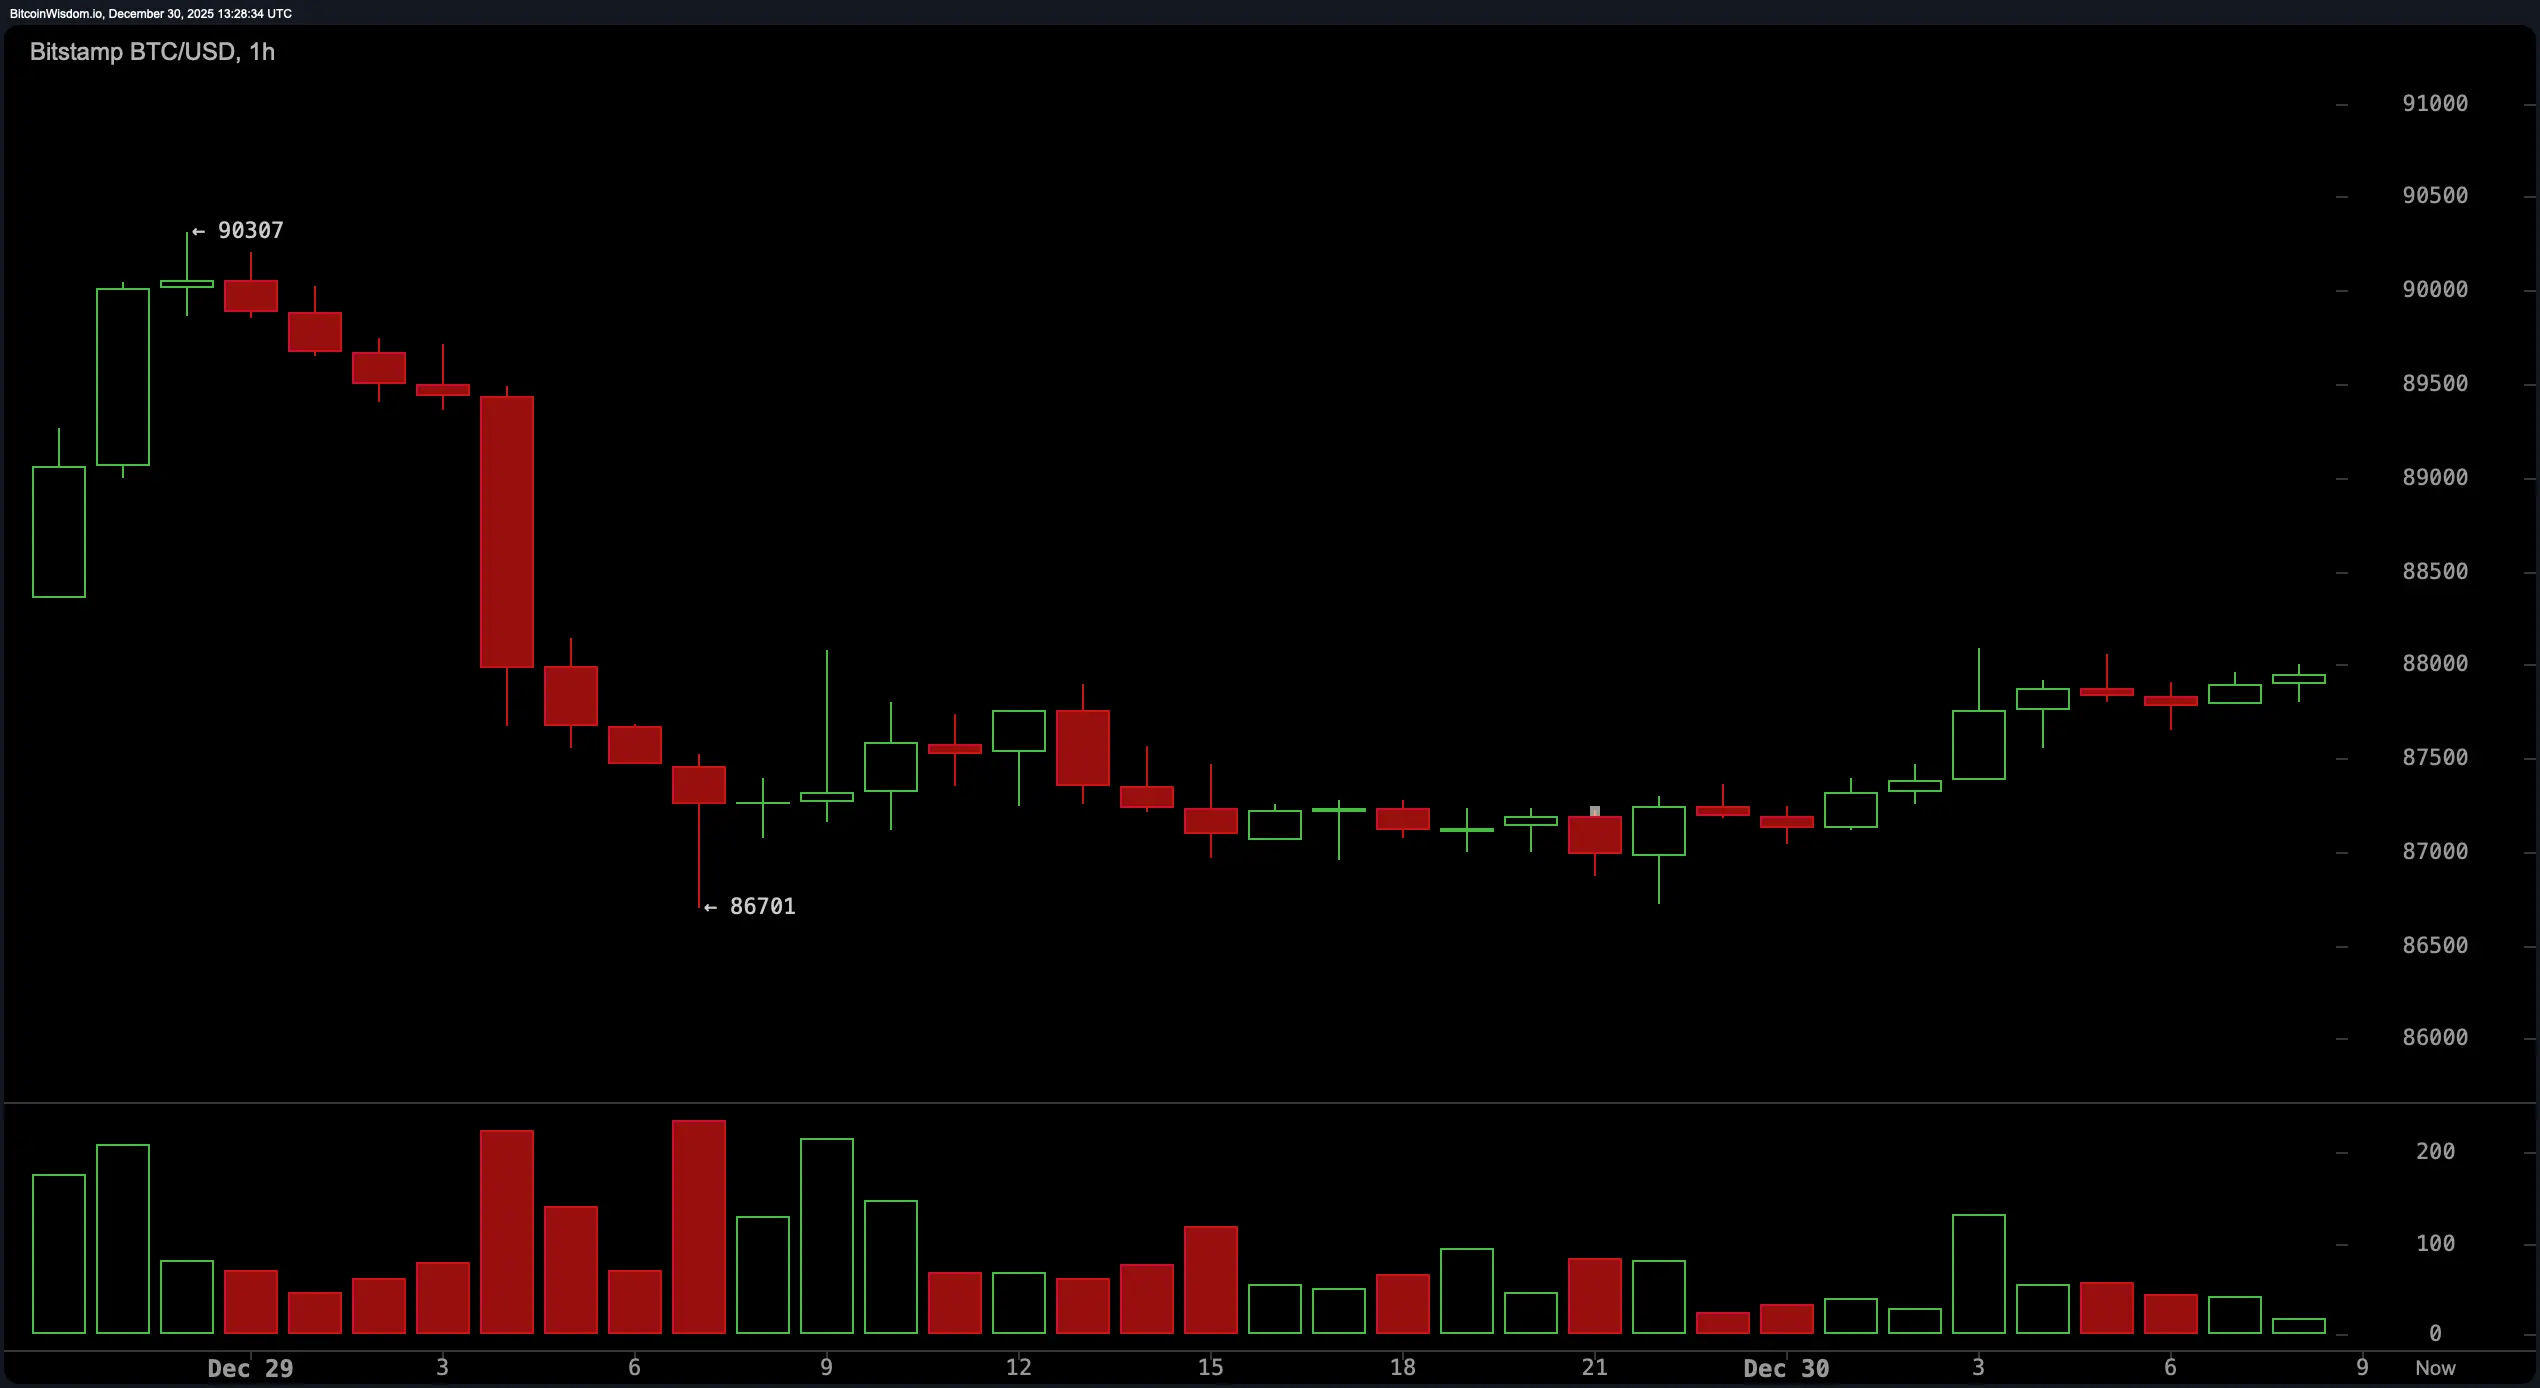 BTC/USD 1-hour chart via Bitstamp on Dec. 30, 2025.
Looking at the technical indicators, the oscillators are giving off “meh” energy across the board. The relative strength index ( RSI) is sitting neutral at 46, while the stochastic oscillator reads 53, also neutral. The commodity channel index (CCI) rests at −40, echoing the same indecisiveness. Meanwhile, the average directional index (ADX) is at 18—translation: the trend strength is about as confident as a cat in a dog park. However, the moving average convergence divergence ( MACD) sits at −1,019, indicating a glimmer of bullish momentum alongside the momentum oscillator, which reads −328.
BTC/USD 1-hour chart via Bitstamp on Dec. 30, 2025.
Looking at the technical indicators, the oscillators are giving off “meh” energy across the board. The relative strength index ( RSI) is sitting neutral at 46, while the stochastic oscillator reads 53, also neutral. The commodity channel index (CCI) rests at −40, echoing the same indecisiveness. Meanwhile, the average directional index (ADX) is at 18—translation: the trend strength is about as confident as a cat in a dog park. However, the moving average convergence divergence ( MACD) sits at −1,019, indicating a glimmer of bullish momentum alongside the momentum oscillator, which reads −328.
As for the moving averages, they read like a history lesson in recent disappointment. The exponential moving averages (EMA) and simple moving averages (SMA) for the 10-period both suggest upward momentum, holding above the current price at $87,733 and $87,741, respectively. But that’s where the optimism ends. Every other longer-term moving average—from the 20-period to the 200-period—leans downward, with EMAs and SMAs ranging from $88,050 to $107,094. That paints a clear picture: this market is still recovering from its last rollercoaster and isn’t ready for liftoff just yet.
Bull Verdict:
If bitcoin clears the $88,200–$89,200 resistance zone with strong volume and breaks out of its consolidation shackles, short-term upside toward $91,000–$93,000 remains on the table. The 10-period moving averages offer early support, and bullish momentum indicators—like the moving average convergence divergence ( MACD) and momentum oscillator—are trying to stir. Still, until volume kicks in, optimism must stay cautiously dressed.
Bear Verdict:
With longer-term moving averages casting a long shadow over current price action and volume on bullish pushes looking thinner than a blockchain whitepaper, bitcoin appears heavy at the top. Failure to break $88,000 convincingly could send it tumbling below $86,500, where downside targets near $84,000 are in play. Until proven otherwise, the broader structure still says lower highs—and that’s bearish DNA in action.
FAQ
- What is bitcoin’s current price range? Bitcoin is trading between $87,831 and $88,067 as of December 30, 2025.
- **Is bitcoin showing bullish or bearish signals?**Technical indicators show mixed signals with weak bullish momentum and bearish structure on higher timeframes.
- **What are key support and resistance levels for bitcoin now?**Support is near $86,500, while resistance looms between $88,000 and $89,200.
- What’s the trading volume and market cap for bitcoin? Bitcoin’s 24-hour volume is $35.50 billion with a market cap of $1.75 trillion.
Disclaimer: The information on this page may come from third parties and does not represent the views or opinions of Gate. The content displayed on this page is for reference only and does not constitute any financial, investment, or legal advice. Gate does not guarantee the accuracy or completeness of the information and shall not be liable for any losses arising from the use of this information. Virtual asset investments carry high risks and are subject to significant price volatility. You may lose all of your invested principal. Please fully understand the relevant risks and make prudent decisions based on your own financial situation and risk tolerance. For details, please refer to
Disclaimer.
Related Articles
When to Buy Bitcoin Next? Analyst Outlines Exact Entry Levels
Bitcoin dumped hard in early February, plunging to a 15-month low of $60,000. This meant that it had shed over 50% of its value since early October when it peaked at over $126,000.
Although it has recovered roughly 20% since that low and sits close to $72,000 now, there are still some analysts
CryptoPotato9m ago
Bitcoin miner Soluna acquires $53M wind farm to power AI facility
Soluna Holdings, a publicly traded Bitcoin (BTC) mining and AI infrastructure company focused on renewable energy, announced on Thursday that it closed a $53 million deal to acquire a wind farm to power its upcoming Project Dorothy 3 AI data center campus.
The
Cointelegraph11m ago
Bitcoin’s $70K Ceiling Won’t Break and Here’s Why
_Bitcoin grinds in a tight range as whale delta stays deeply negative and open interest fails to expand with price, signaling trouble for bulls eyeing $70K._
Bitcoin is still stuck. Price pushed toward $69K Thursday and got sold immediately. Again.
That pattern has played out multiple times
LiveBTCNews27m ago
VALR Launches VALR Bitcoin and Gold Bundle (BITGOLD) for Diversified Exposure
[PRESS RELEASE – Johannesburg, South Africa, March 11th, 2026]
VALR, the largest crypto exchange in South Africa by trade volume, today announced the launch of its newest Crypto Bundle, the VALR Bitcoin and Gold Bundle (BITGOLD). This bundle provides investors with simplified exposure to both Bitco
CryptoPotato29m ago
Quantum-Powered Crypto Mining Is Here—But It Won't Help You Mine Bitcoin
In brief
Postquant Labs launched Quip Network, a blockchain testnet that allows mining with quantum computers or traditional hardware.
The system replaces Bitcoin-style hashing with optimization problems based on the Ising model.
The company says the network could also track quantum
Decrypt36m ago
Solana Holds Key Support as Bitcoin Rally Lifts Crypto Market
Solana's price remained above $80 amid rising Bitcoin values, contributing to a broader crypto market recovery with a capitalization of $2.35 trillion. Institutional demand and easing geopolitical tensions supported this growth, while Solana led in decentralized finance activity, recording significant DEX and stablecoin volumes in March.
CryptoNewsLand41m ago
