
Date: Thu, Jan 01, 2026 | 10:30 AM GMT
As the new year 2026 begins, the broader cryptocurrency market is showing modest weakness, with both Bitcoin (BTC) and Ethereum (ETH) trading slightly in the red. This soft start has weighed on sentiment across the altcoin space as well, including Monad (MON). However, beneath the surface, MON’s chart structure is beginning to tell a more constructive story.
MON is currently down around 4% on the day, extending its 60-day decline to roughly 21%. While short-term price action remains subdued, the more important signal is emerging on the daily chart, where price structure is beginning to hint at a meaningful shift. If confirmed, this setup could mark the early stages of a bullish continuation following a prolonged corrective phase.
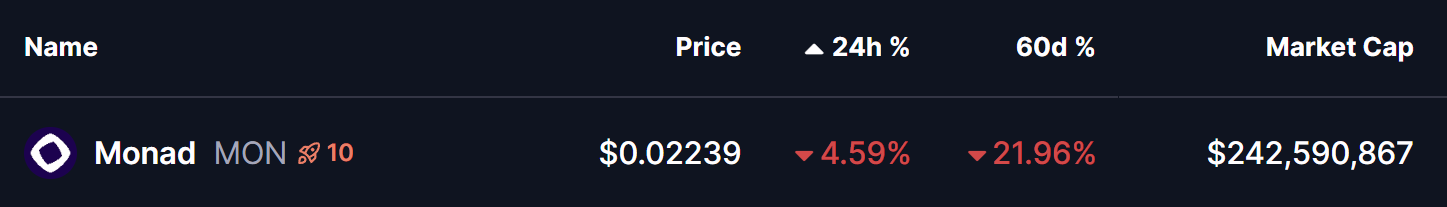
Source: Coinmarketcap
Rounding Bottom in Play
On the daily timeframe, MON appears to be forming a textbook rounding bottom pattern — a classic bullish reversal structure that typically develops after extended downside pressure. This pattern reflects a gradual transition from distribution to accumulation, where selling momentum weakens and buyers begin to step in more consistently.
Previously, MON faced strong rejection near the $0.04923 neckline zone, triggering a sharp decline that unfolded through late November and December. That move eventually found a floor near the $0.017 level, which has since acted as a key demand zone. Repeated defenses of this area prevented any deeper breakdown and helped establish a stable base for a potential trend reversal.
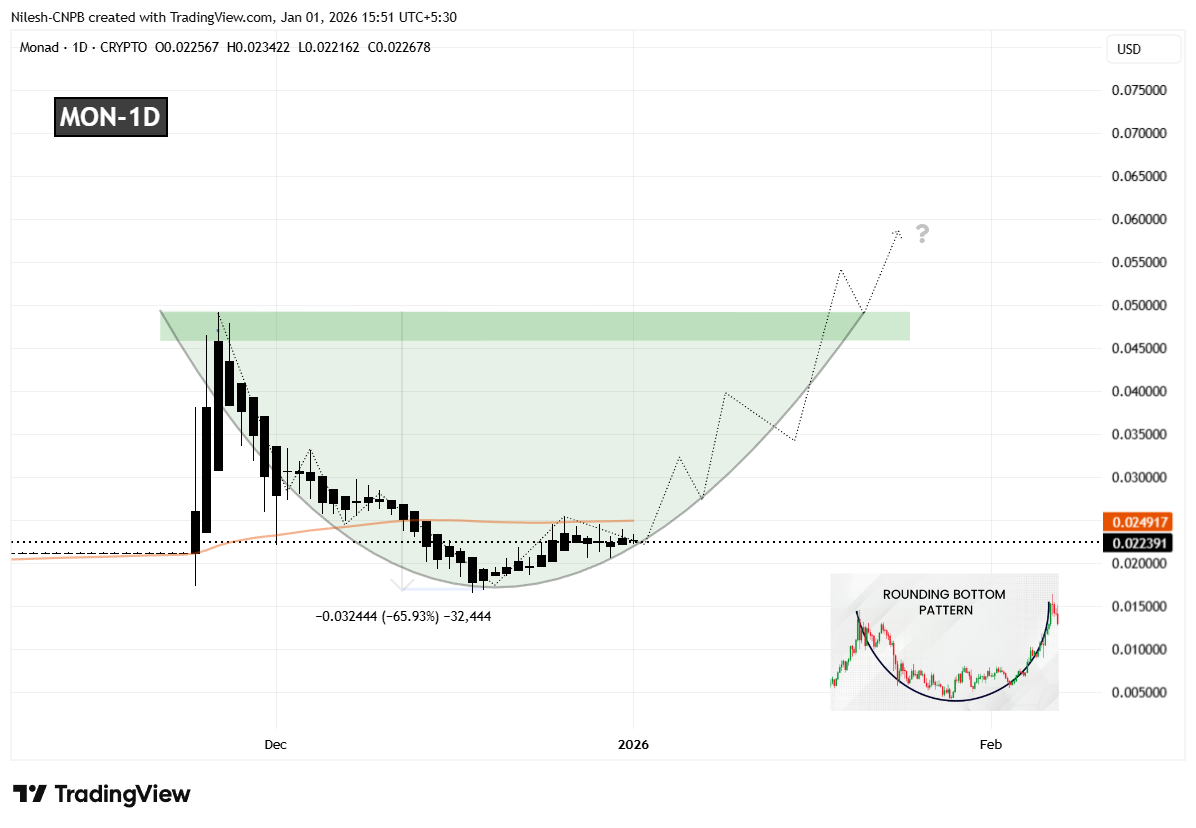
Monad (MON) Daily Chart/Coinsprobe (Source: Tradingview)
Since forming that bottom, MON has started to curve higher in a rounded fashion, closely matching the classic structure of a developing bottoming pattern. This gradual recovery suggests that selling pressure is fading rather than accelerating. The recent stabilization and recovery back above the $0.022 region further indicate that accumulation may be taking place as the market quietly prepares for a larger move.
What’s Next for MON?
For the rounding bottom pattern to move into confirmation, MON needs to reclaim the 50-day moving average, currently positioned near the $0.02491 level. A sustained move above this area would signal a shift in short-term momentum and confirm that buyers are beginning to regain control after months of corrective price action.
Looking ahead, the most significant technical hurdle remains the neckline resistance around $0.04923. A clean and decisive breakout above this zone would validate the entire reversal structure and could open the door for a broader bullish expansion phase, with momentum traders likely returning to the market.
Until those levels are reclaimed, the pattern remains in its early development stage. Short-term pullbacks or consolidation remain possible if MON struggles near the 50-day moving average. However, as long as price continues to hold higher lows above the $0.017 base, the broader bottoming structure remains intact.
Overall, MON’s emerging rounding bottom formation suggests the token may be approaching an important inflection point. While confirmation is still pending, the improving structure and alignment with a classic bullish pattern indicate that the coming sessions could be decisive for Monad’s next directional move.
Disclaimer: The views and analysis presented in this article are for informational purposes only and reflect the author’s perspective, not financial advice. Technical patterns and indicators discussed are subject to market volatility and may or may not yield the anticipated results. Investors are advised to exercise caution, conduct independent research, and make decisions aligned with their individual risk tolerance.
About Author: Nilesh Hembade is the Founder and Lead Author of Coinsprobe, with over 5 years of experience in the cryptocurrency and blockchain industry. Since launching Coinsprobe in 2023, he has been providing daily, research-driven insights through in-depth market analysis, on-chain data, and technical research.

Disclaimer: The information on this page may come from third parties and does not represent the views or opinions of Gate. The content displayed on this page is for reference only and does not constitute any financial, investment, or legal advice. Gate does not guarantee the accuracy or completeness of the information and shall not be liable for any losses arising from the use of this information. Virtual asset investments carry high risks and are subject to significant price volatility. You may lose all of your invested principal. Please fully understand the relevant risks and make prudent decisions based on your own financial situation and risk tolerance. For details, please refer to
Disclaimer.
Related Articles
ETH 15-minute pullback of 1.00%: Large capital selling and leveraged derivatives amplify short-term volatility
2026-04-06 16:45 to 2026-04-06 17:00 (UTC), ETH saw a brief 1.00% drop within 15 minutes; the price fell from 2168.6 USDT to 2140.3 USDT, with a swing of 1.31%. This round of abnormal price movement has drawn market attention, with heightened short-term volatility and a corresponding increase in trading volume.
The main driver behind this move is on-chain data showing that large ETH transfers of more than $10M per transaction were concentrated into a certain major exchange; the related net inflow of funds reached as high as 6,617.12 ETH. After the funds arrived,
GateNews21m ago
Hyperliquid Sees Sharp Volume Drop as Netflows Turn Deeply Negative
Hyperliquid’s derivatives volume dropped sharply, with some platforms reporting declines above 60%, signaling reduced speculative activity and weakening trader engagement across markets.
Netflows turned deeply negative near -285%, reflecting sustained capital withdrawal as both spot and
CryptoNewsLand38m ago
Bitcoin climbs above $70,000 as more contrarian bottoming signs emerge
Bitcoin's value surged past $70,000 amid a broader stock market rally, with a nearly 4% increase in 24 hours. Contrarian bulls highlight recent market signals, but uncertainty about the true bottom persists as mining companies sell off holdings.
CoinDesk43m ago
XRP Stabilizes Near Key Levels Amid Fed Pressure and Rule Shift
Key Insights
XRP stabilized near $1.31 as macroeconomic pressures and declining liquidity combined to limit recovery momentum and increase short-term volatility risks significantly.
Proposed stablecoin regulations favor utility models, positioning RLUSD for growth while reducing incentives t
CryptoNewsLand53m ago
Solana Holds Key Support as Range Tightens Below $90
Key Insights
Solana trades near $80 support as price compresses within a tight range, reflecting reduced volatility and balanced market participation among traders.
Persistent lower highs and price below major moving averages confirm ongoing bearish structure, limiting recovery attempts
CryptoNewsLand1h ago
3 Promising Cryptos to Watch Besides Bitcoin
Ethereum enables smart contracts and open financial access for global users.
Solana offers fast transactions and low fees for scalable decentralized applications.
Ripple supports fast, low-cost payments through an efficient consensus system.
Bitcoin often dominates headlines, but other c
CryptoNewsLand1h ago
