Cardano is once again trailing the market as the current recovery picks up speed. Over the past week, XRP has jumped roughly 13% and is now trading above $2.10, while meme coins like PEPE and BONK have posted even stronger gains. ADA, by comparison, is up around 7% over the same period. That gap matters, especially in a market where capital is clearly rotating toward assets showing momentum.
The underperformance is not new. XRP broke into new all-time highs during the 2025 cycle, while Cardano never came close to reclaiming its previous peak. Now, as the market attempts another leg higher, that divergence is starting to show again.
- ADA Chart analysis
- Why ADA is struggling versus XRP and meme coins
- ADA price outlook and the sell argument
ADA Chart analysis
The ADA chart you shows a fairly clear picture. ADA has been stuck in a slow, grinding downtrend for weeks. Price continues to make lower highs, with rallies repeatedly failing near the $0.45 to $0.46 area. Even the recent bounce has only pushed ADA back toward the $0.40–$0.41 zone, which previously acted as resistance.
On the downside, the chart shows a recent local low near $0.327. Even though price has bounced from that level, the move so far looks corrective rather than impulsive. There is no clean breakout structure yet, just a gradual recovery inside a broader range.
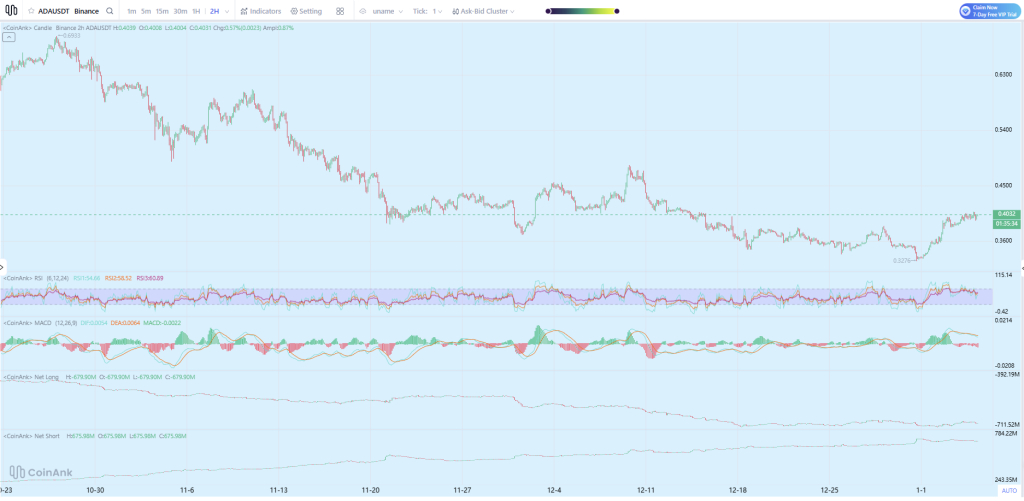
Source: CoinAnk
RSI reflects that lack of conviction. The indicator is hovering in the mid-range, without pushing into strong bullish territory. That usually signals weak momentum, especially when compared to assets that are already showing overbought conditions during strong trend moves.
MACD tells a similar story. While there has been some improvement from deeply negative levels, the histogram remains muted and the signal lines are not showing a decisive bullish expansion. This suggests that upside momentum is still fragile and could fade quickly if market conditions shift.
The positioning data adds another layer. Net longs have been declining steadily, while net shorts continue to build. That imbalance shows traders are not aggressively positioning for upside. Instead, many appear to be either hedging or betting that ADA will continue to lag relative to faster-moving assets.
Read also: Cardano Price Prediction: ADA Is Flashing a Familiar Setup
Why ADA is struggling versus XRP and meme coins
The contrast with XRP is especially important. XRP’s recent move came after a solid 2025 where price broke new highs, and is now holding above key psychological levels (over $2.00). That gives traders confidence to stay positioned. Meme coins, meanwhile, are benefiting from pure momentum and renewed retail interest, which tends to accelerate quickly once it starts.
Cardano does not currently have that tailwind. There is no clear catalyst on the chart, and the price action indicates hesitation. In a market where capital is chasing performance, slow movers often get sold to fund positions elsewhere.
ADA price outlook and the sell argument
From a short- to medium-term perspective, selling ADA here is not an unreasonable decision. The chart does not show a strong breakout, momentum indicators remain weak, and relative performance continues to disappoint. If the broader market pulls back, the ADA price could easily revisit lower support levels before finding real demand again.
That does not mean Cardano is finished or that it cannot perform later in the cycle. But right now, the market is sending a clear message. Assets with momentum are being rewarded, and ADA is not one of them. For traders focused on opportunity cost, rotating out of ADA while it remains range-bound is a defensible move, especially as other sectors continue to lead the recovery.
Disclaimer: The information on this page may come from third parties and does not represent the views or opinions of Gate. The content displayed on this page is for reference only and does not constitute any financial, investment, or legal advice. Gate does not guarantee the accuracy or completeness of the information and shall not be liable for any losses arising from the use of this information. Virtual asset investments carry high risks and are subject to significant price volatility. You may lose all of your invested principal. Please fully understand the relevant risks and make prudent decisions based on your own financial situation and risk tolerance. For details, please refer to
Disclaimer.
Related Articles
XRP Surges Toward $1.43 After Rebounding From $1.33 Demand Zone — Is $1.50 the Next Test?
XRP recovered out of the $1.33 Fibonacci demand pocket, with price supported at the $0.618 level at $1.3329.
The chart shows that, above the price of $1.34, there are several higher lows structures, representing a sustained recovery following the earlier fall just around the price of $1.26.
CryptoNewsLand2h ago
Price Predictions 3/13: BTC ETH BNB XRP SOL DOGE HYPE ADA BCH XMR
The article discusses price predictions for various cryptocurrencies including BTC, ETH, BNB, XRP, SOL, DOGE, HYPE, ADA, BCH, and XMR, providing insights into market trends and forecasts.
CryptoBreaking3h ago
XRP Price Prediction As Ripple Breaks Out and Expands in Australia, Could AlphaPepe Be the Next T...
XRP is back in the spotlight after a fresh breakout above a key resistance zone coincided with a meaningful business expansion for Ripple in Australia. That combination matters because traders are not just looking at a chart this time. They are looking at a token tied to a company that is still
BlockChainReporter3h ago
XRP Price Structure Tightens While Heatmap Highlights $1.30 Liquidity Zone
XRP trades near $1.37 support after a 0.9% daily decline, while the $1.44 level remains the immediate resistance in the current range.
A three-week liquidity heatmap highlights a large order cluster around $1.30, indicating a strong liquidity zone below price.
A three-month Gaussian
CryptoNewsLand3h ago