
Date: Fri, Jan 02, 2026 | 09:15 AM GMT
The broader cryptocurrency market has started the new year on a stable footing, with both Bitcoin (BTC) and Ethereum (ETH) trading slightly higher and posting gains of over 1.5%. This modest strength across major assets has provided breathing room for risk-on sentiment, allowing several memecoins to show early signs of recovery — including Popcat (SOL) (POPCAT).
POPCAT is currently trading by solid 19% higher on the day, but the more important development lies in its broader technical structure. After months of consistent downside pressure, the price action is now beginning to hint at a potential trend reversal, supported by a well-defined bullish pattern forming on the daily chart.
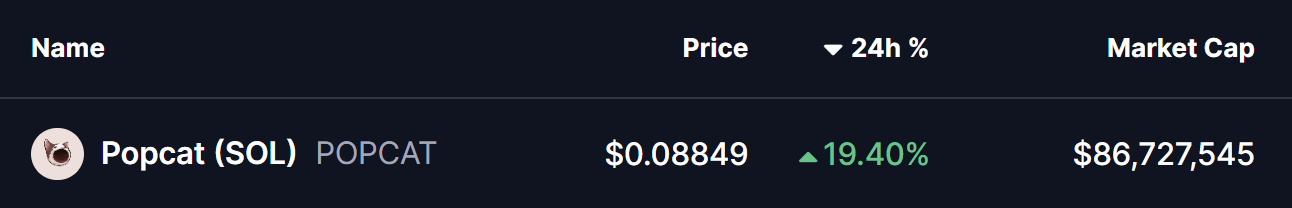
Source: Coinmarketcap
Falling Wedge Pattern in Play
On the daily timeframe, POPCAT appears to be carving out a falling wedge formation — a classic bullish reversal pattern that often develops after extended downtrends. This structure is characterized by lower highs and lower lows that gradually converge, reflecting weakening selling pressure and growing buyer interest near the lows.
Following weeks of steady decline, POPCAT recently established a local bottom near the $0.0725 region. This area acted as a strong demand zone, where buyers stepped in aggressively and prevented further downside. The resulting rebound pushed price back toward the $0.088 level, placing POPCAT just beneath the wedge’s upper resistance trendline.
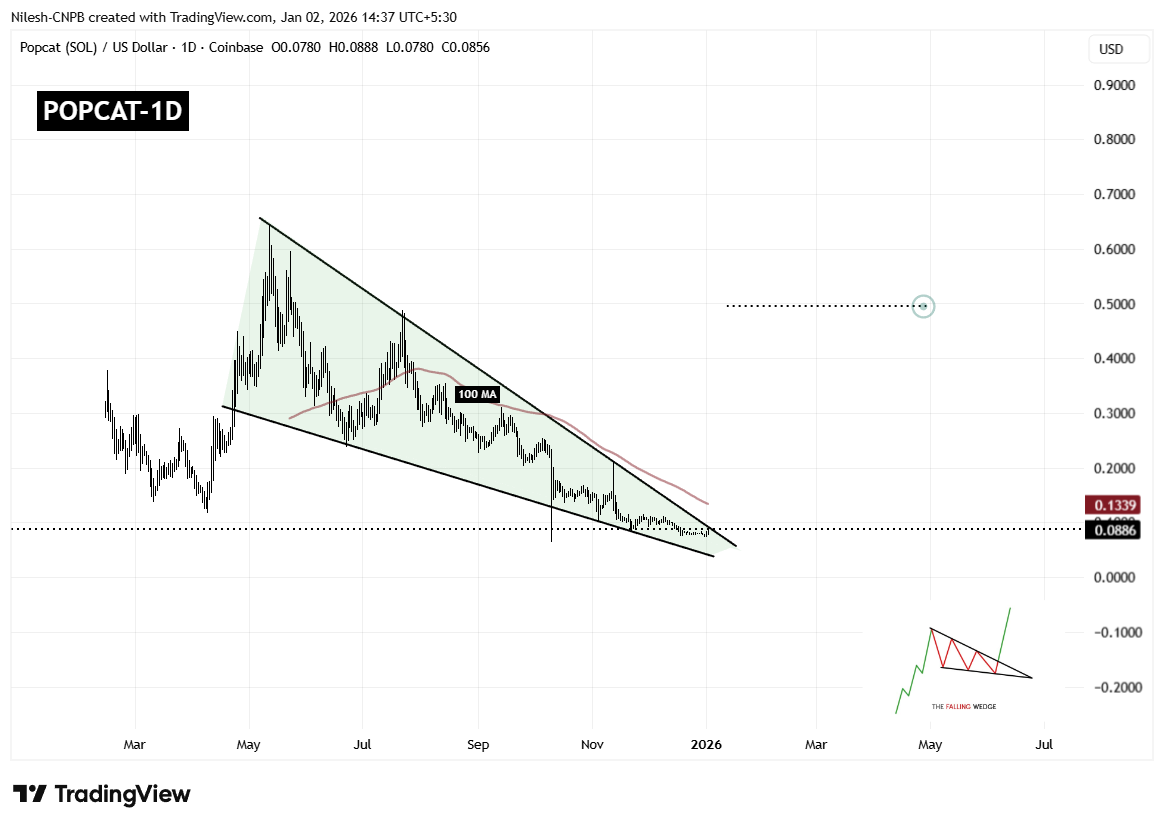
Popcat (POPCAT) Daily Chart/Coinsprobe (Source: Tradingview)
This compression near resistance is technically significant, as falling wedges tend to resolve with a sharp upside move once price breaks out of the structure. The longer price coils within the wedge, the stronger the eventual breakout tends to be.
However, overhead resistance remains notable. The 100-day moving average, currently hovering around $0.1339, represents a major technical barrier. This level has previously acted as dynamic resistance and will likely be a key area to watch if a breakout occurs.
What’s Next for POPCAT?
If buyers manage to push price decisively above the wedge resistance and reclaim the 100-day moving average with a strong daily close, POPCAT could confirm a bullish breakout. Such a move would mark a clear shift in trend structure and could open the door for a larger recovery rally.
Based on the measured move of the falling wedge pattern, the upside projection points toward the $0.49 region. Reaching this level would represent a substantial recovery from current prices and could attract renewed interest from momentum traders and sidelined participants.
That said, failure to break above resistance could result in continued consolidation. In a bearish scenario, POPCAT may revisit the $0.072 support zone once again. As long as this level continues to hold, the broader falling wedge structure would remain intact, keeping the bullish reversal thesis alive.
Overall, POPCAT is approaching a technically critical juncture. With price tightly compressed, selling pressure fading, and buyers defending key support levels, the coming sessions could prove decisive in determining whether this memecoin is ready to stage its next meaningful move higher.
Disclaimer: The views and analysis presented in this article are for informational purposes only and reflect the author’s perspective, not financial advice. Technical patterns and indicators discussed are subject to market volatility and may or may not yield the anticipated results. Investors are advised to exercise caution, conduct independent research, and make decisions aligned with their individual risk tolerance.
About Author: Nilesh Hembade is the Founder and Lead Author of Coinsprobe, with over 5 years of experience in the cryptocurrency and blockchain industry. Since launching Coinsprobe in 2023, he has been providing daily, research-driven insights through in-depth market analysis, on-chain data, and technical research.
Disclaimer: The information on this page may come from third parties and does not represent the views or opinions of Gate. The content displayed on this page is for reference only and does not constitute any financial, investment, or legal advice. Gate does not guarantee the accuracy or completeness of the information and shall not be liable for any losses arising from the use of this information. Virtual asset investments carry high risks and are subject to significant price volatility. You may lose all of your invested principal. Please fully understand the relevant risks and make prudent decisions based on your own financial situation and risk tolerance. For details, please refer to
Disclaimer.
Related Articles
PEPE Stalls After 15% February Drop — Is a Breakout Coming Soon?
PEPE is consolidating near $0.0000033 after a 15% February decline.
Resistance at $0.0000038 blocks recovery despite easing selling pressure.
Breakdown below $0.0000028 support could trigger another downside move.
PepeCoin — PEPE, traders now face a quieter market after a sharp February
CryptoNewsLand16m ago
VIA on Fire: 31.12% Surge Sparks Trader Excitement
VIA's price surged by 31.12% to $0.003697, following a 67.21% rise in 24 hours and increased trading volume. This movement reflects heightened trader interest amid broader market trends, with key support at $0.003 and resistance at $0.006.
Coinfomania1h ago
鏈上熱到爆、以太幣卻漲不動?專家揭「致命死穴」:恐下探 1,500 美元
CryptoQuant 報告指出,以太坊面臨「採用悖論」,雖然網路活躍度創新高,但幣價卻下滑。若熊市持續,到第三季末以太幣可能跌至 1,500 美元。智能合約活躍度上升與以太幣價格脫鉤,交易所流入量更能反映價格動態。投資需求疲軟,資金持續流失是主要隱憂。
区块客1h ago
Dogecoin (DOGE) phát tín hiệu khởi sắc khi dòng tiền nhà đầu tư cá nhân quay lại
Dogecoin (DOGE) is experiencing a recovery, currently up over 2% and nearing the psychological $0.1000 mark. Increased speculative activity is attracting traders to the derivatives market, and technical indicators suggest a cautious positive outlook for DOGE.
TapChiBitcoin1h ago
DePIN and AI Lead the Charge – Analyzing the Top Weekly Crypto Gainers
The cryptocurrency market serves as an indicator for new technological trends, and weekly data for the cryptocurrency market collected by CoinMarketCap show that investor sentiment has recently changed a lot. The market remains directionless overall, yet an exclusive set of projects, particularly in
BlockChainReporter1h ago
Liệu RAVE có sẵn sàng tăng 30% sau khi lấy lại được mức hỗ trợ này?
RaveDAO (RAVE) hiện đang giao dịch ở mức $0,2475 sau khi ghi nhận mức tăng ấn tượng 16,45%. Đáng chú ý, sự gia tăng mạnh mẽ trong hoạt động thị trường đã được ghi nhận, với khối lượng giao dịch tăng vọt 125%, đạt $88,15 triệu. Điều này phản ánh sự quan tâm lớn từ các nhà đầu tư và nhà giao dịch đối
TapChiBitcoin2h ago