BONK experienced a remarkable growth this week, with a price increase of approximately 46% over the past seven days—outperforming most other meme coins. However, price volatility has not fully reflected what is happening. Upon deeper analysis, it can be observed that the number of new users has surged, large wallets have been accumulating early, and the price structure still has room to continue upward. Nevertheless, the upward momentum may temporarily pause before continuing.
The key point is not the continuous daily price increase, but whether buying pressure can sustain after the initial breakout.
BONK User Activity Surges Alongside Price
An important indicator is the number of active addresses. This metric shows the number of unique wallets conducting BONK transactions each day. When this number increases, it usually indicates that more people are actively using or holding the token, rather than just engaging in short-term trading.
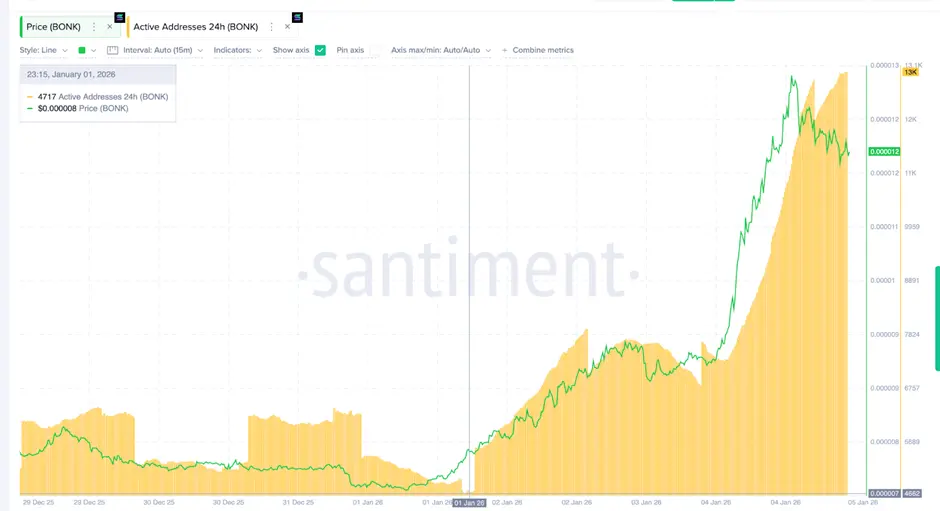 Active Addresses | Source: SantimentIn early January, BONK recorded around 4,700 active addresses. By January 5th, this number nearly tripled to nearly 13,000 addresses. This is an impressive growth in a short period.
The significance of this lies in the fact that many meme coin price rallies often fail when they only attract short-term traders. When wallet activity increases significantly like now, it indicates genuine and broader interest. Even if BONK’s price temporarily stalls, the increase in activity still supports a positive trend.
As of now, BONK’s usage has grown in tandem with its price, indicating a solid foundation for an upward trend.
Large Wallets Early Accumulation, Then Pausing
Another factor to observe is the behavior of “whales”—wallets holding large amounts of tokens. For BONK, this group includes wallets holding from 100 million BONK to 1 billion BONK.
Since December 31st, the total BONK held by these wallets increased from approximately 2.7227 trillion BONK to 2.7321 trillion BONK, adding about 9.41 billion BONK during the initial phase of the rally.
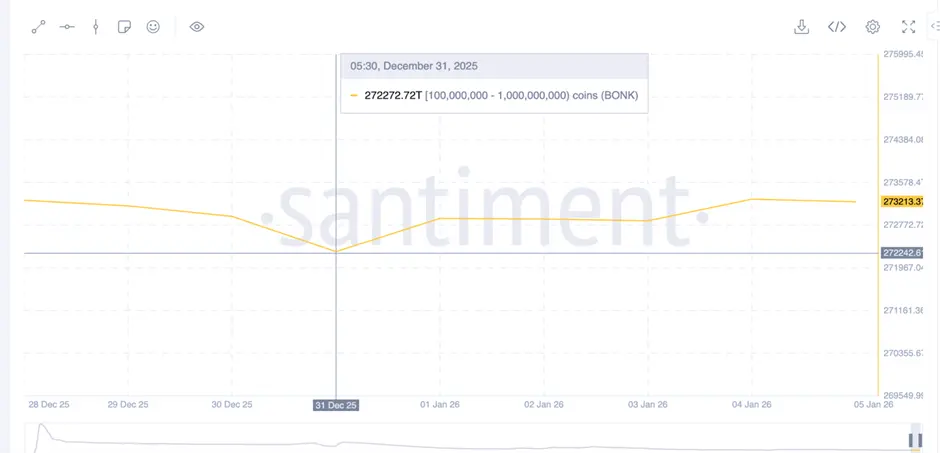 BONK Whales | Source: SantimentAfterward, the holdings of large wallets remained almost unchanged. This does not mean they sold, but simply that they stopped buying at higher prices.
This is a common strategy among large investors: buy early when prices are low, then observe as the market heats up. They often wait for stability before making their next move.
Currently, there are no clear signs of these large wallets divesting. They continue to hold the BONK they accumulated earlier.
BONK Price Structure Still Shows Growth Potential
The BONK price chart shows a strong rally followed by sideways movement, reflecting a pause among buyers after a breakout.
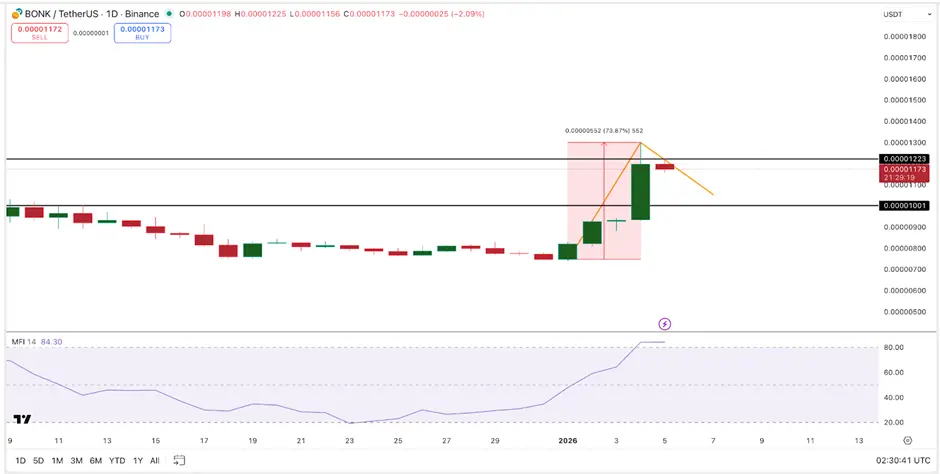 BONK Price Action | Source: TradingView As long as BONK stays above the $0.000010 level, this price structure remains intact. If the price breaks above $0.000012, it would signal that buying pressure continues to dominate. Conversely, if the price drops below $0.000010, the upward trend could reverse.
In terms of potential, the previous rally allows for an estimated growth of up to approximately 74%, if BONK continues its upward trend in the near future.
However, the (MFI) money flow index also indicates a possible correction. This index has entered overbought territory and has been sideways recently, signaling expectations of a price correction that could attract more buying interest at lower levels.
Some meme coin market analysts also point out an important confirmation threshold: if BONK surpasses $0.00001687, the next bullish trend could be triggered. Before reaching this level, minor corrections or sideways oscillations are considered normal.
For short-term support, the $0.00001069 zone is crucial and aligns with the TCR price chart. If BONK approaches this zone without dropping further, it is still viewed as a positive development after a strong rally.
Disclaimer: The information on this page may come from third parties and does not represent the views or opinions of Gate. The content displayed on this page is for reference only and does not constitute any financial, investment, or legal advice. Gate does not guarantee the accuracy or completeness of the information and shall not be liable for any losses arising from the use of this information. Virtual asset investments carry high risks and are subject to significant price volatility. You may lose all of your invested principal. Please fully understand the relevant risks and make prudent decisions based on your own financial situation and risk tolerance. For details, please refer to
Disclaimer.
Related Articles
PEPE Consolidates Above $0.05324 Support as Momentum Strengthens and Resistance Near $0.05336 Holds
PEPE has a tight intraday price compression with a support level of $0.053243 and resistance level of $0.053363.
A RSI of 64.13 represents the moderate bullish momentum whereas MACD history is slightly positive, which indicates the gradual buying momentum.
The price is at $0.053364
CryptoNewsLand43m ago
HYPE Hits $35.53 After 2.4% Jump — Will Momentum Hold as Price Tests $35.59 Resistance?
Hyperliquid’s HYPE trades at $35.53, approaching the $35.59 resistance after a 2.4% daily gain.
The chart shows the $33.67 zone acting as support after price moved above a previously contested level.
Price now trades between $33.67 support and $35.59 resistance, shaping the immediate
CryptoNewsLand48m ago
Cardano áp sát mốc 0,28 USD khi lực mua nhỏ lẻ tăng mạnh – Đà bứt phá đã cận kề?
The current price of Cardano (ADA) is around $0.270, having risen from a support level of $0.254-$0.260. It underwent a dip to $0.2194 before buyers returned, leading to a structure indicating accumulation. The price tests resistance at $0.287, while whale activity raises market uncertainty. Despite a reduction in ADA holdings among large wallets, the supply remains concentrated in their hands, suggesting strategic liquidity reallocation rather than widespread selling. Meanwhile, retail investors continue accumulating ADA.
TapChiBitcoin3h ago
Bitcoin MVRV Z-Score Drops Below 1 Again
The MVRV Z-Score is a key on-chain indicator for assessing Bitcoin's value by comparing market and realized capitalizations. Historical data shows that when the score drops below 1, it often signals significant market recovery. However, changing market dynamics and institutional influences may alter future patterns.
Coinfomania3h ago
「刻舟求劍」式幣價預測走紅,玄學預言的實戰邏輯與缺陷
作者:Frank,PANews
每當市場進入不上不下的迷惘階段,就會有人試圖用「刻舟求劍」式的歷史回溯方法去預測下一段走勢。在這種情況下,人們往往能從這些理論和圖表中看到歷史總是在重演,並似乎自動將未來一段時間的行情走勢與過去的某一段進行重疊驗證。
這種重合似乎有著神奇的效果,也常常被驗證。有部落客自稱這種預測的準確率能到達 75%~80% 。
這種在社群媒體上屢屢爆紅的「刻舟求劍」式價格預測,究竟是在幫助市場識別階段,還是在把噪音包裝成預言?
從「滴答分形」到「歷史押韻」
關於 2025 年 10 月市場頂點預測的巔峰操作是名為 CryptoBullet 的分析師,他所創建的一種名為「ti
区块客4h ago
Dogecoin (DOGE) Prints Abnormal $0 as Short Sellers Disappear - U.Today
Dogecoin's recent rally saw $0 in short liquidations, indicating traders were betting long. Despite a 4.61% decline due to market pullback, volume remained high. The potential for DOGE to reach $0.10 depends on Bitcoin's recovery.
UToday4h ago