
**Date: **Fri, Jan 02, 2026 | 06:40 PM GMT
The broader cryptocurrency market has started the new year with modest strength, as both Bitcoin (BTC) and Ethereum (ETH) trade in the green with gains of over 2%. While several altcoins are regaining momentum, the privacy-focused token Monero (XMR) has remained relatively flat in comparison.
XMR is trading with mild gains, but more importantly, its daily chart structure suggests the recent pullback may be a healthy bullish retest rather than a sign of trend exhaustion.
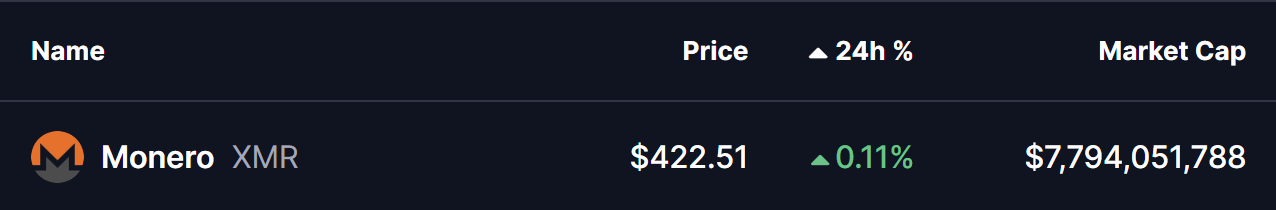
Source: Coinmarketcap
Retesting the Cup and Handle Breakout
On the daily timeframe, XMR had been consolidating within a well-defined Cup and Handle pattern — a classic bullish continuation formation that often precedes strong upside moves once the neckline is cleared.
Earlier, bulls decisively broke above the $412–$420 neckline resistance, triggering a sharp rally of nearly 20% from the breakout base to a local high around $498.30. This move confirmed the pattern’s validity and signaled a clear shift in market structure toward the upside.
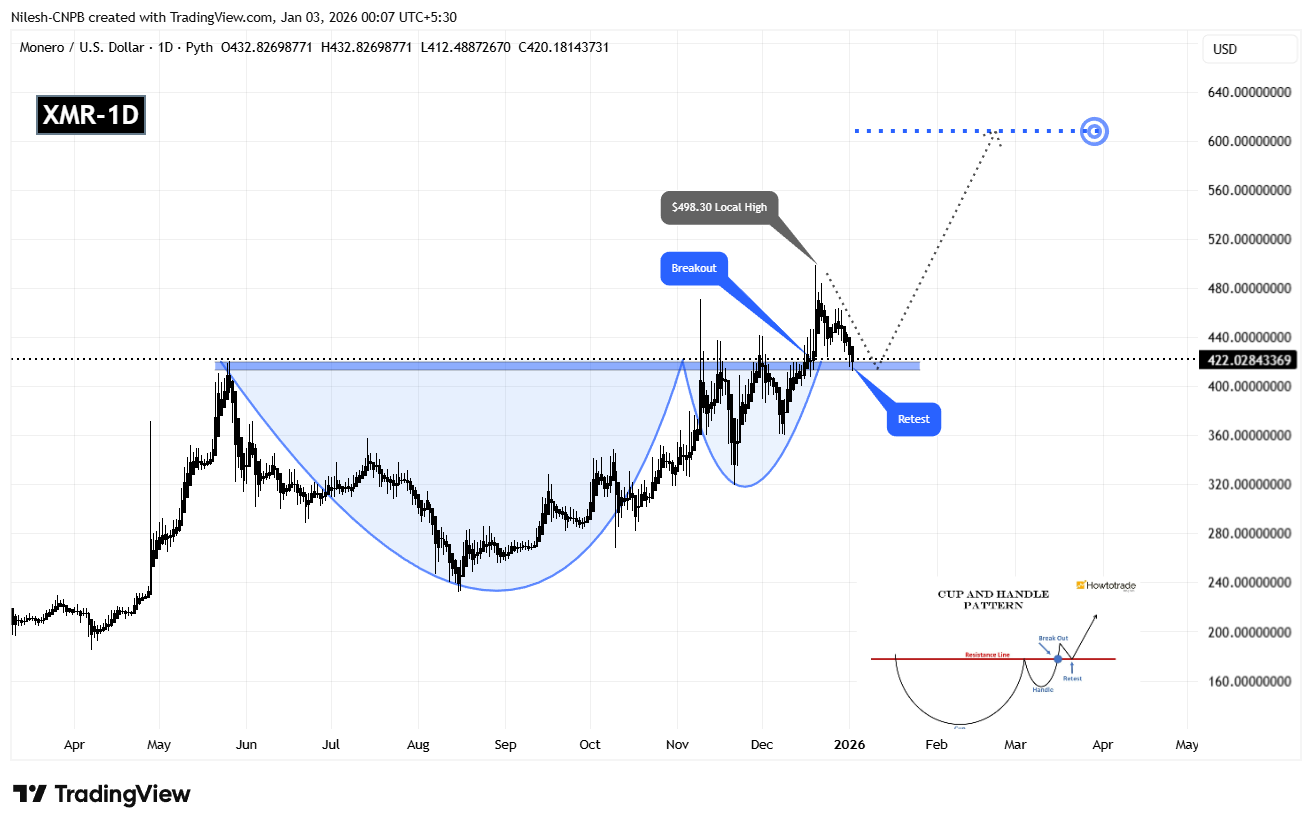
Monero (XMR) Daily Chart/Coinsprobe (Source: Tradingview)
Following that initial breakout surge, XMR entered a natural cooldown phase. The recent dip has brought price back toward the $412–$420 zone, where buyers have stepped in once again. This area now acts as a textbook resistance-turned-support level. Such retests are common after strong breakouts and often serve as a launchpad for the next impulsive move if demand holds firm.
What’s Next for XMR?
As long as buyers continue to defend the $412–$420 neckline zone, the broader bullish structure remains intact. A sustained push back above the recent swing high near $498 would likely signal renewed momentum and confirm continuation of the breakout.
Based on the depth of the cup formation, the technical upside projection points toward the $608 region. This would represent a potential upside of roughly 43% from current levels if momentum accelerates.
On the downside, a failure to hold the $412–$420 support range could temporarily weaken bullish momentum and delay the continuation scenario. However, the larger structure would still remain constructive as long as price stays well above the cup’s base.
For now, XMR appears to be in a crucial confirmation phase. How price reacts around this key support zone in the coming sessions will likely determine whether Monero transitions into a full-scale continuation rally or spends more time consolidating before its next move.
Disclaimer: The views and analysis presented in this article are for informational purposes only and reflect the author’s perspective, not financial advice. Technical patterns and indicators discussed are subject to market volatility and may or may not yield the anticipated results. Investors are advised to exercise caution, conduct independent research, and make decisions aligned with their individual risk tolerance.
About Author: Nilesh Hembade is the Founder and Lead Author of Coinsprobe, with over 5 years of experience in the cryptocurrency and blockchain industry. Since launching Coinsprobe in 2023, he has been providing daily, research-driven insights through in-depth market analysis, on-chain data, and technical research.
Disclaimer: The information on this page may come from third parties and does not represent the views or opinions of Gate. The content displayed on this page is for reference only and does not constitute any financial, investment, or legal advice. Gate does not guarantee the accuracy or completeness of the information and shall not be liable for any losses arising from the use of this information. Virtual asset investments carry high risks and are subject to significant price volatility. You may lose all of your invested principal. Please fully understand the relevant risks and make prudent decisions based on your own financial situation and risk tolerance. For details, please refer to
Disclaimer.
Related Articles
Today, the cryptocurrency Fear and Greed Index is at 12, indicating the market is in extreme fear.
Gate News Report, March 8th, according to Alternative.me data, today’s cryptocurrency Fear and Greed Index is at 12, indicating the market is in a "Extreme Fear" state. This index measures market sentiment, with lower values indicating higher levels of fear.
GateNews15m ago
CryptoQuant Analyst: Bitcoin NUPL-MVRV indicator reaches 0.33, indicating that extreme selling conditions are moderating
Gate News Announcement, March 8 — CryptoQuant analyst Axel posted on X platform that Bitcoin may have entered the mid-stage of this bear market cycle. Data shows that the NUPL–MVRV harmonic composite indicator has reached 0.33, while historical cycle bottoms typically occur around the -0.5 level. The chart indicates that the start of the bear market cycle is trending upward, suggesting that extreme selling conditions are moderating. However, the indicator remains well above historical bottom levels, indicating that a full-scale market sell-off has not yet been confirmed.
GateNews54m ago
Polkadot to Reset Tokenomics on March 12 With Major DOT Supply and Staking Changes
Polkadot will introduce a new monetary framework on March 12 that sets DOT’s supply cap at 2.1 billion and lowers emissions by 53.6%.
The overhaul will also create a Dynamic Allocation Pool and shorten the DOT unbonding period from 28 days to 24–48 hours.
On March 12, Polkadot will reset
CryptoNewsFlash4h ago
Bitcoin May Be Closer to a Bottom Than Most Think, Chart Signals
The Bitcoin price slipped about 2% today, trading slightly below $68,000 after pushing above $73,000 earlier this week, as already covered on our site. The move added fresh pressure to a market that still feels shaky, especially after several failed attempts to hold higher levels.
Still, not e
CaptainAltcoin5h ago
Dogecoin Monthly Breakdown Pattern Reappears as Price Tests $0.0918
Dogecoin is currently trading at $0.09205 at a gain of 2.3, with support of above $0.08878.
As can be seen in the monthly chart, there are recurring breakdown areas that have been followed by significant expansions in price.
The short-term trading range is narrow and the immediate point o
CryptoNewsLand5h ago
Solana Eyes $90.6 Trigger Point as $83 Support Holds and Liquidation Pressure Builds
A large cluster of short positions faces liquidation if SOL reaches $90.6, potentially increasing volatility.
SOL trades between $83.00 support and $89.58 resistance, keeping price action compressed in the short term.
SOL posts a 0.8% daily gain and rises 0.7% against BTC, holding
CryptoNewsLand5h ago