
**Date: **Tue, Jan 06, 2026 | 06:20 AM GMT
The broader cryptocurrency market continues to show fresh strength as 2026 unfolds. Bitcoin (BTC) and Ethereum (ETH) are both up more than 7% on the week, helping improve overall market sentiment. This renewed momentum is gradually spreading across major altcoins — including Pi Network (PI).
While PI has recorded a modest 5% gain over the past week, the more important development is taking shape on the chart. On lower timeframes, price action is compressing into a well-defined bullish structure, suggesting the token may be preparing for a meaningful breakout if resistance is reclaimed.
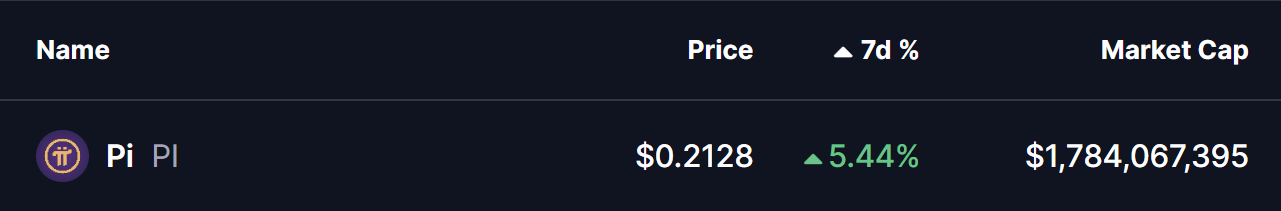
Source: Coinmarketcap
Ascending Triangle Taking Shape
On the 4-hour chart, Pi Network is forming a clear ascending triangle pattern. This structure is defined by a series of higher lows pressing steadily into a flat resistance zone, signaling persistent buying interest despite repeated rejections at the same level. Ascending triangles are widely considered bullish continuation patterns, particularly when they develop after an extended consolidation phase.
PI recently bounced cleanly from its rising support trendline, once again pushing price toward the upper boundary of the triangle around the $0.2129–$0.2160 region. The ability to repeatedly defend higher lows suggests that buyers remain in control and are willing to accumulate on dips rather than exit positions.
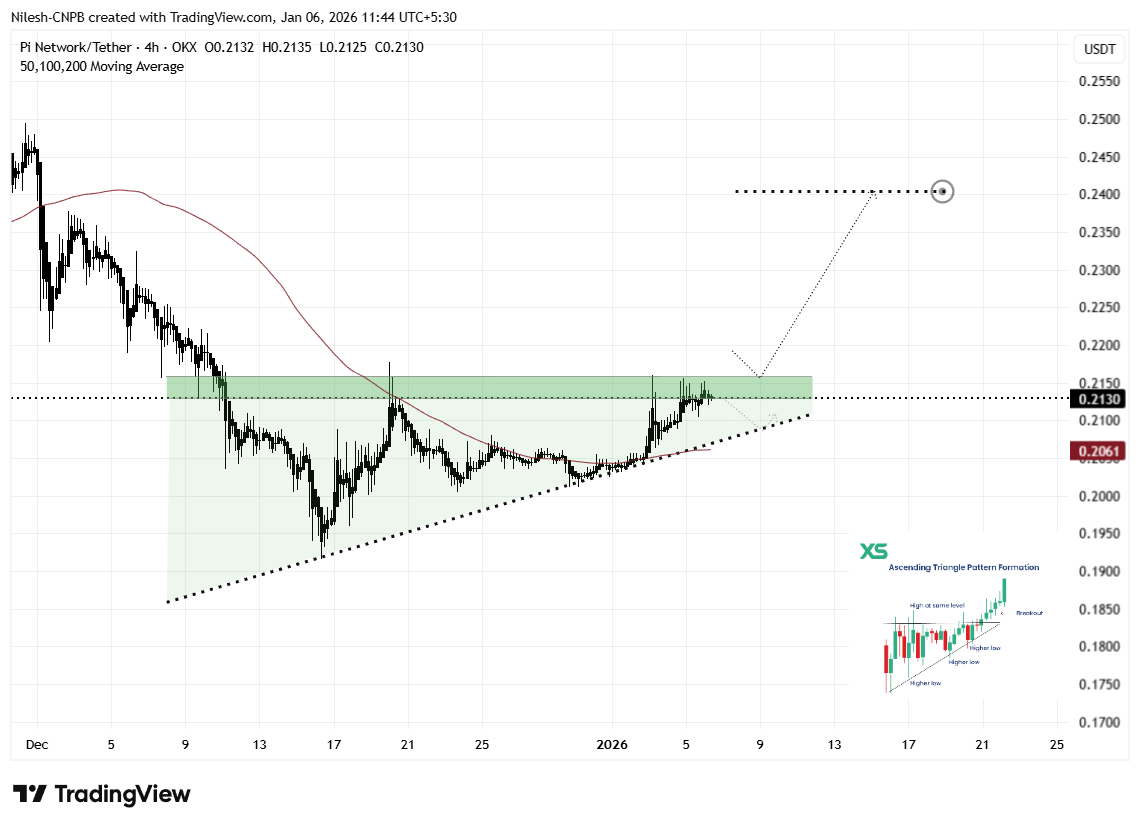
_ Pi Network (PI) 4H Chart/Coinsprobe (Source: Tradingview)_
Rather than signaling weakness, this sideways-to-higher price action reflects healthy consolidation. Volatility continues to compress, which often precedes a larger directional move as the market approaches a decision point.
What’s Next for PI?
From here, PI appears set for another test of the $0.2160 resistance zone. A decisive breakout above this level, followed by sustained acceptance and a successful retest as support, would confirm the ascending triangle structure and likely trigger a stronger bullish expansion.
Based on the measured move of the pattern, the technical upside projection points toward the $0.2404 area. This represents a potential upside of roughly 13% from current levels and also aligns with previous price structure, reinforcing the bullish case.
That said, caution remains important. If PI fails to break above resistance, price could rotate back toward the rising support trendline once again. As long as this ascending support holds, the broader bullish structure remains intact. A clear breakdown below the trendline, however, would invalidate the pattern and delay any breakout scenario.
For now, the combination of improving market sentiment and a tightening ascending triangle suggests Pi Network is approaching a critical inflection point — one that could define its next major move as the new year progresses.
Disclaimer: The views and analysis presented in this article are for informational purposes only and reflect the author’s perspective, not financial advice. Technical patterns and indicators discussed are subject to market volatility and may or may not yield the anticipated results. Investors are advised to exercise caution, conduct independent research, and make decisions aligned with their individual risk tolerance.
About Author: Nilesh Hembade is the Founder and Lead Author of Coinsprobe, with over 5 years of experience in the cryptocurrency and blockchain industry. Since launching Coinsprobe in 2023, he has been providing daily, research-driven insights through in-depth market analysis, on-chain data, and technical research.
Disclaimer: The information on this page may come from third parties and does not represent the views or opinions of Gate. The content displayed on this page is for reference only and does not constitute any financial, investment, or legal advice. Gate does not guarantee the accuracy or completeness of the information and shall not be liable for any losses arising from the use of this information. Virtual asset investments carry high risks and are subject to significant price volatility. You may lose all of your invested principal. Please fully understand the relevant risks and make prudent decisions based on your own financial situation and risk tolerance. For details, please refer to
Disclaimer.
Related Articles
Today’s Crypto Fear and Greed Index has fallen to 9, and the market is in extreme fear.
Gate News message, April 3, Alternative.me data shows that today’s Crypto Fear and Greed Index fell to 9, and the market is in an “extreme fear” state. Yesterday, the index was 12, also in an “extreme fear” state.
GateNews5m ago
Retail Investors Abandoned XRP but Ripple Whales Have Stepped Up: Analyst
A very “ideal situation” for XRP has developed over the past few months, claimed a popular market observer, indicating that large whales have become the dominant buying force behind the asset.
Their comments come as the price of Ripple’s cross-border token has struggled over the past seven days, po
CryptoPotato45m ago
The Good and Bad News for Ethereum (ETH) After Dumping Below $2K
ETH joined the market-wide correction over the past few days, dropping from $2,200 to a three-week low of $1,970 before it recovered slightly to the current $2,000.
This is the asset’s most crucial level for the time being, and it’s close to breaking below it. As such, analysts have rushed to
CryptoPotato2h ago
Bittensor (TAO) Rises 10% Daily as Bulls Eye Further Breakout
The cryptocurrency market registered a slight rebound over the past 24 hours, with Bittensor (TAO) being the best performer (at least among the top 100 club) today.
Market experts expect the bullish momentum to continue, projecting more substantial gains in the near future.
TAO Jumps
CryptoPotato2h ago
MemeCore (M) Flips Shiba Inu (SHIB) After Exploding by 50% in 2 Weeks: What Comes Next?
The crypto market has a new rock star, and its name is the Solana-based meme coin MemeCore (M).
Its price has jumped by double digits in a matter of weeks, thus outperforming multiple leading cryptocurrencies like Bitcoin (BTC), Ethereum (ETH), and many more, which have been struggling during the o
CryptoPotato2h ago
Solana Price Holds Near $80 as Analysts Split on Next Move
Key Insights:
Solana trades near $80 under pressure, with persistent lower highs and weak recovery attempts reinforcing a clear short-term bearish market structure.
Analysts identify the $75 to $45 range as a key accumulation zone, supported by historical demand levels and long-term
CryptoNewsLand5h ago
