
**Date: **Tue, Jan 06, 2026 | 10:08 AM GMT
The broader cryptocurrency market continues to show fresh strength at the start of the new year. Both Bitcoin (BTC) and Ethereum (ETH) are posting weekly gains of over 6%, helping restore confidence across the market. This improving sentiment is now spilling over into major altcoins — including Jupiter (JUP).
JUP has already delivered an impressive 20% gain on the week. While the short-term momentum is encouraging, the more important development is unfolding on the higher-timeframe chart. Recent price action suggests a meaningful shift in market behavior, hinting that JUP could be transitioning from a corrective phase into a broader bullish continuation if key resistance zones are reclaimed.
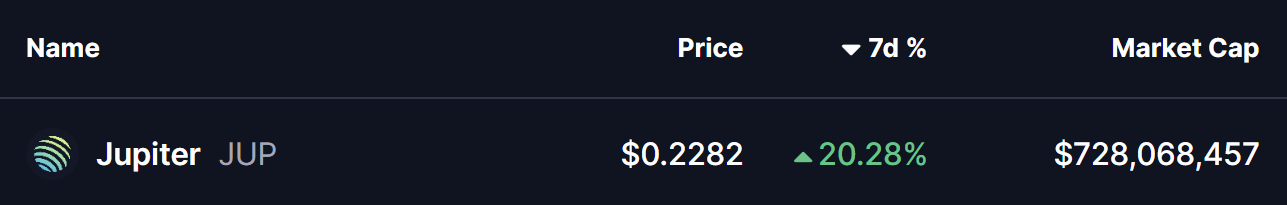
Source: Coinmarketcap
Rounding Bottom Formation Taking Shape
On the daily chart, Jupiter appears to be forming a rounding bottom pattern — a classic bullish reversal structure that typically develops after extended downside pressure and gradual seller exhaustion.
This setup began after JUP faced a strong rejection from the $0.4540–$0.4760 resistance zone in late October. That rejection triggered a sharp sell-off, dragging price lower toward the $0.17 region. However, bears failed to maintain control beyond that point. Selling pressure faded, demand began to absorb supply, and price started stabilizing.
Over time, volatility compressed and JUP began curling higher in a smooth, rounded fashion — closely matching the textbook behavior of a developing rounding bottom. Importantly, the recent recovery has pushed price back above the 50-day moving average around $0.2192, a level that previously capped upside attempts and now appears to be turning into support.
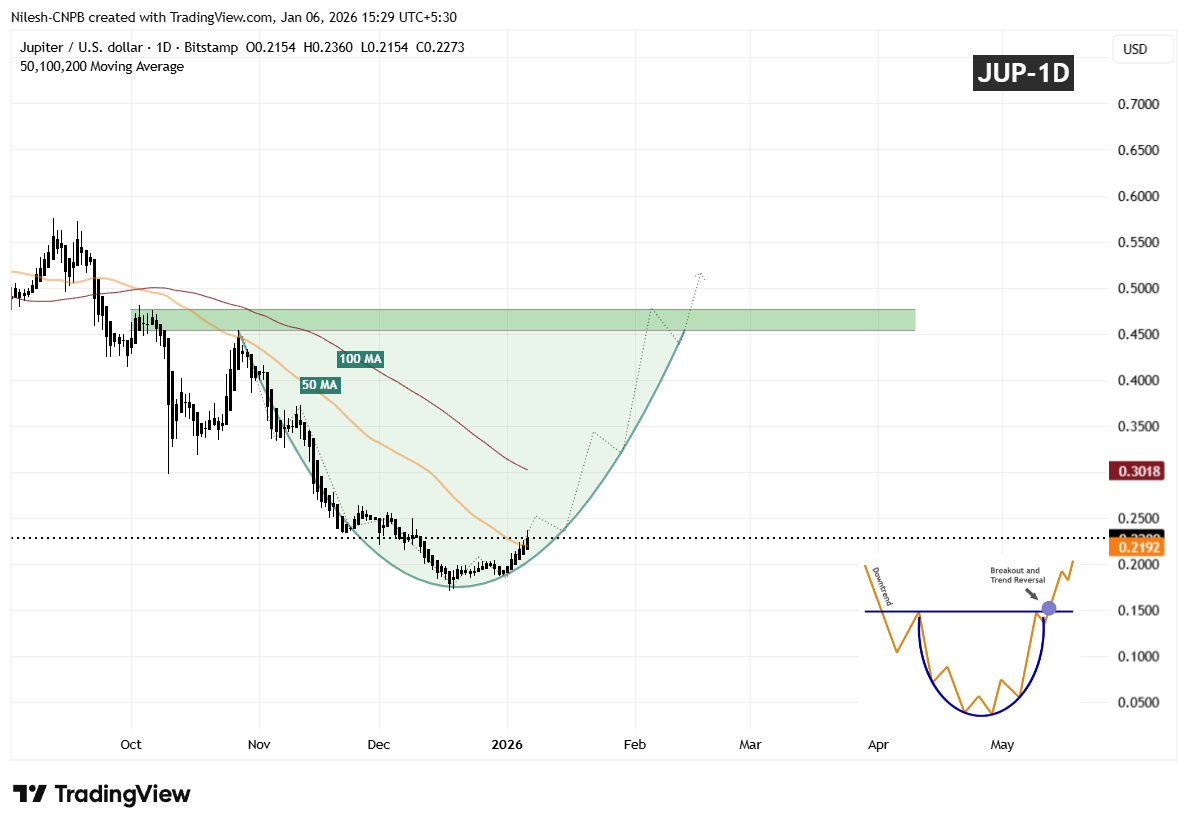
Jupiter (JUP) Daily Chart/Coinsprobe (Source: Tradingview)
The gradual slope of the recovery suggests organic accumulation rather than speculative spikes, reinforcing the credibility of the developing base.
What’s Next for JUP?
If JUP continues to hold above the 50-day moving average, this level could serve as a solid foundation for further upside, with the 100-day moving average acting as the next upside magnet in the near term.
A clean and decisive breakout above the $0.4540–$0.4760 resistance zone, followed by sustained acceptance above that area, would confirm the rounding bottom reversal and likely open the door for a broader bullish expansion phase.
Until that breakout occurs, the pattern remains in development. Some short-term consolidation or shallow pullbacks are possible as price digests recent gains. However, as long as JUP continues to print higher lows above the established base, the broader structure remains constructive.
For now, the chart suggests Jupiter is approaching a critical confirmation phase — one that could determine whether this recovery matures into a sustained bullish trend as 2026 progresses.
Disclaimer: The views and analysis presented in this article are for informational purposes only and reflect the author’s perspective, not financial advice. Technical patterns and indicators discussed are subject to market volatility and may or may not yield the anticipated results. Investors are advised to exercise caution, conduct independent research, and make decisions aligned with their individual risk tolerance.
About Author: Nilesh Hembade is the Founder and Lead Author of Coinsprobe, with over 5 years of experience in the cryptocurrency and blockchain industry. Since launching Coinsprobe in 2023, he has been providing daily, research-driven insights through in-depth market analysis, on-chain data, and technical research.
Disclaimer: The information on this page may come from third parties and does not represent the views or opinions of Gate. The content displayed on this page is for reference only and does not constitute any financial, investment, or legal advice. Gate does not guarantee the accuracy or completeness of the information and shall not be liable for any losses arising from the use of this information. Virtual asset investments carry high risks and are subject to significant price volatility. You may lose all of your invested principal. Please fully understand the relevant risks and make prudent decisions based on your own financial situation and risk tolerance. For details, please refer to
Disclaimer.
Related Articles
BTC is trading in a tight range around $67,000, and SOL futures open interest hits a new two-month high
On April 3, the crypto market continued to trade in choppy conditions. Bitcoin was consolidating around $67,000, maintaining its broader downward trend that began last October. The futures market saw thin trading, with Solana futures open interest hitting a new high, and the volatility index falling to its lowest level since February. Market structure indicates that short positions are increasing.
GateNews35m ago
Crypto consolidates as volatility cools and futures markets tilt bearish
The crypto market continued to exhibit signs of choppiness on Friday, with bitcoin BTC$66,729.05 trading at $67,000 in the middle of a trading range that spans back to early February.
A selection of altcoins picked up during the lower liquidity Asia hours, prompting the likes of ALGO and RENDER to
CoinDesk39m ago
Reputed Crypto Trader Calls the Bottom at $54,000 BTC Price, Bullish Expectations Grow
Reputed crypto trader calls the bottom at $54,000 BTC price.
This led to a massive surge in price pump expectations.
The price of BTC could rally towards new ATH prices after the bottom is set.
The price of Bitcoin (BTC) continues to trade in the $66,000 price range, hinting at
CryptoNewsLand1h ago
Bitcoin price repeats a downward pattern as the third wave begins; BTC’s key support at $65,636 is being tested
Bitcoin’s price is trading in a tight range around $67,044, moving within a downtrend channel. The third wave of decline has already retraced by about 5%. Technical indicators show that price momentum is weakening, and short-term holders face losses. Key support levels are $65,750 and $64,920; if those levels break, the price could test as low as $57,883. Investors should monitor market conditions and manage risk cautiously.
GateNews1h ago
Can Ethereum’s “Megawhale” betting $2.6 billion stop a pullback? ETH could face a 43% downside risk
The Ethereum price is trading in a range near $2,055, facing the risk of a technical pullback. Although a whale has increased its holdings, price momentum is weakening. Investors should watch the key support level at $2,024 and potential market pressure, which could lead to further downside. Investors should carefully evaluate the potential impact.
GateNews2h ago
Algorand price surges 23%, triggering a crypto market frenzy as Google's AI whitepaper integrates with Revolut
Algorand (ALGO) price surged 23% within 24 hours, mainly driven by Google’s quantum AI whitepaper, with Algorand cited multiple times. The 24-hour trading volume jumped 429%, drawing institutional investors’ attention. The ALGO price rebounded to $0.1052, still below its all-time high, so the market needs to closely watch the subsequent trend.
GateNews2h ago
