
**Date: **Wed, Jan 07, 2026 | 06:20 AM GMT
The broader cryptocurrency market continues to show strong New Year momentum, with Bitcoin (BTC) up around 4% and Ethereum (ETH) gaining over 9% on a weekly basis. This improving sentiment is gradually spilling over into major altcoins — including the DePIN-focused token Akash Network (AKT).
AKT has already posted an impressive 20% weekly gain. While this short-term strength has caught traders’ attention, the more important development is unfolding on the higher-timeframe chart. Recent price action suggests a meaningful shift in market structure, hinting that AKT may be transitioning out of a prolonged corrective phase and into the early stages of a bullish continuation.
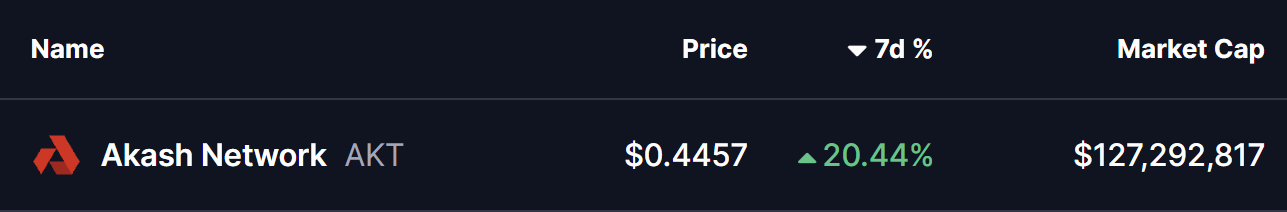
Source: Coinmarketcap
Falling Wedge and Rounding Bottom in Play
On the daily chart, AKT has been trading within a broader falling wedge — a structure that often precedes bullish reversals as selling pressure gradually weakens. Within this larger wedge, price action is also shaping a developing rounding bottom pattern, reflecting steady accumulation and seller exhaustion.
The formation began after AKT faced strong rejection near the $0.5441 resistance zone in late November. That rejection triggered a sharp sell-off, pushing price lower toward the $0.3465 region. However, bears failed to extend losses beyond this area. Instead, demand stepped in, downside momentum slowed, and price began to stabilize.
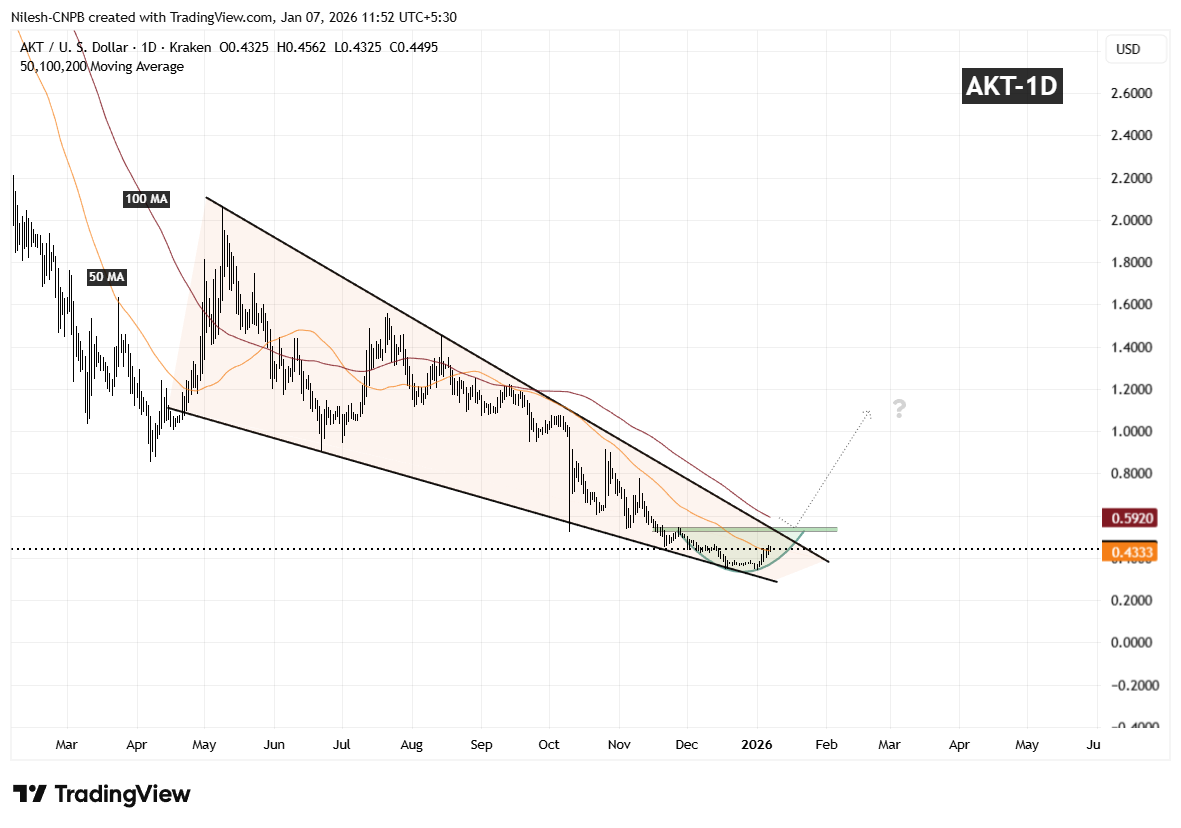
Akash Network (AKT) Daily Chart/Coinsprobe (Source: Tradingview)
Over the following weeks, volatility compressed and AKT started to curl higher in a smooth, rounded fashion — closely matching the textbook behavior of a rounding bottom. Importantly, the recent rebound has pushed price back above the 50-day moving average around $0.4333, a level that had previously acted as resistance and is now beginning to flip into support.
What’s Next for AKT?
If AKT can continue to hold above the 50-day moving average, this area may act as a solid base for further upside attempts. From here, attention shifts toward the descending resistance trendline of the falling wedge, which aligns closely with the $0.5441 resistance zone.
A clean and decisive breakout above this confluence area, followed by sustained acceptance, would confirm a broader bullish expansion phase and mark a clear trend reversal from the prior downtrend. Such a move would likely attract renewed momentum participation as the market recognizes the structural shift.
Until that breakout occurs, the pattern remains in development. Short-term consolidation or shallow pullbacks are still possible as price digests recent gains. However, as long as AKT continues to print higher lows above the established base, the broader technical structure remains constructive.
Overall, the chart suggests AKT is approaching a critical inflection point — one that could determine whether this recovery evolves into a sustained bullish trend as 2026 progresses.
Disclaimer: The views and analysis presented in this article are for informational purposes only and reflect the author’s perspective, not financial advice. Technical patterns and indicators discussed are subject to market volatility and may or may not yield the anticipated results. Investors are advised to exercise caution, conduct independent research, and make decisions aligned with their individual risk tolerance.
About Author: Nilesh Hembade is the Founder and Lead Author of Coinsprobe, with over 5 years of experience in the cryptocurrency and blockchain industry. Since launching Coinsprobe in 2023, he has been providing daily, research-driven insights through in-depth market analysis, on-chain data, and technical research.
Disclaimer: The information on this page may come from third parties and does not represent the views or opinions of Gate. The content displayed on this page is for reference only and does not constitute any financial, investment, or legal advice. Gate does not guarantee the accuracy or completeness of the information and shall not be liable for any losses arising from the use of this information. Virtual asset investments carry high risks and are subject to significant price volatility. You may lose all of your invested principal. Please fully understand the relevant risks and make prudent decisions based on your own financial situation and risk tolerance. For details, please refer to
Disclaimer.
Related Articles
ETH 15-minute rally up 0.72%: technical rebound signals and derivatives positions in sync drive the market up
From 2026-04-02 00:30 to 2026-04-02 00:45 (UTC), the ETH 15-minute candlestick shows a gain of +0.72%. The price range is 2137.74 to 2157.47 USDT, with a swing of 0.92%. The volatility is moderate, but as market attention to this unusual move increases, the interest in related market conditions and risk discussions also rises.
The main driver of this unusual move is the convergence of multiple technical rebound signals and derivatives positioning at high levels. A long-legged doji on the monthly chart has formed, creating expectations of a trend reversal. On the daily chart, the RSI is already at 42, having dropped into the oversold zone. 4
GateNews9m ago
Today’s Crypto Fear and Greed Index has risen to 12, and the market is in extreme fear.
Gate News message, April 2, according to Alternative.me data, today the Crypto Fear and Greed Index rose to 12 (the index was 8 yesterday), and the market is in an "extreme fear" state.
GateNews14m ago
Here’s the Shiba Inu (SHIB) Price if Burn Rate Collapse Triggers a Supply Shock
Shiba Inu is experiencing dual narratives: it's now recognized as a digital commodity, yet faces pressure from a high exchange influx and a drastic 98% drop in burn rate. While the price remains steady at $0.00000609, future movements depend on increased burn activity and market demand.
CaptainAltcoin2h ago
Markets Down 25%, Sentiment Up 80%: 5 Macro Catalysts—From Trade Easing to Fed Printing that Could Ignite the Next Explosive Surge.
Market sentiment is rising despite a 25% decline, signaling early accumulation behavior.
Macro factors like easing policy and weaker dollar support altcoin recovery potential.
Infrastructure and narrative-driven tokens may lead the next market phase.
The crypto market has plunged into a
CryptoNewsLand3h ago
Solana Price Holds Near $80 as Analysts Split on Next Move
Key Insights:
Solana trades near $80 under pressure, with persistent lower highs and weak recovery attempts reinforcing a clear short-term bearish market structure.
Analysts identify the $75 to $45 range as a key accumulation zone, supported by historical demand levels and long-term
CryptoNewsLand5h ago
ADA Price Weakens Under Resistance While Large Wallets Accumulate
Key Insights:
Cardano trades below all major moving averages, reinforcing bearish pressure while price struggles to reclaim even short-term resistance levels across multiple timeframes.
Whale wallets holding large ADA balances have steadily accumulated since February, reaching their
CryptoNewsLand5h ago
