
**Date: **Sat, Jan 03, 2026 | 01:26 PM GMT
As 2026 kicks off, the broader cryptocurrency market is showing renewed stability. Ethereum (ETH) has reclaimed the $3,100 level, and several major altcoins are already beginning to pick up momentum. Against this improving backdrop, Kaspa (KAS) is quietly positioning itself as a potential late mover, with its chart structure starting to flash early bullish signals.
While KAS is trading slightly in the red today and remains mostly flat on the weekly timeframe, the more important story is unfolding beneath the surface. Recent price action suggests a meaningful structural shift may be underway — one that could mark the early stages of a bullish continuation if confirmed.
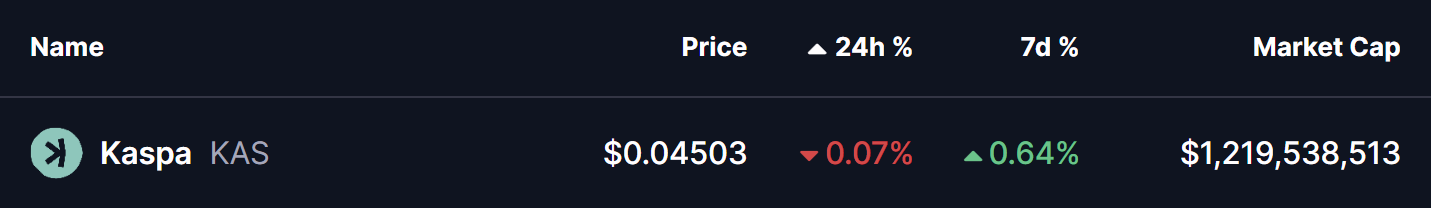
Source: Coinmarketcap
Rounding Bottom in Play
On the 4-hour timeframe, Kaspa appears to be forming a rounding bottom pattern, a classic bullish reversal structure that typically develops after a prolonged corrective phase. This pattern reflects a slow but steady transition from distribution to accumulation, as selling pressure weakens and buyers gradually regain control.
The setup began after KAS faced strong rejection near the $0.06310 neckline zone, which triggered a sharp decline through late November and December. That downside move eventually found strong demand near the $0.040 level, which has since acted as a key support area. Multiple defenses of this zone prevented further downside and helped establish a stable base for a potential trend reversal.
Since carving out that bottom, KAS has started to curve higher in a smooth, rounded fashion — closely matching the textbook structure of a developing rounding bottom. The recent stabilization above the $0.045 region further supports the idea that downside momentum is fading.
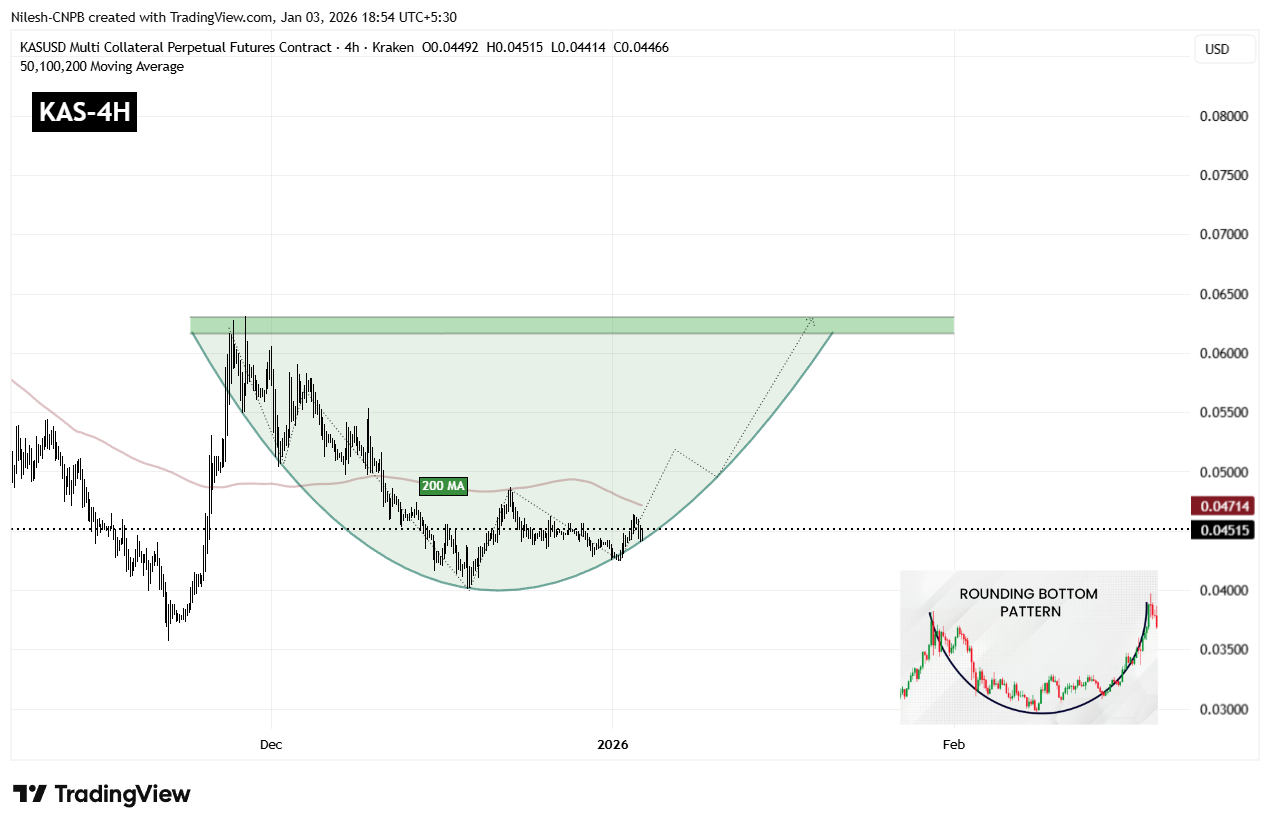
Kaspa (KAS) 4H Chart/Coinsprobe (Source: Tradingview)
A key technical level now comes into focus: the 200-period moving average, currently hovering near $0.04714. This level has acted as dynamic resistance during the recovery phase, and reclaiming it would mark an important shift in short-term market structure.
A sustained move above the 200 MA would indicate that buyers are regaining control after months of corrective price action and could act as the trigger for a stronger upside continuation.
What’s Next for KAS?
For full confirmation of the rounding bottom pattern, KAS must eventually reclaim the $0.06310 neckline resistance. A clean breakout above this zone would validate the entire reversal structure and could open the door to a broader bullish expansion phase, with momentum traders likely re-entering the market.
Until that breakout occurs, the pattern remains in development. Short-term consolidation or shallow pullbacks remain possible, especially near moving average resistance. However, as long as price continues to hold above the $0.04245 support base and maintains higher lows, the broader bottoming structure remains intact and constructive.
In the near term, all eyes remain on the 200 MA and the neckline zone. How Kaspa reacts around these levels will likely determine whether this emerging bullish setup evolves into a confirmed breakout move or requires more time to mature.
Disclaimer: The views and analysis presented in this article are for informational purposes only and reflect the author’s perspective, not financial advice. Technical patterns and indicators discussed are subject to market volatility and may or may not yield the anticipated results. Investors are advised to exercise caution, conduct independent research, and make decisions aligned with their individual risk tolerance.
About Author: Nilesh Hembade is the Founder and Lead Author of Coinsprobe, with over 5 years of experience in the cryptocurrency and blockchain industry. Since launching Coinsprobe in 2023, he has been providing daily, research-driven insights through in-depth market analysis, on-chain data, and technical research.
Disclaimer: The information on this page may come from third parties and does not represent the views or opinions of Gate. The content displayed on this page is for reference only and does not constitute any financial, investment, or legal advice. Gate does not guarantee the accuracy or completeness of the information and shall not be liable for any losses arising from the use of this information. Virtual asset investments carry high risks and are subject to significant price volatility. You may lose all of your invested principal. Please fully understand the relevant risks and make prudent decisions based on your own financial situation and risk tolerance. For details, please refer to
Disclaimer.
Related Articles
ETH drops 0.67% in 15 minutes: short-term profit-taking triggers a pullback
During the period from 2026-03-30 19:00 to 19:15 (UTC), the ETH spot return recorded -0.67%, with a price range of 2014.67 to 2032.63 USDT and a volatility amplitude of 0.88%. Trading in the market during this time window was active, with significant short-term fluctuations, drawing investor attention. Market data shows that, compared with the previous trading day, trading volume expanded in parallel, indicating that more capital battles were being concentrated and released in the short term. The main driving force behind this abnormal move was the proactive selling by short-term profit-taking positions and the concentrated execution of certain large sell orders. Intraday market action originally continued the prior uptrend, but then it was interrupted by this sudden fluctuation, leading to increased volatility and a shift in market sentiment.
GateNews13m ago
Bitcoin ETF Investors in Red Amid Price Decline
Bitcoin ETF holders are facing an average loss of 10% as the price of Bitcoin remains below its realized price. This downturn reflects a broader decline in the spot price and raises concerns about market pressure and future trends.
BlockChainReporter26m ago
Shiba Inu Holds Range While Rising Reserves Signal Growing Sell Pressure
Shiba Inu's massive -1,813% spot flow change reflects low baseline distortion rather than actual capital flight, with exchange reserves increasing and modest market activity, indicating steady sell-side pressure but limited momentum.
CryptoFrontNews30m ago
Dogecoin Holds Key Support as 23% YTD Drop Deepens
Key Insights:
Dogecoin has declined over 23% year to date, with broader macroeconomic pressure and weak crypto sentiment driving sustained selling across major digital assets.
The $0.07 to $0.08 range remains a historically strong support zone, previously triggering sharp recoveries and
CryptoNewsLand50m ago
XRP Price Compresses Near $1.40 as Traders Brace for Breakout
Key Insights
XRP trades within a tightening triangle, with resistance at $1.40 and support near $1.30 shaping a decisive breakout setup expected in early April.
Rising derivatives volume and open interest indicate fresh positioning, while liquidation data highlights repeated failed breakout
CryptoNewsLand55m ago
