
Key Highlights
-
COW price jumps over 9% in 24 hours following CoW Swap’s launch on the Plasma Network
-
Power of 3 (PO3) pattern forming, often seen near market cycle lows
-
Price now attempting to reclaim $0.2450 support, signaling potential expansion phase
-
200-day moving average near $0.2832 stands as the next key resistance
-
Successful breakout could open upside toward $0.50 and $0.84
Cow Protocol’s native token COW is showing renewed strength after weeks of muted price action, rising over 9% in the last 24 hours following the latest ecosystem update announcing CoW Swap going live on the Plasma Network, a stablecoin-native Layer-1 focused on real-world payments.
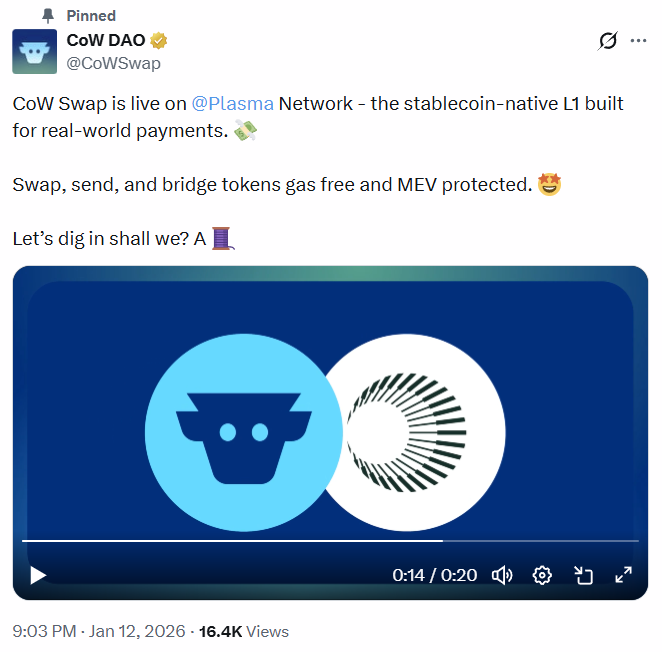
Source: @CoWSwap (X)
Beyond the short-term price pop, the daily chart structure is beginning to tell a much more interesting story, with a classic market cycle pattern quietly taking shape that could signal a larger directional move ahead.
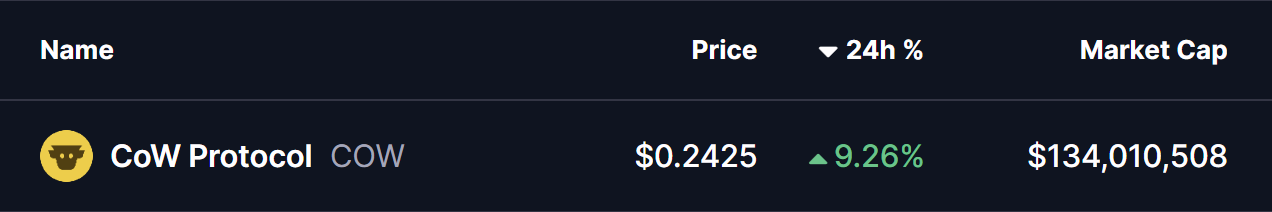
Source: Coinmarketcap
Power of 3 Pattern Taking Shape on the Chart
From a technical perspective, COW appears to be forming a Power of 3 (PO3) pattern, a structure often seen near market bottoms and early trend transitions. This pattern typically unfolds in three distinct phases: accumulation, manipulation, and expansion — with the most aggressive price movement usually occurring once the final phase begins.
Accumulation Phase: Range-Bound Base Formation
Earlier in the year, COW spent several months trading sideways inside a clearly defined range, capped by resistance near $0.50 and supported around the $0.2450 level.
This prolonged consolidation — highlighted by the gray zone on the chart — reflected steady accumulation, where long-term participants gradually built positions while volatility remained compressed. During this phase, price respected range boundaries, suggesting equilibrium between buyers and sellers rather than trend continuation.
Manipulation Phase: Liquidity Sweep Below Support
As broader market conditions weakened, COW briefly broke down below its accumulation support at $0.2450, sliding sharply toward a local low near $0.16.
This move — marked by the red-shaded zone — aligns closely with the manipulation phase of the Power of 3 pattern. Such breakdowns are often designed to trigger stop losses, shake out weak hands, and push sentiment decisively bearish.
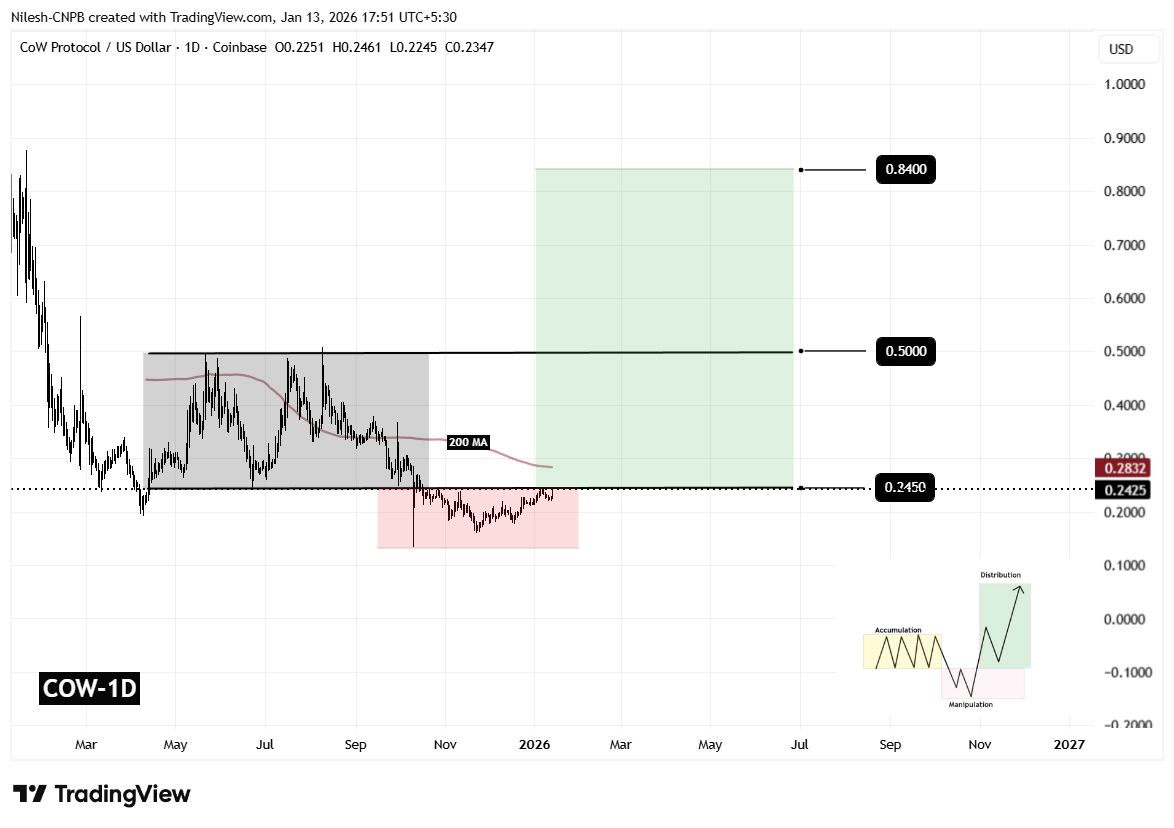
Cow Protocol (COW) Daily Chart/Coinsprobe (Source: Tradingview)
Crucially, the sell-off was short-lived. Buyers stepped in aggressively near the lows, absorbing sell pressure and preventing a sustained breakdown — an early sign that downside momentum may have been exhausted.
Expansion Phase: Is the Upside Move Beginning?
Following the liquidity sweep, COW has rebounded and is now attempting to reclaim the $0.2450 level as support. This recovery suggests the potential transition into the expansion phase, where price begins to trend away from the accumulation range.
The sharp reaction from this support zone increases the likelihood that the recent dip was corrective rather than structural, reinforcing the bullish PO3 thesis.
What’s Next for COW?
With price stabilizing above reclaimed support, attention now turns to the 200-day moving average, currently positioned near $0.2832. This level has acted as dynamic resistance and remains a key confirmation point for bulls.
-
A sustained daily close above the 200 MA would strengthen bullish momentum and increase the probability of a move toward $0.50, the top of the prior accumulation range.
-
If COW successfully reclaims and holds this zone, the Power of 3 measured move projection points to a potential upside target near $0.84, derived by extending the height of the accumulation range from the breakout level.
On the downside, failure to hold above the reclaimed support could delay or invalidate the expansion scenario, keeping COW locked in broader consolidation for longer.
Final Outlook
COW is now trading at a technically critical inflection point. The combination of a completed liquidity sweep, reclaim of key support, and improving structure suggests that a larger upside move may be developing — but confirmation remains essential.
The coming sessions will be decisive in determining whether this rebound evolves into a sustained trend or stalls below major resistance.
Frequently Asked Questions (FAQ)
What is Cow Protocol (COW)?
Cow Protocol is a decentralized finance (DeFi) platform focused on MEV-protected trading and optimal order execution, with COW serving as its native utility and governance token.
Why is COW price rising today?
COW gained momentum after CoW Swap went live on the Plasma Network, combined with a strong technical rebound from key support levels on the chart.
What is the Power of 3 pattern?
The Power of 3 (PO3) is a market structure consisting of accumulation, manipulation, and expansion phases. It often appears near market bottoms and can signal trend reversals.
What is the upside target for Cow Protocol?
If the expansion phase confirms, the projected upside target based on the PO3 pattern is around $0.84.
Is Cow Protocol a good investment?
COW shows improving technical structure, but price confirmation above resistance is still needed. Investors should conduct their own research and manage risk accordingly.
Disclaimer: The views and analysis presented in this article are for informational purposes only and reflect the author’s perspective, not financial advice. Technical patterns and indicators discussed are subject to market volatility and may or may not yield the anticipated results. Investors are advised to exercise caution, conduct independent research, and make decisions aligned with their individual risk tolerance.
About Author: Nilesh Hembade is the Founder and Lead Author of Coinsprobe, with over 5 years of experience in the cryptocurrency and blockchain industry. Since launching Coinsprobe in 2023, he has been providing daily, research-driven insights through in-depth market analysis, on-chain data, and technical research.
Disclaimer: The information on this page may come from third parties and does not represent the views or opinions of Gate. The content displayed on this page is for reference only and does not constitute any financial, investment, or legal advice. Gate does not guarantee the accuracy or completeness of the information and shall not be liable for any losses arising from the use of this information. Virtual asset investments carry high risks and are subject to significant price volatility. You may lose all of your invested principal. Please fully understand the relevant risks and make prudent decisions based on your own financial situation and risk tolerance. For details, please refer to
Disclaimer.
Related Articles
Over $14 billion in options expiry looming! Bitcoin drops below $70,000, with $75,000 becoming a key battleground.
Bitcoin was pressured by a large-scale options expiration on March 27, 2026, causing the price to fall below $70,000, with a low of $69,990. The expiration of options contracts led to price volatility, especially around $75,000, while macro factors such as geopolitical risks and developments in crypto ETFs also influenced market sentiment. Technical analysis shows Bitcoin remains in an upward trend, with a short-term key range of $69,000 to $71,000.
GateNews11m ago
Chainlink (LINK) rebounds in April strengthen signals: whale accumulation, ETF inflows, and supply tightening resonate
Chainlink (LINK) experienced its first bullish candle in March 2026 after six months of decline, indicating an improvement in market sentiment. Whales and medium-sized holder addresses continue to add positions, and institutional demand remains steadily increasing, suggesting a growing willingness for medium- to long-term capital accumulation. Reduced supply and increased on-chain accumulation alleviate selling pressure. LINK is approaching a key support zone; holding this level could signal a reversal. However, macroeconomic uncertainties may still limit the upside potential.
GateNews13m ago
Pi Network (PI) ends 7 months of silence: volatility surges + negative correlation, Bitcoin's rise actually becomes a bearish signal?
Pi Network (PI) has experienced 7 months of low-volatility compression, leading to a clear change in market structure, with the current price around $0.1883. Recent volatility has rebounded above 100%, indicating a new phase in the market, but its rebound potential may be limited by its negative correlation with Bitcoin. Technical analysis shows a potential double-top pattern; if the price drops below $0.1894, it could fall to $0.1527. Short-term trends will be influenced by technical structures and changes in its correlation with Bitcoin.
GateNews14m ago
Ethereum hits the crucial $2,500 mark: capital outflows surge, but valuation risks emerge
Ethereum's current price remains above $2,100 and is in an upward channel, but a breakthrough of the key resistance at $2,393 is needed to continue rising toward $2,500. Meanwhile, on-chain fund inflows are increasing, indicating that investors are inclined to hold long-term, but valuation pressure is rising, and the impact of on-chain activity on price should be monitored. The short-term trend will depend on breaking through resistance levels and changes in market demand.
GateNews15m ago
Is Circle's stock price undervalued after a 22% plunge? Bitwise is optimistic about USDC, with a valuation potentially reaching $75 billion by 2030.
In March 2026, Circle's stock price experienced a significant pullback due to expectations surrounding the CLARITY Act, but Bitwise's Chief Investment Officer believes the market has misjudged. The core driving force behind stablecoins is payment efficiency. Bitwise predicts that by 2030, Circle's valuation could reach $75 billion. Despite increased short-term uncertainty, projects with strong compliance capabilities will benefit in the long run.
GateNews17m ago
Gold crashes 21%, hitting a 106-year record. After Bitcoin stays steady at $70,000, what is its future trend?
In March 2026, gold experienced its largest decline in nearly a century, dropping from $5,193 to $4,098, reflecting a reassessment of its safe-haven properties by investors. Meanwhile, Bitcoin performed relatively stably, becoming a new store of value for some investors. The correlation between gold and Bitcoin has fallen to -0.31, indicating diverging trends. Market opinions on gold's outlook are divided, and future movements will be influenced by geopolitical and monetary policy developments.
GateNews21m ago
