
Pump.fun (PUMP) has been cooling off during the past 3 days, yet the broader structure on the chart suggests the story may not be finished. Price action shows that PUMP had already recorded more than an 80% rise before the recent pullback, which makes the current pause look more like a breather than a breakdown. That slow but upward move that began toward the end of December is still visible when the chart is viewed as a whole.
Early price behavior matters here. PUMP spent weeks drifting lower before finding a base near the $0.0020 area. From that zone, price began forming higher lows, followed by a gradual push upward. The recent decline has not erased that structure, which is why this cooling phase is drawing attention rather than concern.
Pump.fun Price Analysis Shows A Shift After Long Term Downtrend Break
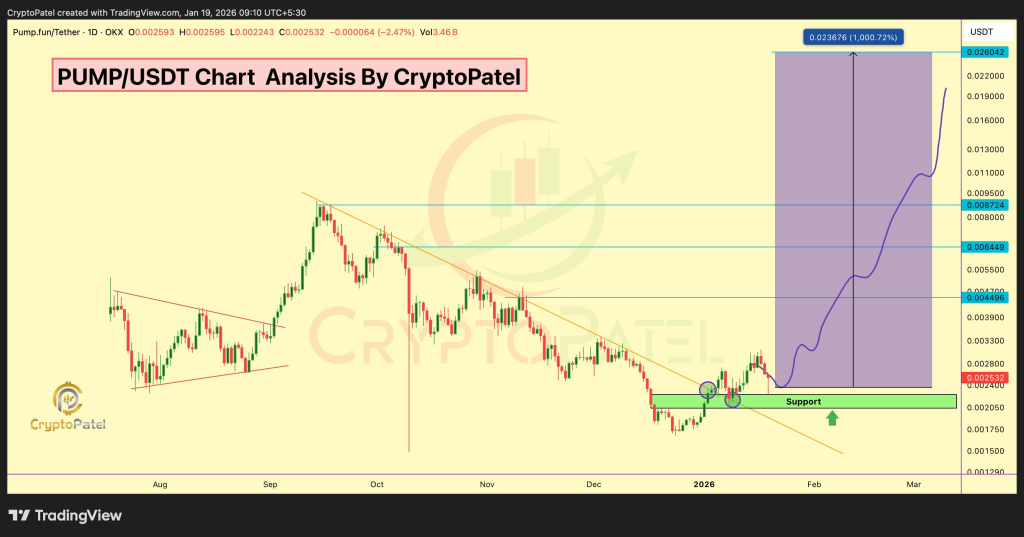
A closer look at the daily chart highlights a major technical shift. Pump.fun price recently moved above a long-term descending trendline that had capped upside attempts for months. That break often changes how a market behaves, since former resistance can start acting as support.
According to Crypto Patel, this break places PUMP inside what he describes as a bullish expansion zone. His analysis points to a completed distribution and correction phase, followed by early reversal signals. That interpretation lines up with the chart, where price stopped making lower lows and began stabilizing above the $0.0020 level.
@CryptoPatel / X
The attached chart also shows a descending wedge structure that resolved to the upside. That pattern often appears near the end of corrective phases, especially when volume starts to improve and downside momentum fades.
PUMP Price Holds Key Demand Zone That Supports Bullish Structure
One of the most important areas on the chart sits between $0.0020 and $0.0022. That zone has acted as a strong demand region, with multiple tests that failed to push price decisively lower. Each successful hold adds weight to the idea of accumulation rather than distribution.
Crypto Patel emphasizes that PUMP price remaining above $0.0020 keeps the bullish bias intact. The chart supports this view, since price has reclaimed support levels that previously acted as resistance. Those reclaims often signal that buyers are willing to step in earlier than before.
Why Bittensor (TAO) Could Be One of the Most Important AI Cryptos Ever Built_**
When projecting forward, the chart highlights several technical levels that stand out. Crypto Patel outlines upside zones around $0.00872, $0.015, and $0.026. From current levels, those targets imply a potential 500% to 1000% move if momentum continues building.
That potential does not come without risk, which is why the invalidation point matters. A daily close below $0.0020 would weaken the bullish structure and challenge the current PUMP price prediction. Until that happens, the chart continues to favor higher levels over time.
Disclaimer: The information on this page may come from third parties and does not represent the views or opinions of Gate. The content displayed on this page is for reference only and does not constitute any financial, investment, or legal advice. Gate does not guarantee the accuracy or completeness of the information and shall not be liable for any losses arising from the use of this information. Virtual asset investments carry high risks and are subject to significant price volatility. You may lose all of your invested principal. Please fully understand the relevant risks and make prudent decisions based on your own financial situation and risk tolerance. For details, please refer to
Disclaimer.
Related Articles
Bearish sentiment builds in crypto as volatility and hedging rise
The crypto market exhibited signs of volatility on Tuesday, with bitcoin BTC$66,223.90 spiking to $68,300 shortly after midnight UTC before tumbling back to $66,500.
The initial spike was spurred by reports that U.S. President Donald Trump was willing to end the war in Iran without the Strait of
CoinDesk24m ago
Stablecoins grow faster than expected as more new applications emerge
Stablecoin is experiencing faster growth than expected, driven by new applications like AI payments. However, Standard Chartered maintains its forecast of a $2 trillion market cap by 2028.
TapChiBitcoin44m ago
PI Network (PI) Price Predictions for This Week
PI Network's price has corrected from $0.30 to $0.17, indicating a 40% drop. Currently, it hovers around $0.18, presenting a bearish outlook unless it surpasses $0.20. Volume remains low, suggesting indecision among sellers, while the RSI stays under 50, signaling further potential declines.
CryptoPotato50m ago
BTC drops 0.58% in 15 minutes: a pullback triggered by on-chain capital flows accelerating and a resonance with macro uncertainty
2026-03-31 09:45 to 10:00 (UTC), BTC recorded a return of -0.58% within 15 minutes, with a trading range of 65,996.1–66,509.1 USDT, a volatility of 0.77%. Short-term fluctuations intensified, drawing market attention. Total on-chain transfers reached 420,000, with the number of transactions as high as 27,986, indicating rapid capital movement and a phased increase in market participation, though overall trading remains cautious.
The primary drivers behind this deviation are on-chain large-capital reallocation activity and an acceleration in fund flows. On-chain data shows that both the total transfer volume and the number of transactions have risen together
GateNews1h ago
ETH 15-minute drop of 0.61%: Main capital accelerates outflows and on-chain activity declines in sync, suppressing the market
2026-03-31 09:45 to 2026-03-31 10:00 (UTC), the ETH price fluctuated between 2012.5 and 2030.74 USDT. The 15-minute K-line return rate was -0.61%, and the amplitude reached 0.90%. Among major coins, performance was relatively weak; short-term market attention increased, volatility slightly worsened, and selling pressure was clearly released.
The main driving force behind this unusual move is that large funds continued to flow out throughout the day; from 09:45 to 10:00, the outflow intensity further increased. According to on-chain and trading data, on March 3rd, the outflow of main funds persisted, indicating sustained selling pressure and a lack of buying support, which contributed to the continued downward trend in ETH prices.
GateNews1h ago
