
Key Takeaways
-
Immutable (IMX) is gaining attention as the gaming crypto sector shows renewed strength in both market cap and volume.
-
The weekly chart points to a developing Power of 3 (PO3) structure, often seen near major market bottoms.
-
IMX has completed a long accumulation phase and appears to be stabilizing after a manipulation-driven breakdown.
-
Reclaiming the $0.35 level and the 50-week moving average near $0.53 is crucial to confirm bullish continuation.
-
A breakout above $0.815 could open the door for a larger upside move toward the $1.42 region in the coming months.
In the cryptocurrency market today, gaming tokens are back in the spotlight, with** Immutable (IMX) **drawing increased attention. The overall gaming narrative market cap has climbed by 2.99%, while trading volume has jumped a notable 9.57% over the past 24 hours.
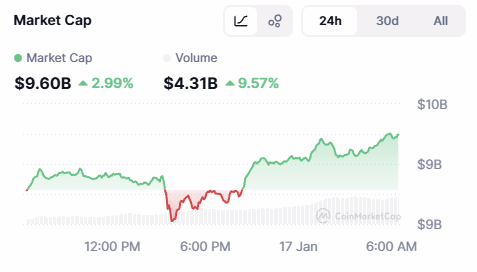
Source: Coinmarketcap
Riding this momentum, IMX is up nearly 7% on the day. More importantly, the higher-timeframe chart is beginning to reveal a larger technical structure that could be setting the stage for a meaningful upside move in the weeks ahead.
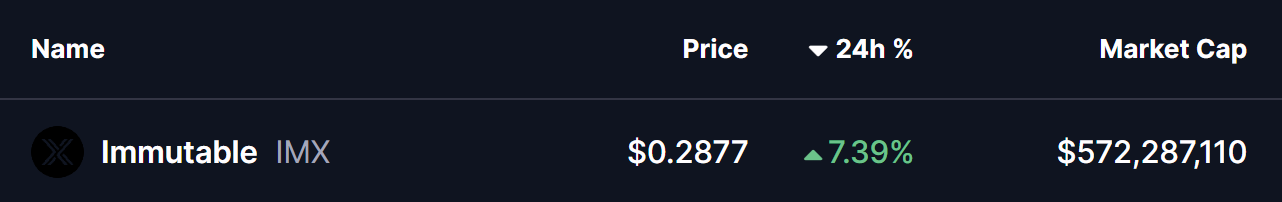
Source: Coinmarketcap
Weekly Chart Signals a Bullish Move
From a technical perspective, the weekly **IMX **chart suggests the formation of a classic Power of 3 (PO3) structure — a pattern often seen near major market bottoms and trend transitions. This setup typically unfolds in three phases: accumulation, manipulation, and expansion, with the strongest price move usually emerging once the expansion phase begins.
Accumulation Phase
Between February and November 2025, IMX spent an extended period consolidating within a clearly defined range. Price action remained capped near the $0.815 resistance zone, while buyers consistently defended the $0.35 support area. This prolonged sideways movement reflects steady accumulation, where long-term participants quietly build positions while volatility remains compressed.
Manipulation Phase
During the broader market downturn in November 2025, IMX broke decisively below the $0.35 accumulation support, sliding toward a local low around $0.2031. This sharp breakdown, highlighted on the chart by the lower shaded zone, aligns well with the manipulation phase of the Power of 3 pattern.
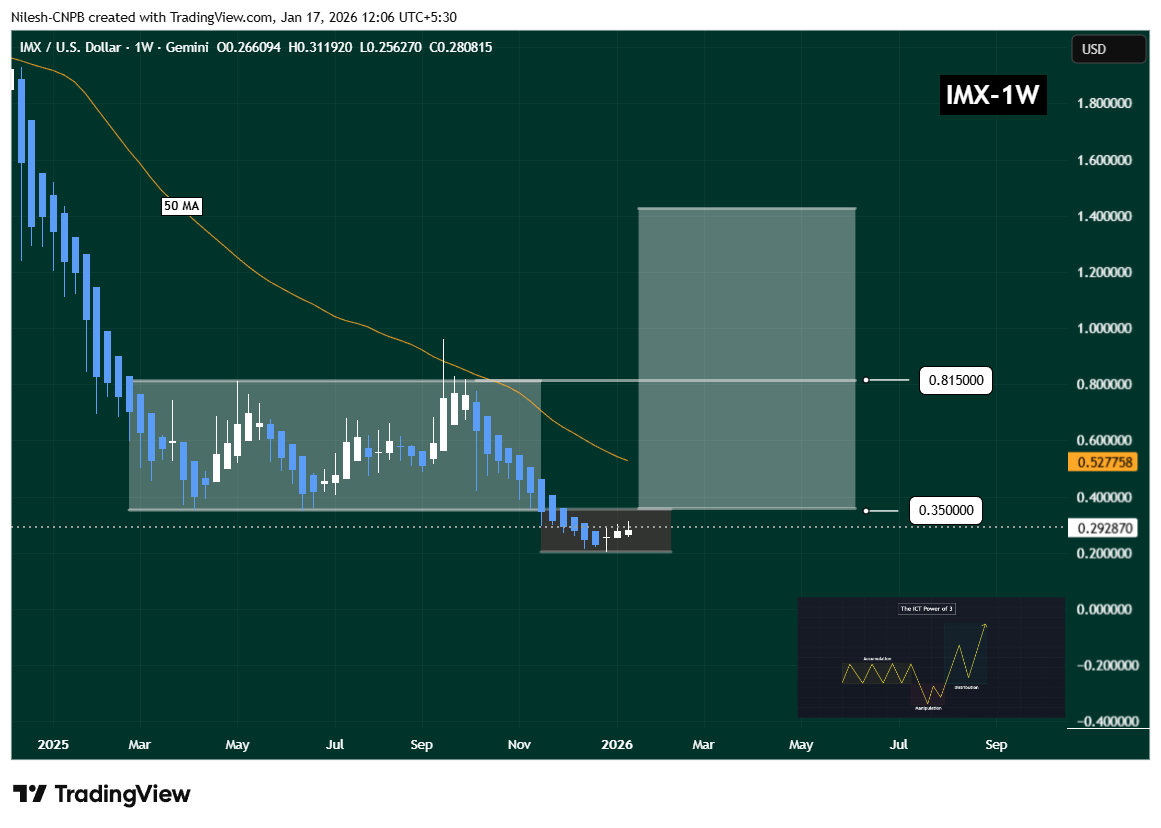
Immutable (IMX) Weekly Chart/Coinsprobe (Source: Tradingview)
At this stage, stop losses are triggered, sentiment turns bearish, and weaker hands are forced out of the market. Notably, selling pressure has started to fade near this region, with IMX now trading around $0.2928 — an early sign that downside momentum may be losing steam.
What Comes Next for IMX?
Currently, IMX remains in the lower portion of the manipulation phase, trading just below the crucial $0.35 level. This zone is particularly important, as it previously acted as strong accumulation support and now serves as a key decision area.
For bullish momentum to gain credibility, IMX must first reclaim $0.35 and then push above the 50-week moving average, which sits near $0.5277. A sustained move above these levels would strongly suggest a transition into the expansion phase of the Power of 3 structure, where upside momentum typically accelerates.
If price manages to break and hold above the $0.815 resistance, the longer-term chart projection opens the door toward the $1.42 region in the coming months — a level that aligns with prior structural targets on the weekly timeframe.
That said, the setup remains conditional. As long as IMX trades below $0.35, downside risks cannot be completely ruled out, and price may continue to experience volatility. Holding current lows and reclaiming key resistance zones will be critical for bulls to confirm a broader trend reversal.
Bottom Line
While Immutable (IMX) has already posted a strong short-term bounce, the bigger story lies in its higher-timeframe structure. The ongoing stabilization near cycle lows, combined with a developing Power of 3 pattern, suggests that IMX could be preparing for a larger move — provided key levels are reclaimed. For now, patience is warranted, but the chart hints that the worst of the downside may already be behind.
Frequently Asked Questions (FAQ)
Is Immutable (IMX) bullish right now?
IMX is showing early signs of stabilization after a deep correction. While it is not fully bullish yet, reclaiming $0.35 and the 50-week moving average would significantly strengthen the bullish case.
What is the Power of 3 pattern in crypto trading?
The Power of 3 (PO3) is a market structure consisting of accumulation, manipulation, and expansion phases. It is often seen near major bottoms before strong trend reversals.
Disclaimer: The views and analysis presented in this article are for informational purposes only and reflect the author’s perspective, not financial advice. Technical patterns and indicators discussed are subject to market volatility and may or may not yield the anticipated results. Investors are advised to exercise caution, conduct independent research, and make decisions aligned with their individual risk tolerance.
About Author: Nilesh Hembade is the Founder and Lead Author of Coinsprobe, with over 5 years of experience in the cryptocurrency and blockchain industry. Since launching Coinsprobe in 2023, he has been providing daily, research-driven insights through in-depth market analysis, on-chain data, and technical research.
Disclaimer: The information on this page may come from third parties and does not represent the views or opinions of Gate. The content displayed on this page is for reference only and does not constitute any financial, investment, or legal advice. Gate does not guarantee the accuracy or completeness of the information and shall not be liable for any losses arising from the use of this information. Virtual asset investments carry high risks and are subject to significant price volatility. You may lose all of your invested principal. Please fully understand the relevant risks and make prudent decisions based on your own financial situation and risk tolerance. For details, please refer to
Disclaimer.
Related Articles
'How Did You Manage That?': Peter Schiff Trolls Michael Saylor Over 4.5% Bitcoin Loss and $44 Billion Plans - U.Today
Michael Saylor continues to invest heavily in Bitcoin, purchasing $76.6 million worth despite facing criticism from Peter Schiff about recent losses. Saylor aims to acquire one million BTC, supported by a new $44.1 billion funding plan, while Schiff highlights the ongoing portfolio drawdown.
UToday52m ago
Cardano (ADA) Price Reclaims $0.26 as Volume Rockets 60% - U.Today
Cardano (ADA) has recovered to $0.26, up 3% with a 60% increase in trading volume. While analysts caution it remains range-bound, historical data suggests a potential bullish close in March, driven by market trends and DeFi growth.
UToday1h ago
Aster (ASTER) Price Breakout Fails After 35-Day Consolidation – What Happens Next?
The ASTER price has been consolidating for over a month, fluctuating without significant movement. A failed breakout led to a loss of key support at $0.68, indicating a bearish trend. The focus now is on whether it can recover above $0.68 to regain stability.
CaptainAltcoin1h ago
Bitcoin Decouples From S&P 500 as Retail Demand Weakens
Bitcoin retail activity has decreased by 10%, the lowest since January 2025, indicating weaker market participation. The advent of ETFs has shifted retail access off-chain, while Bitcoin has diverged from the S&P 500, marking its longest decoupling since 2020 amid a correction phase.
CryptoFrontNews1h ago
Bitcoin Is Experiencing Its Longest Decoupling From the S&P 500 Since 2020
Bitcoin's recent price movements have diverged from U.S. equities, marking the longest decoupling since 2020. Following significant liquidation, Bitcoin's decline contrasts with a more stable S&P 500, highlighting crypto's unique challenges amid broader market stress.
BlockChainReporter2h ago
Scaramucci says BTC's 4-year cycle still in play, forecasts rise in Q4
The current Bitcoin (BTC) bear market can be explained by the four-year cycle and long-term BTC holders selling at the $100,000 psychological level, according to Anthony Scaramucci, managing partner of the SkyBridge investment firm.
Bitcoin’s four-year market cycle has been “muted” by
Cointelegraph3h ago
