Cardano price continues to rise, but the familiar scenario repeats itself. Since January 20, ADA has increased by about 7%, at one point surpassing higher levels but then quickly stalling around the $0.35 mark. This is not a trend breakout; rather, it’s just a brief rebound lacking the momentum to sustain the upward movement.
There are three main reasons explaining why Cardano’s rallies keep failing, resulting in the market environment still lacking significant positive changes.
Weak Bullish Divergence Only Leads to Short-Term Rebound
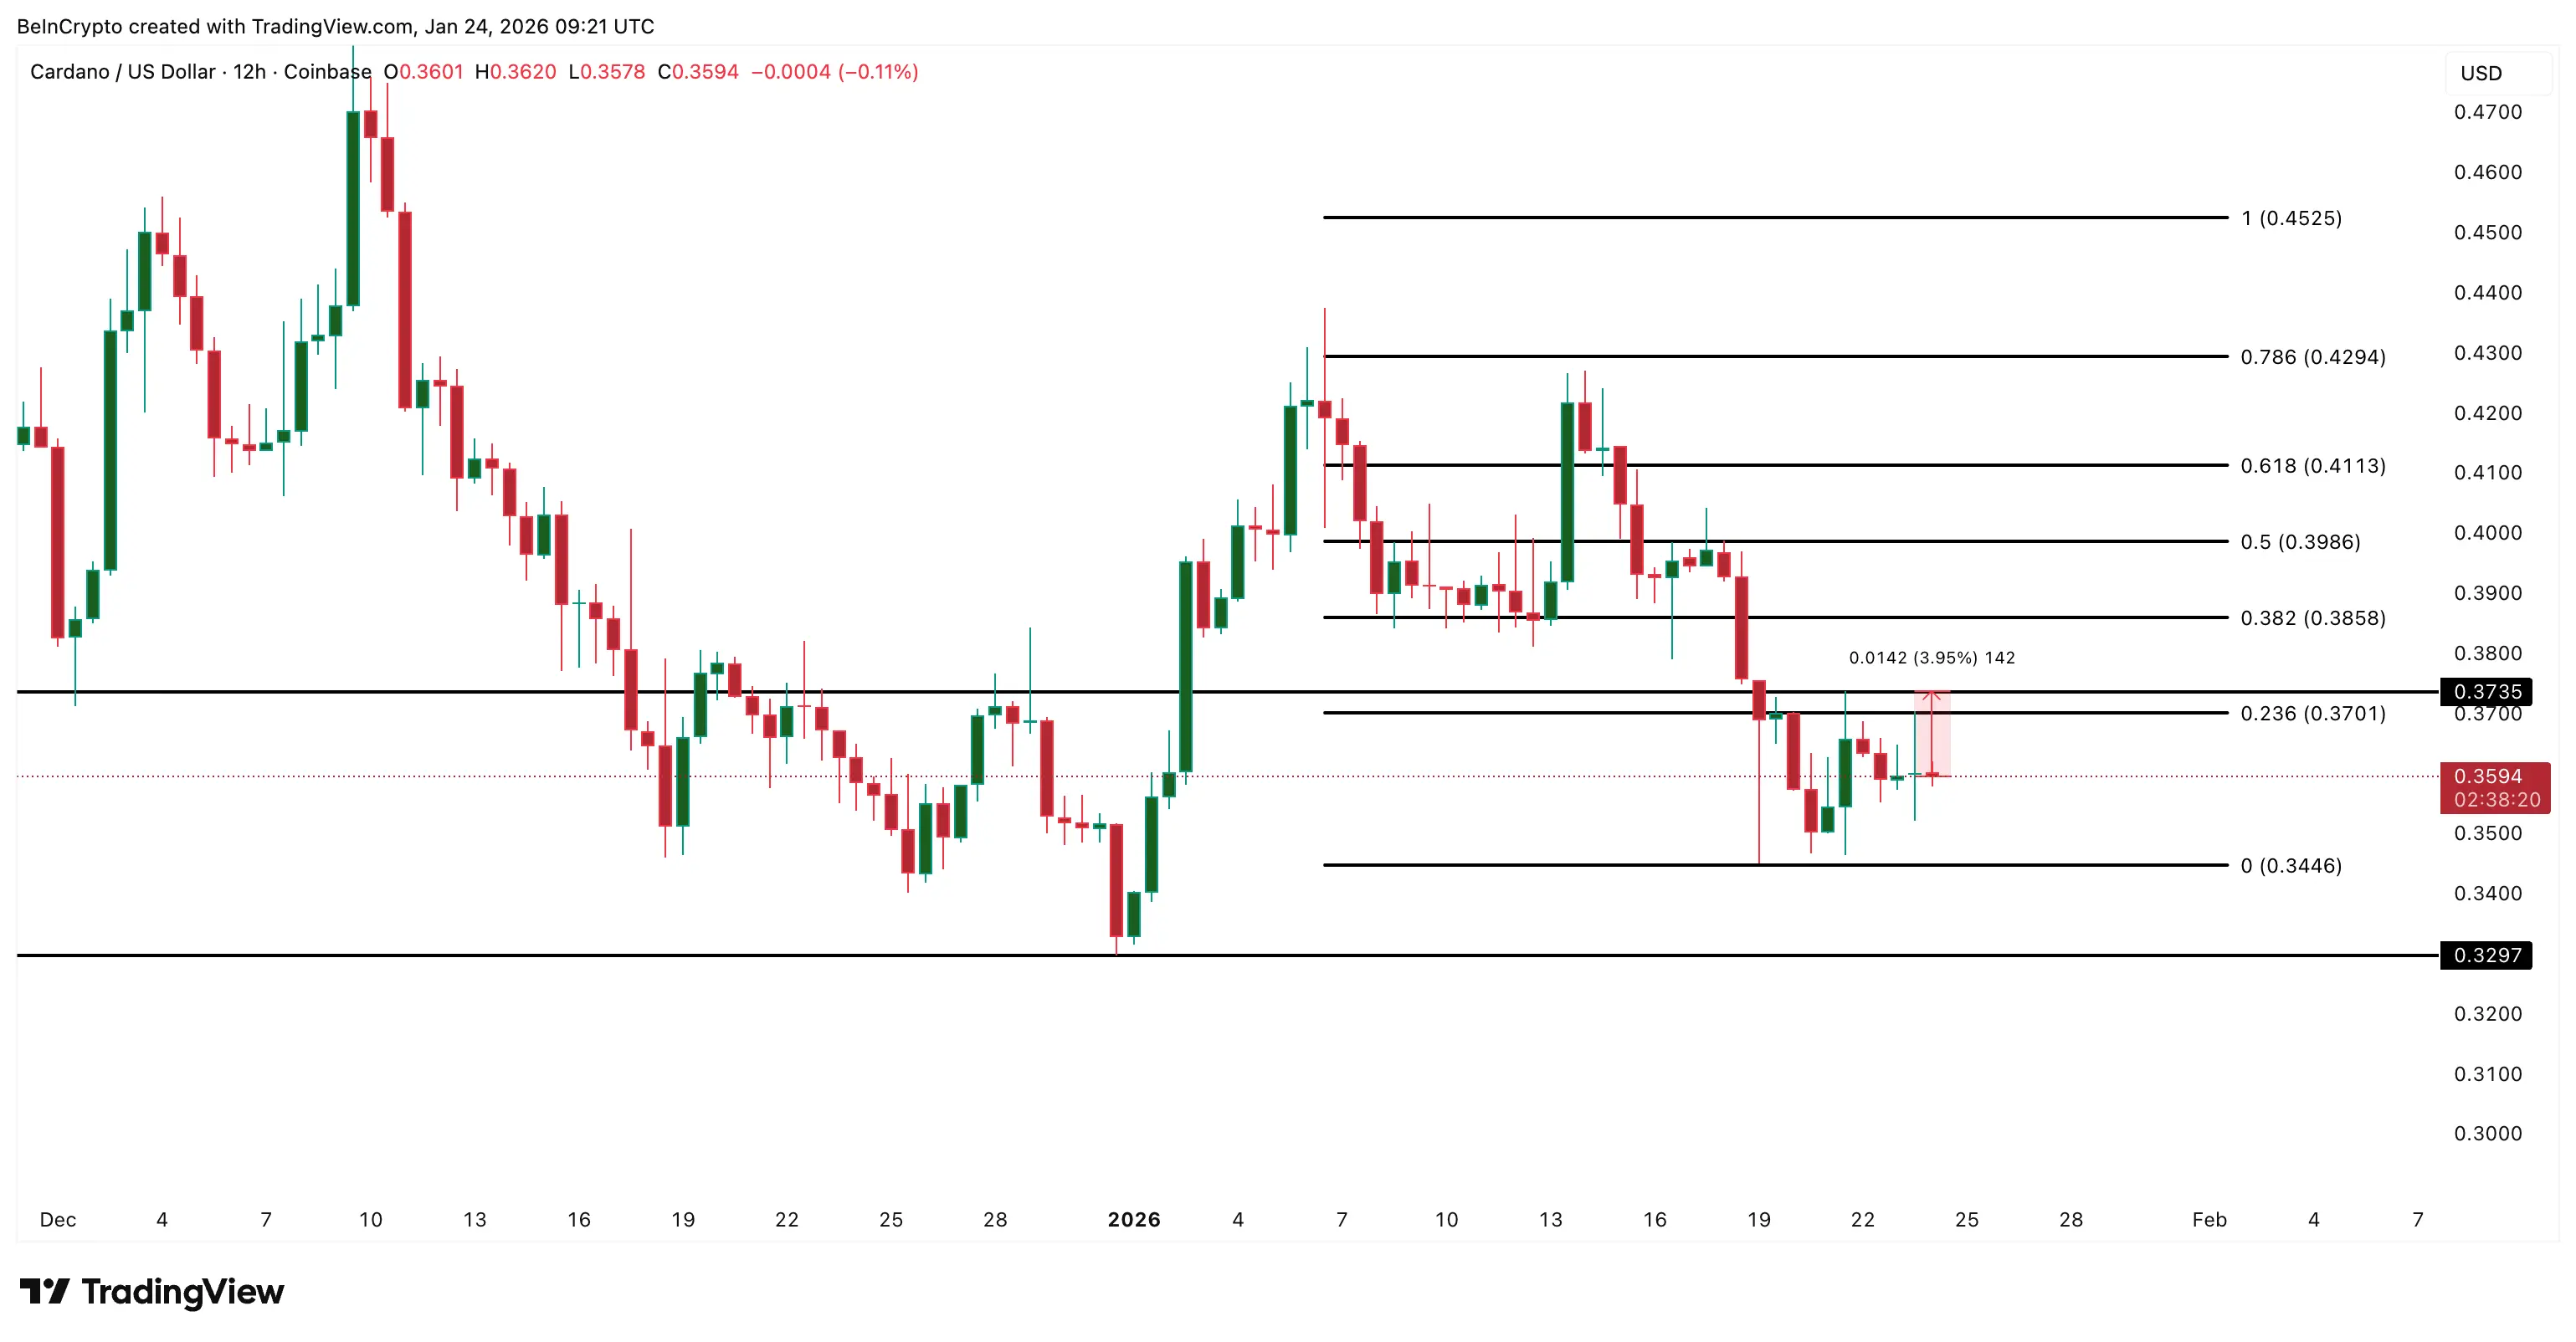
The latest surge of ADA was triggered by a hidden bullish divergence signal on the 12-hour chart. From late December to January 20, ADA’s lows were higher, while the RSI indicator formed lower but very shallow lows.
This indicates that selling pressure has eased slightly, but it doesn’t necessarily mean buying pressure has taken control of the market. Such divergence usually only results in short-term recoveries rather than establishing a sustainable uptrend.
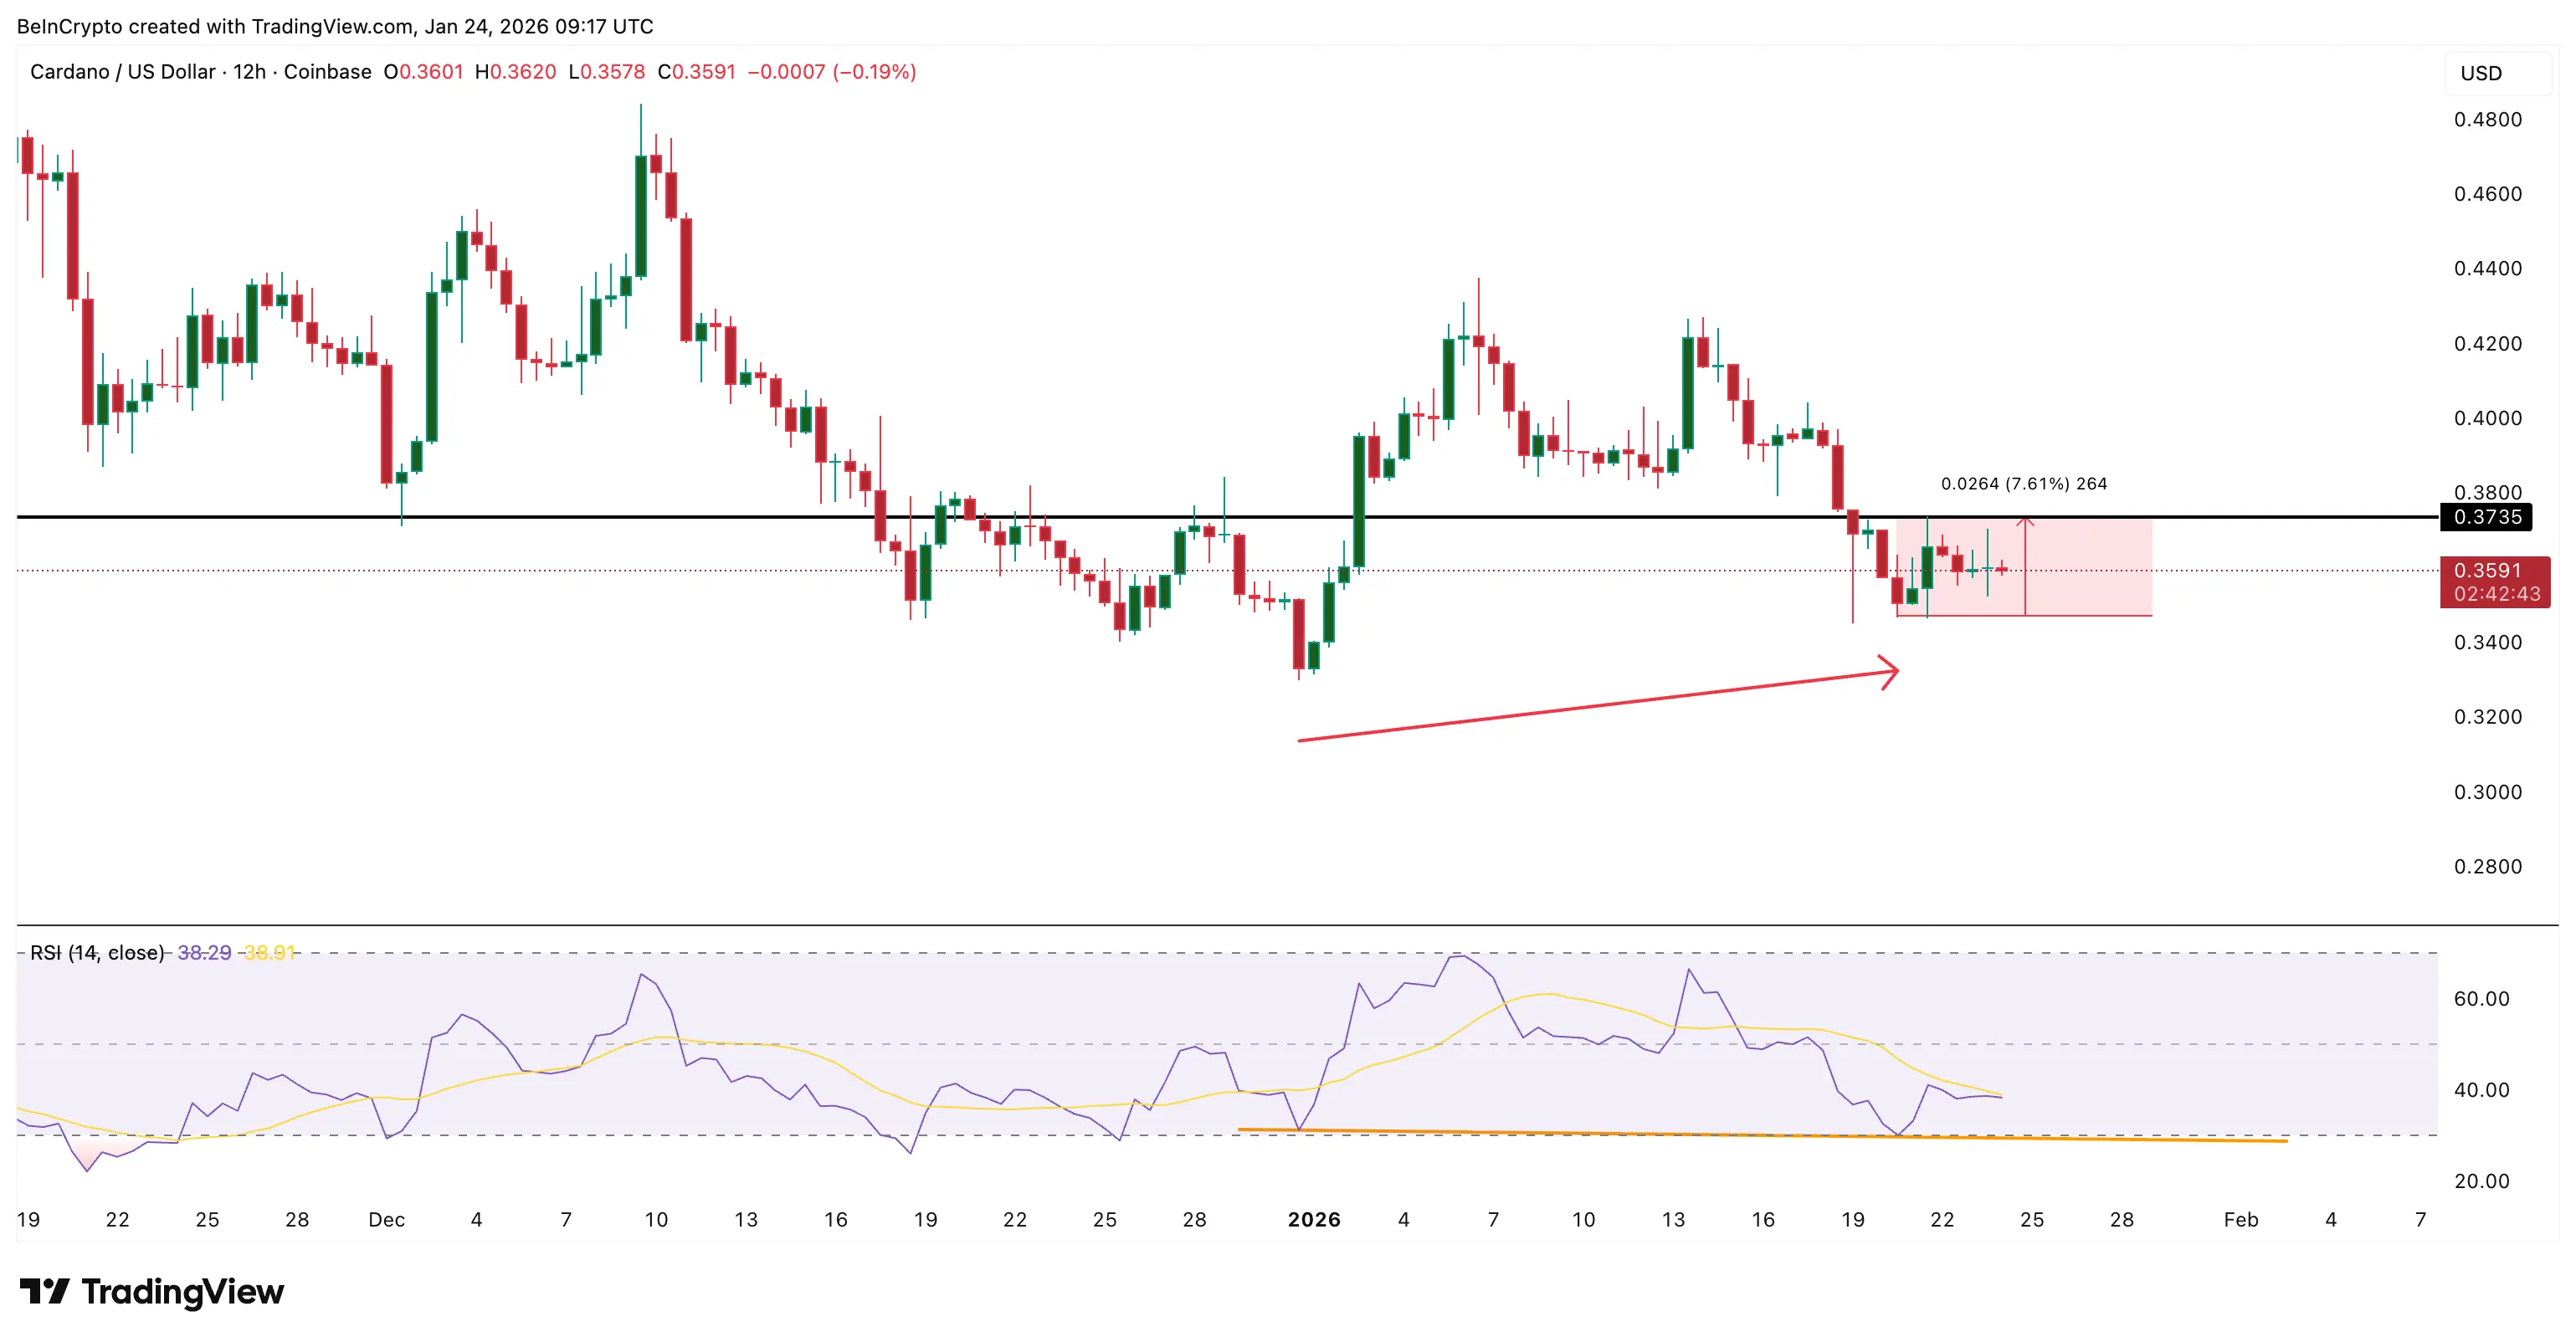 Weak Divergence | Source: TradingView
In reality, this was proven true: Cardano’s price increased about 7% to $0.37 on January 21, but the rally quickly stalled.
Weak Divergence | Source: TradingView
In reality, this was proven true: Cardano’s price increased about 7% to $0.37 on January 21, but the rally quickly stalled.
This period also coincided with the Cardano development activity index reaching a peak of 6.94—the highest in a month. Development activity often underpins confidence in the price, and in mid-January, ADA’s local peak appeared right after development activity hit its high.
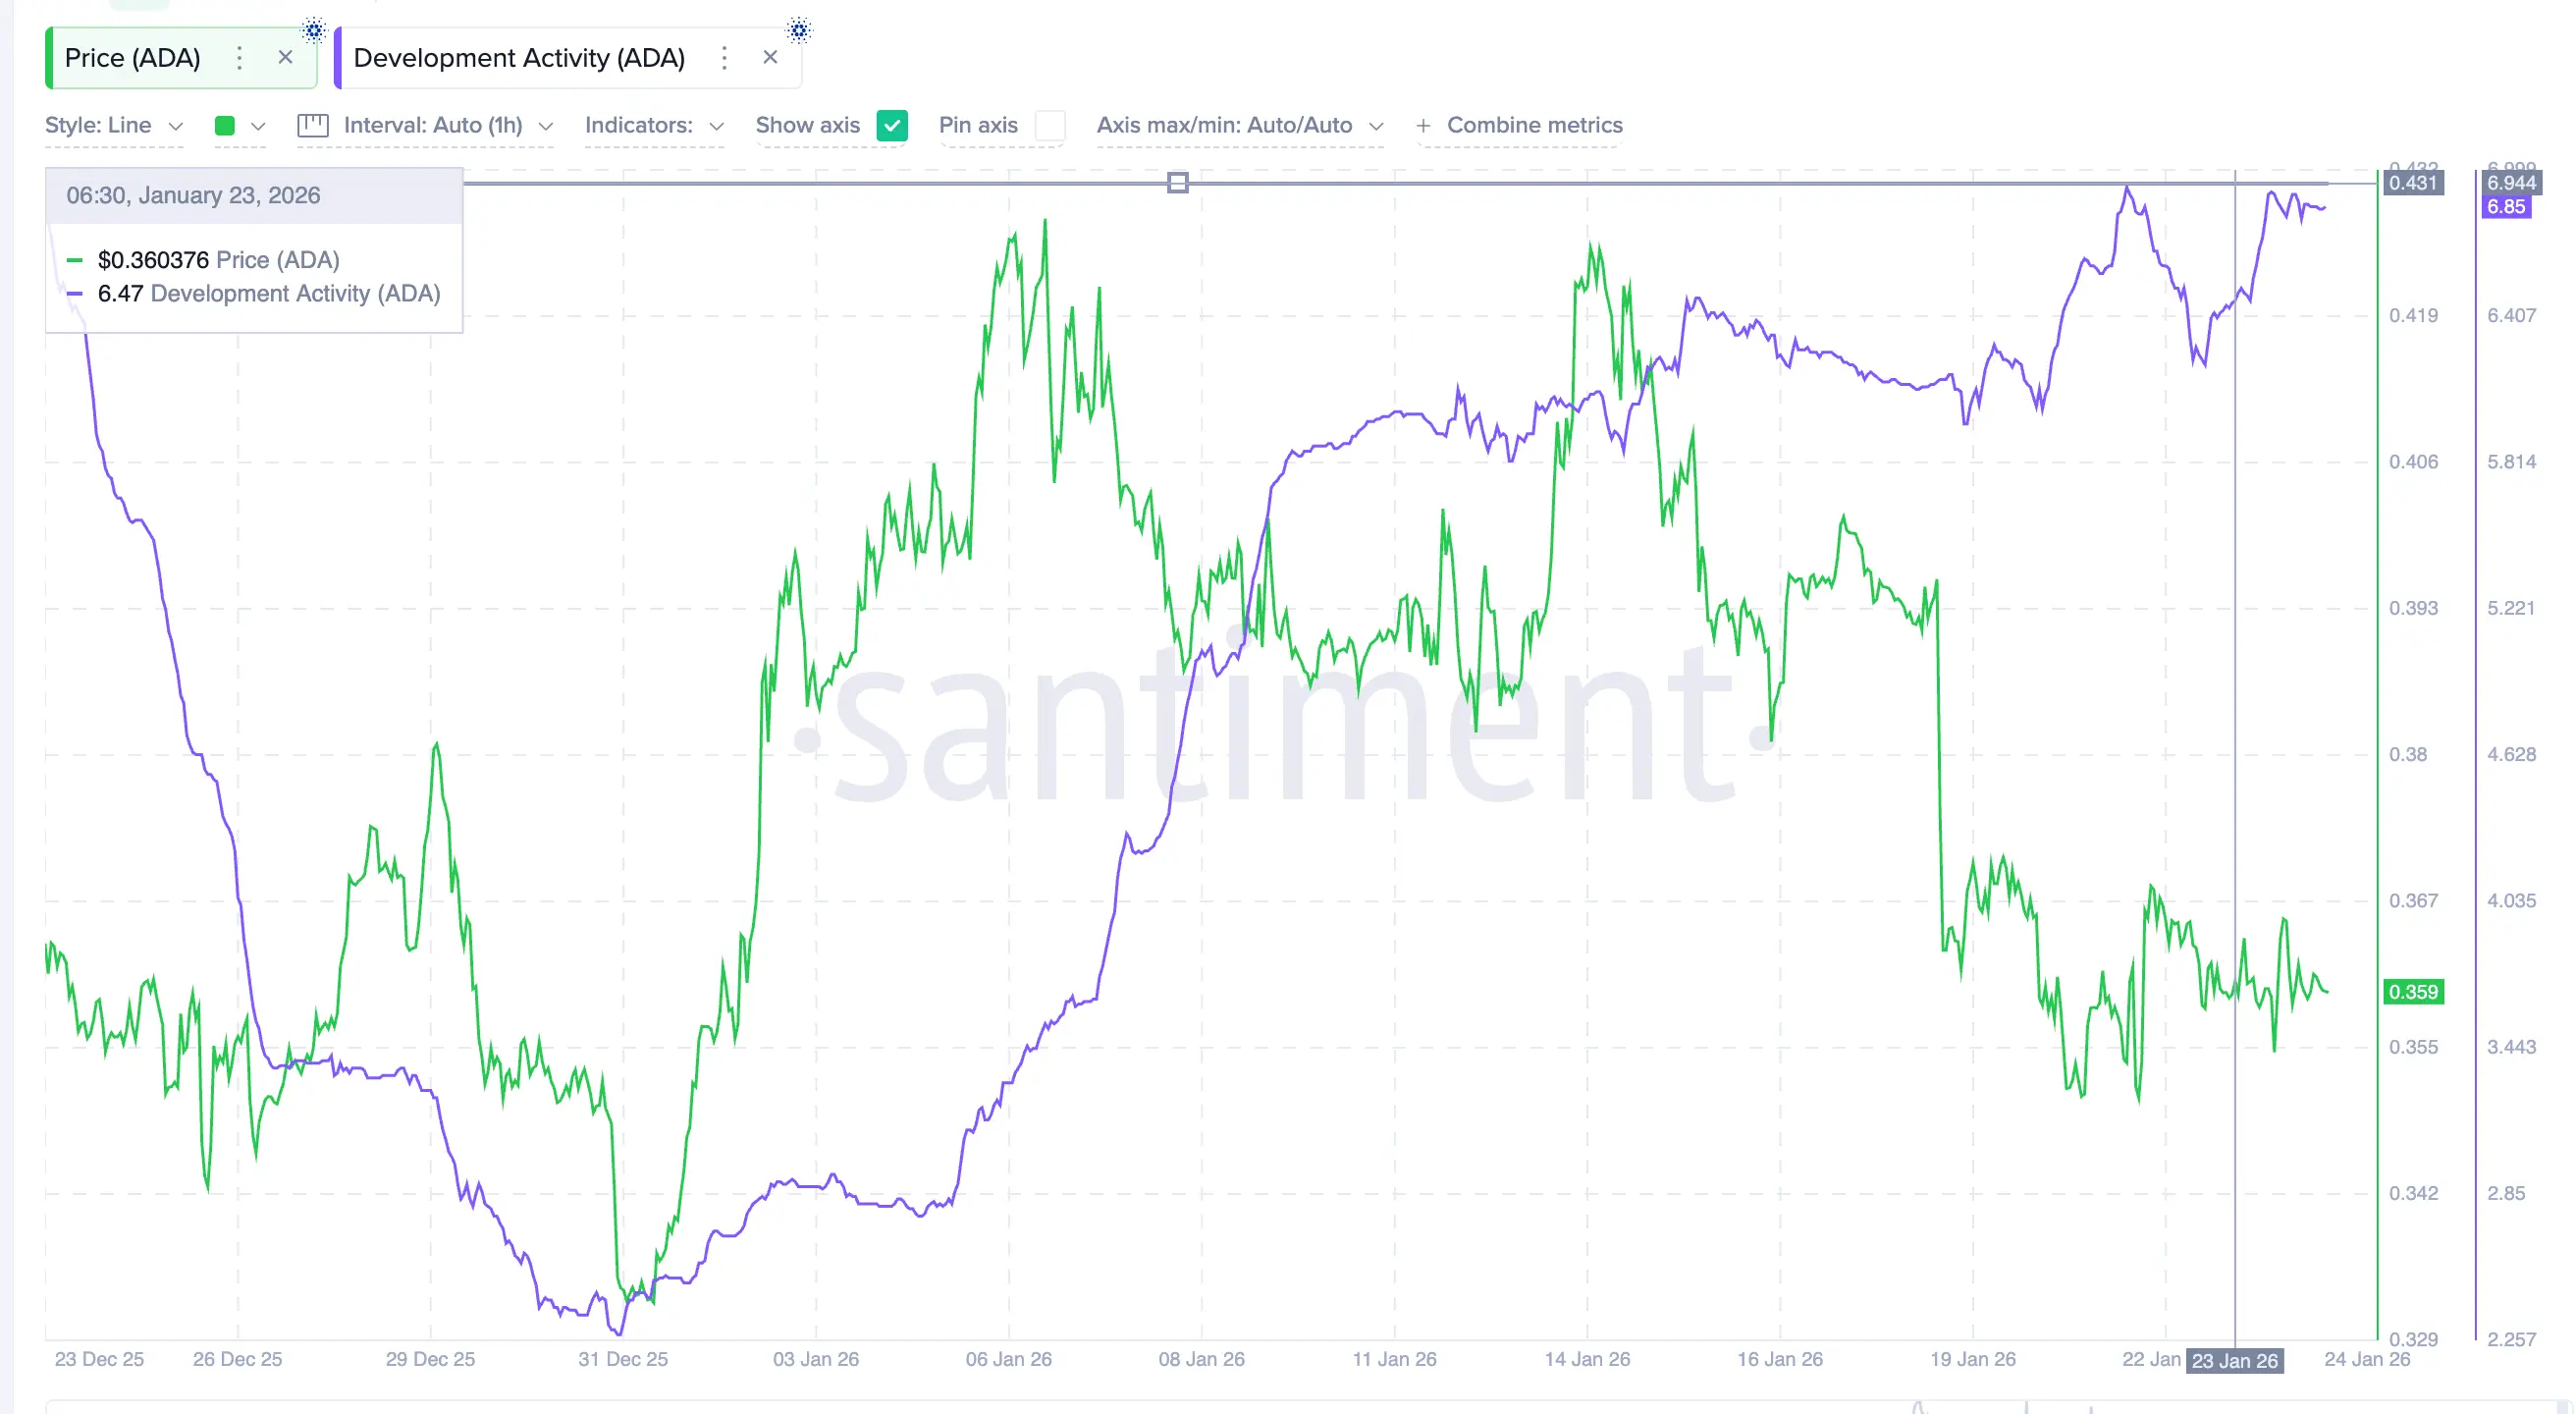 Development activity peaks then declines | Source: Santiment
However, this support didn’t last. When development activity declines, the price also adjusts quickly. Currently, the index has recovered to 6.85 but still hasn’t surpassed the monthly high. The hidden bullish divergence helped prevent a sell-off but hasn’t generated enough demand to sustain the rally when development activity stalls.
Development activity peaks then declines | Source: Santiment
However, this support didn’t last. When development activity declines, the price also adjusts quickly. Currently, the index has recovered to 6.85 but still hasn’t surpassed the monthly high. The hidden bullish divergence helped prevent a sell-off but hasn’t generated enough demand to sustain the rally when development activity stalls.
Profit-taking pressure intensifies with each ADA rebound
A bigger challenge lies in market behavior after each ADA price increase.
The “spent coins age band” indicator shows the movement of coins across all age groups. An increasing indicator value usually means investors are selling and taking profits. Over the past month, each ADA rebound has been accompanied by a sharp increase in profit-taking activity.
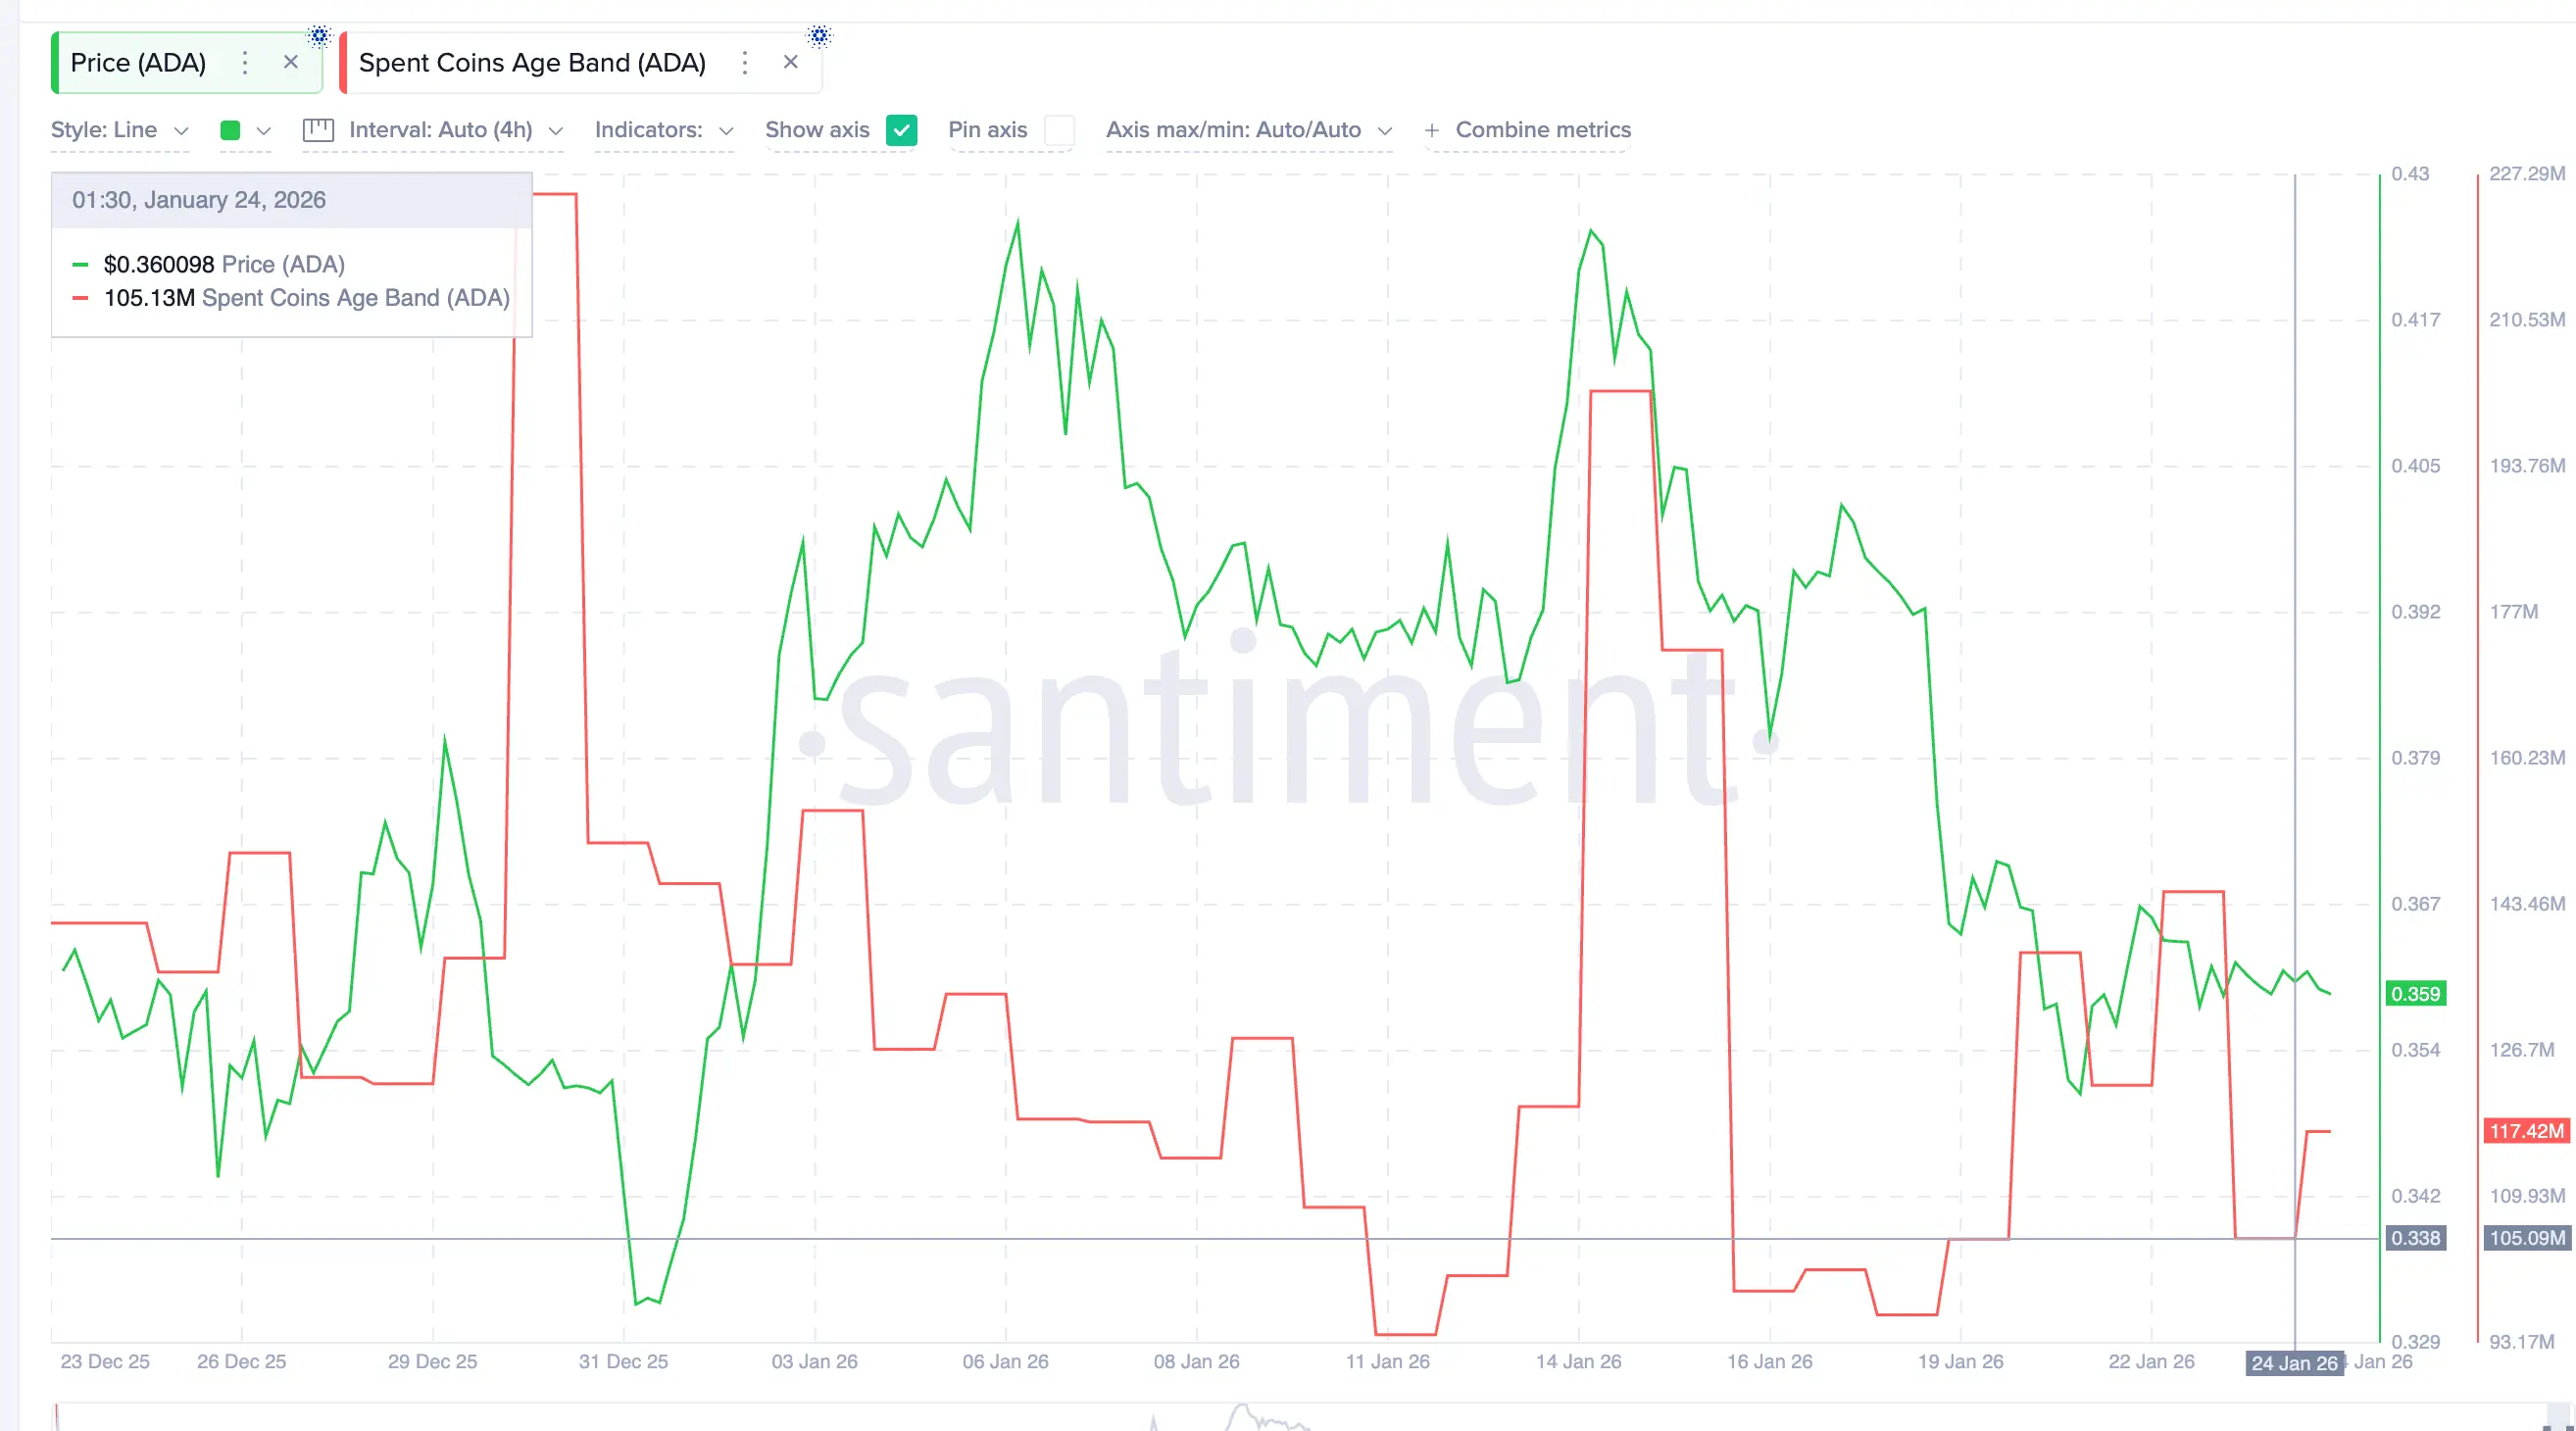 Trading activity peaks | Source: Santiment
At the end of December, Cardano’s price rose about 12%, while coin consumption activity increased over 80%, reflecting strong selling pressure during price rises. By mid-January, ADA gained another 10%, with coin consumption activity nearly doubling, indicating investors are continuously riding the wave to exit their positions.
Trading activity peaks | Source: Santiment
At the end of December, Cardano’s price rose about 12%, while coin consumption activity increased over 80%, reflecting strong selling pressure during price rises. By mid-January, ADA gained another 10%, with coin consumption activity nearly doubling, indicating investors are continuously riding the wave to exit their positions.
This pattern is repeating. Since January 24, coin consumption activity has increased by over 11%, from 105 million to 117 million, even though ADA’s price has not yet broken resistance levels. This suggests sellers are proactively preparing for the next correction rather than waiting for clear confirmation signals.
Therefore, the upward momentum is weakening, as each rebound is met with stronger profit-taking pressure “ahead of” the rally than the previous one.
Whales reduce exposure, no longer absorbing selling pressure
Typically, large wallets (whales) act as absorbers of selling pressure, helping stabilize the price. However, currently, they are reducing their exposure to ADA.
Wallets holding from 10 million ADA to 100 million ADA have decreased their total holdings from 13.64 billion to 13.62 billion ADA, a reduction of about 20 million ADA since January 21. From January 22, wallets holding from 1 million ADA to 10 million ADA also decreased from 5.61 billion ADA to 5.60 billion ADA, nearly 10 million ADA less.
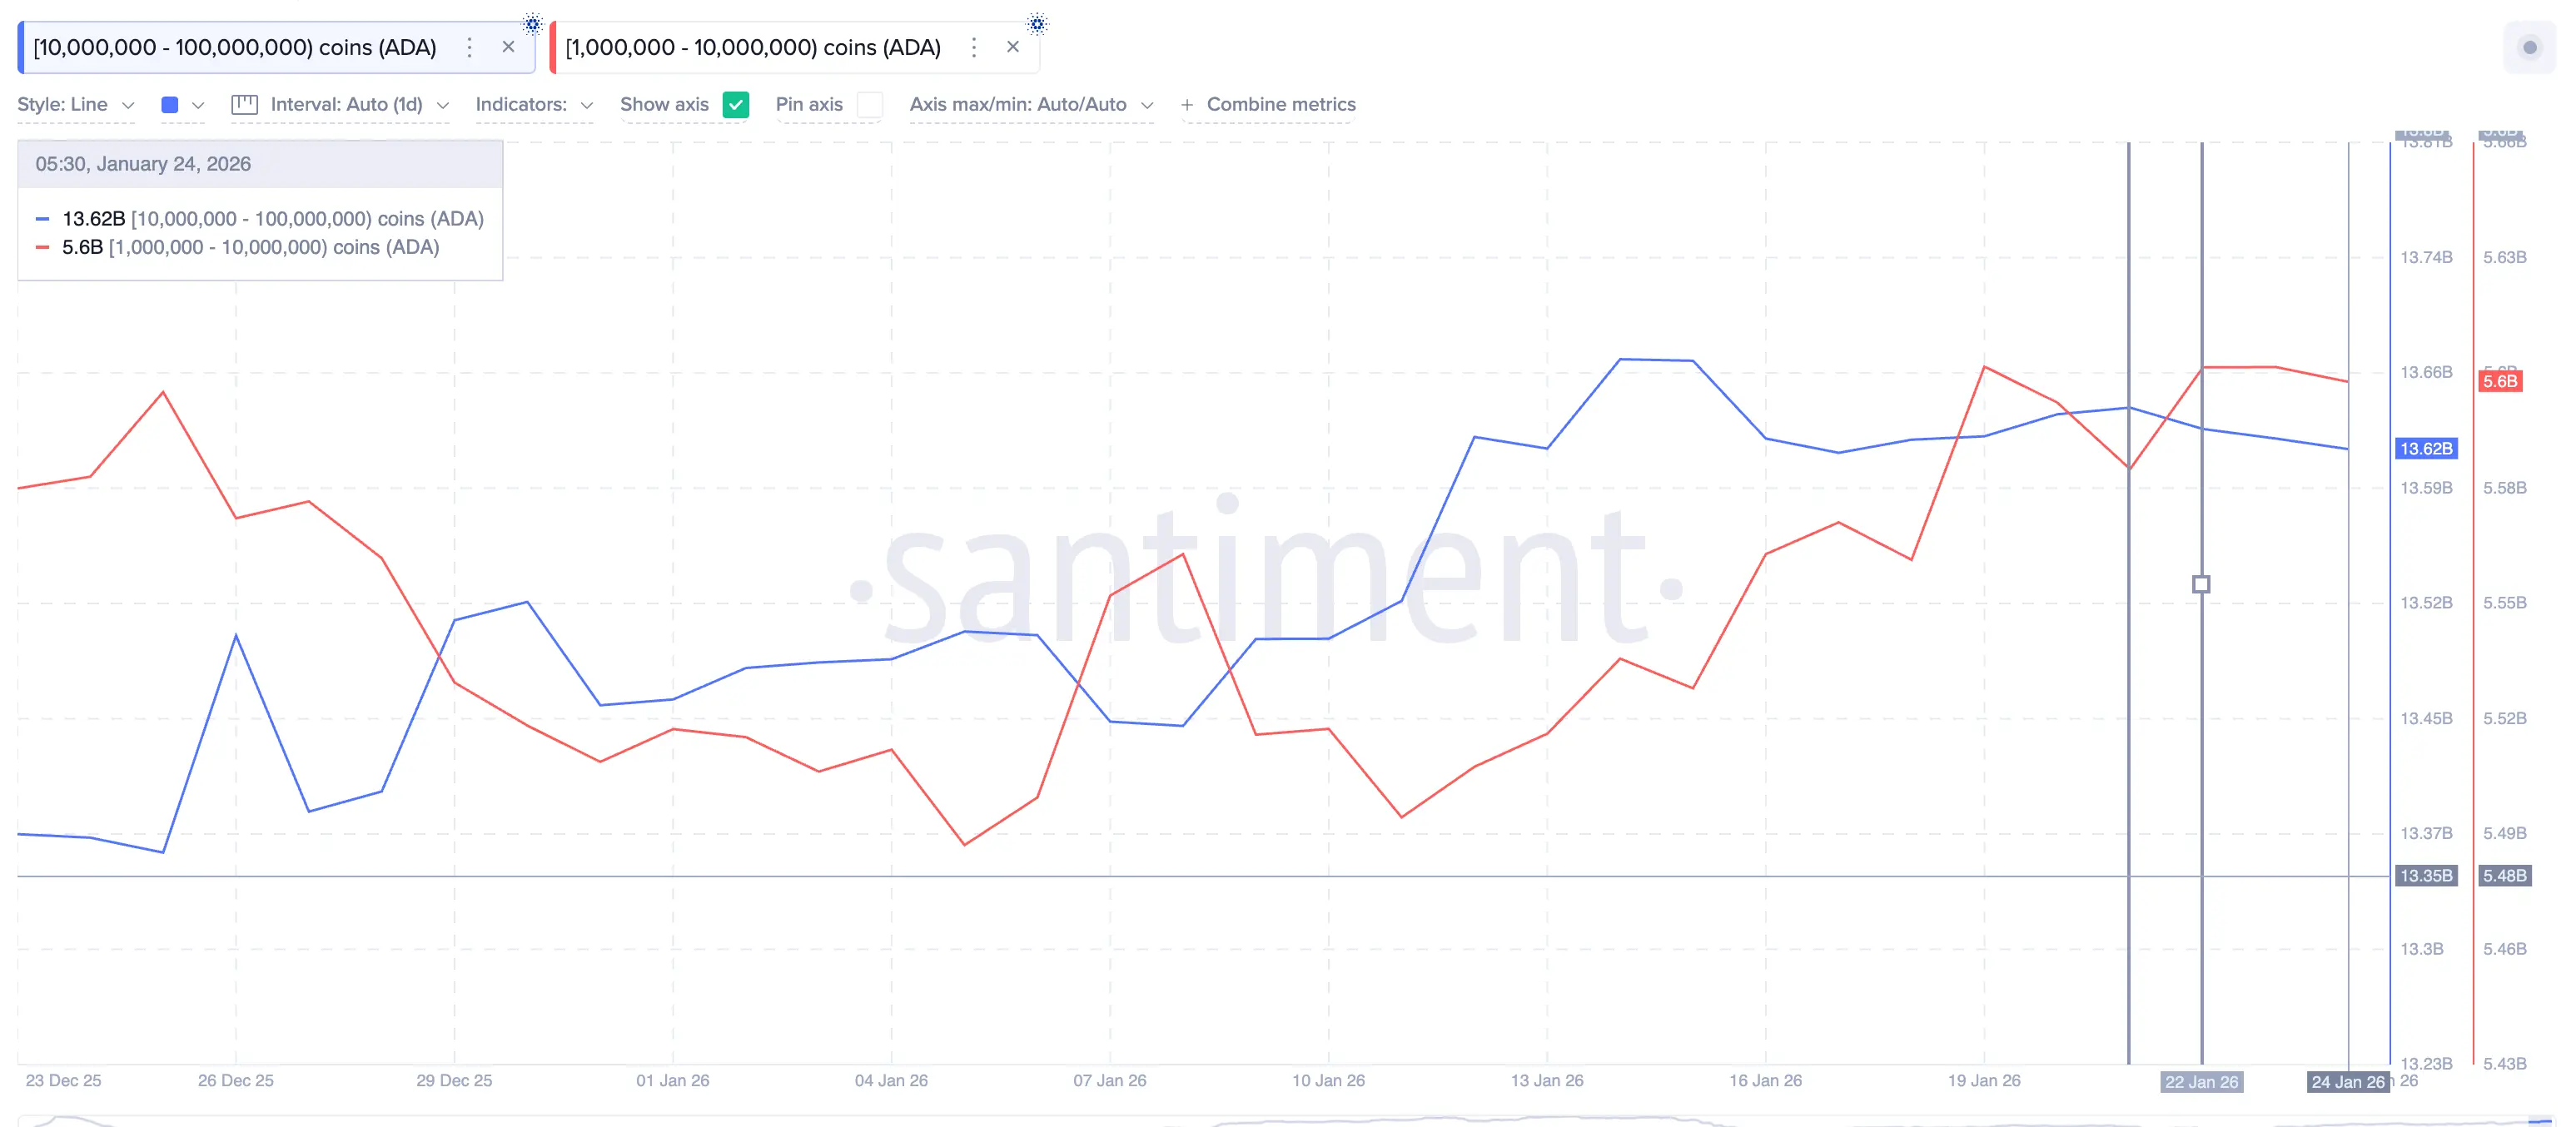 ADA whales | Source: Santiment
This isn’t panic selling, but it clearly indicates a downward trend. The lack of whale buying means selling pressure isn’t being absorbed, making the price more vulnerable to sharp corrections.
ADA whales | Source: Santiment
This isn’t panic selling, but it clearly indicates a downward trend. The lack of whale buying means selling pressure isn’t being absorbed, making the price more vulnerable to sharp corrections.
Derivatives data also supports this view. In the next 7 days, short liquidations are expected to reach $107.6 million, significantly higher than long positions at $70.1 million. Shorts exceed longs by over 50%, reflecting market sentiment expecting failed rallies rather than sustained increases.
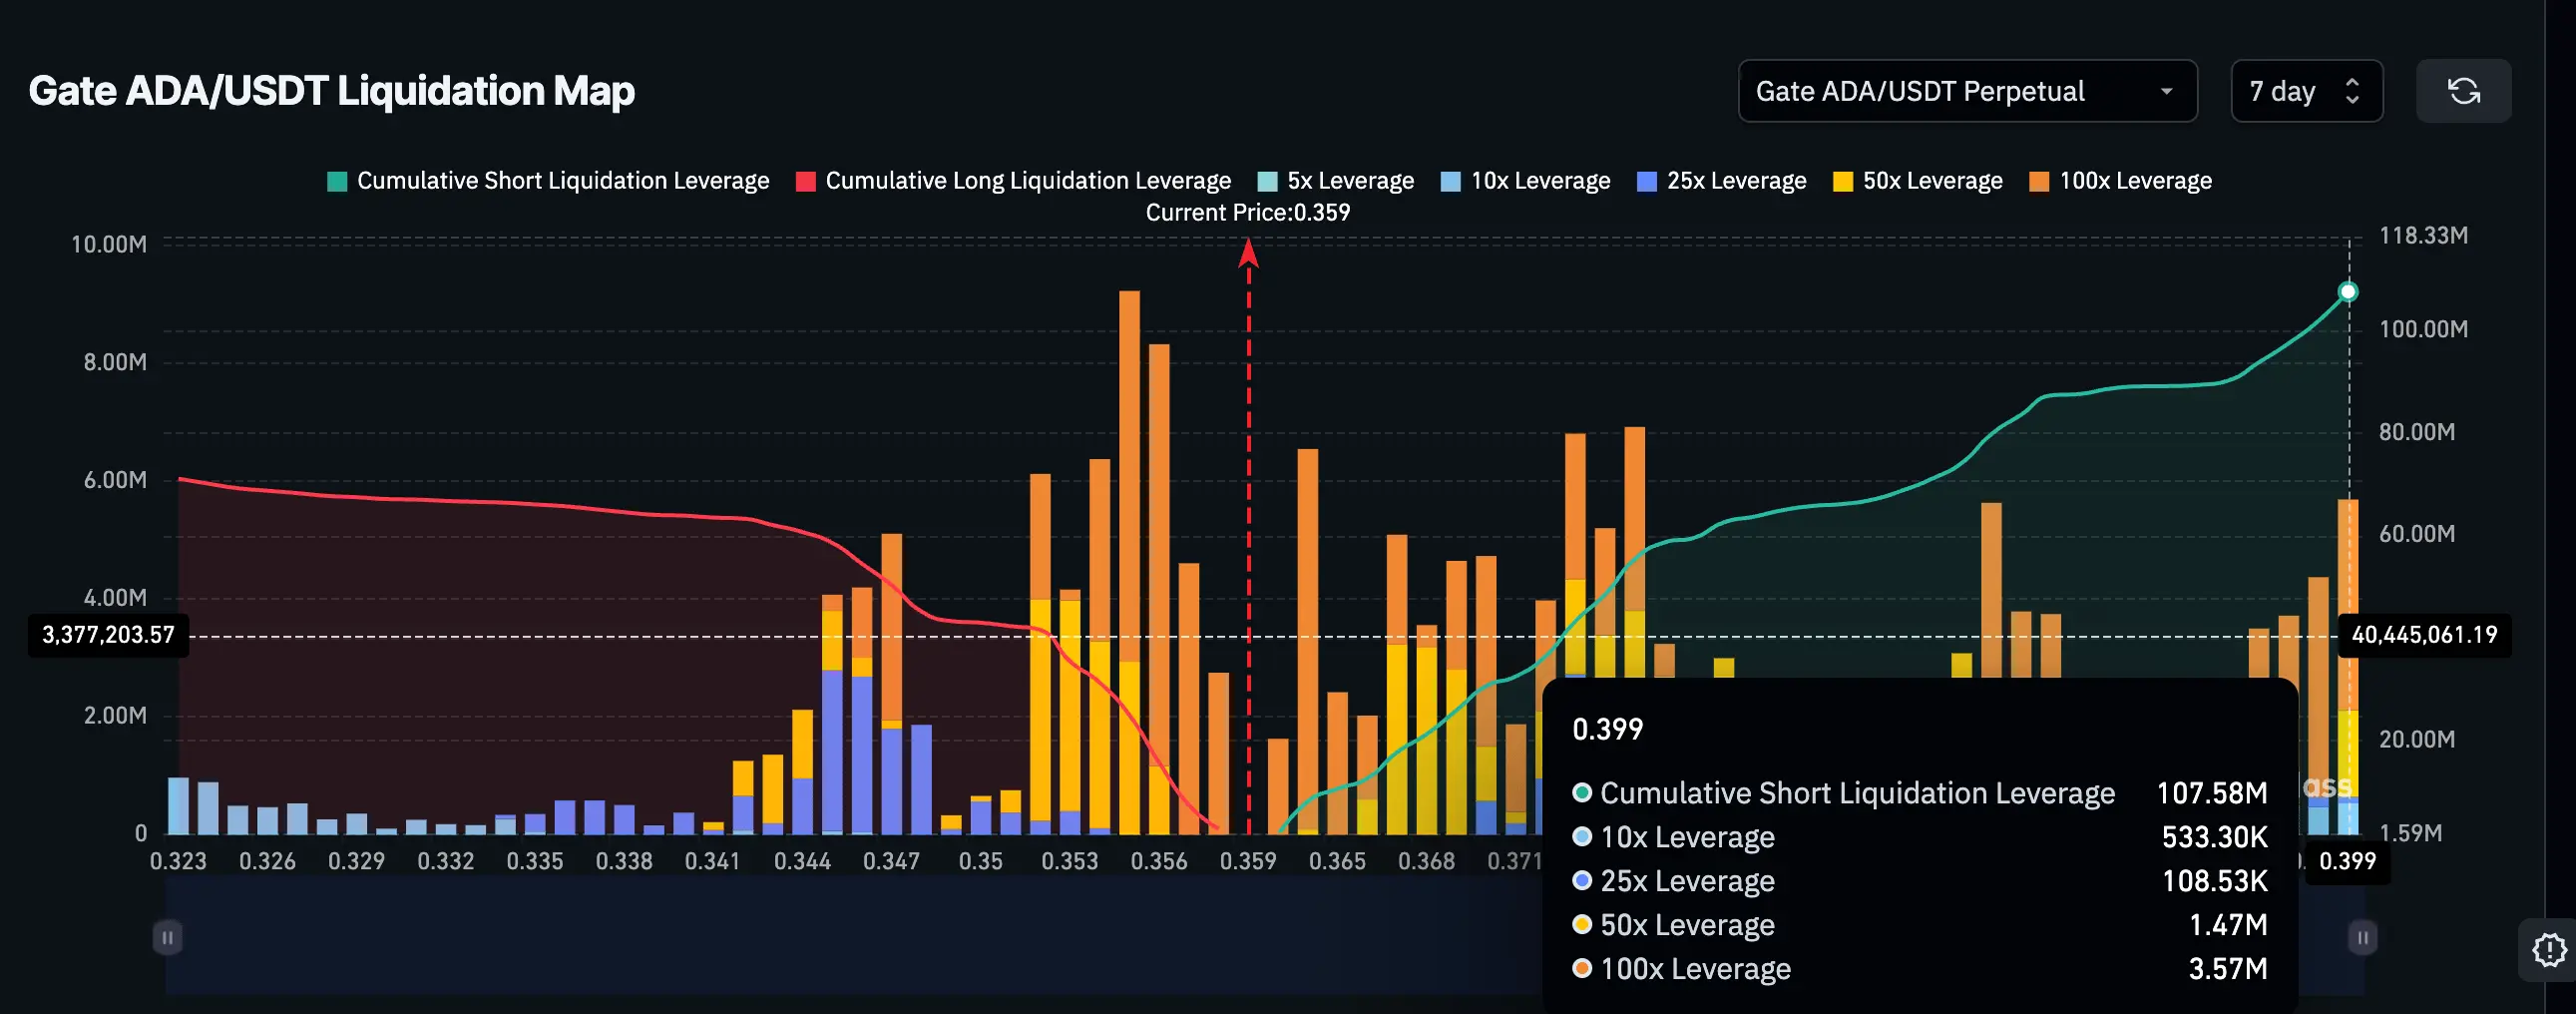 Liquidation map | Source: Coinglass
This imbalance suggests that if Cardano attempts to rally again, selling pressure could return very quickly, especially around resistance zones.
Liquidation map | Source: Coinglass
This imbalance suggests that if Cardano attempts to rally again, selling pressure could return very quickly, especially around resistance zones.
Key price levels that will determine Cardano’s next trend
The current price structure makes it easier for investors to identify key levels:
To break free from this repeating cycle, three conditions must be met: development activity must recover and stay above recent highs; coin consumption activity should slow down rather than spike during rebounds; and whales must return to net buying.
 Cardano price analysis | Source: TradingView
Until these conditions are fulfilled, Cardano’s rebounds will remain vulnerable to selling pressure.
Cardano price analysis | Source: TradingView
Until these conditions are fulfilled, Cardano’s rebounds will remain vulnerable to selling pressure.
Disclaimer: The information on this page may come from third parties and does not represent the views or opinions of Gate. The content displayed on this page is for reference only and does not constitute any financial, investment, or legal advice. Gate does not guarantee the accuracy or completeness of the information and shall not be liable for any losses arising from the use of this information. Virtual asset investments carry high risks and are subject to significant price volatility. You may lose all of your invested principal. Please fully understand the relevant risks and make prudent decisions based on your own financial situation and risk tolerance. For details, please refer to
Disclaimer.
Related Articles
VanEck Research Director: BTC derivative protective demand hits the 99th percentile historically, signaling a potential contrarian long setup
VanEck Research head Matthew Sigel said that demand for hedging in the Bitcoin derivatives market has reached the 99th percentile in history, suggesting that it may be suitable to establish long positions. At the same time, he warned that high capital expenditures in the artificial intelligence sector could put pressure on the market, especially in the S&P 500.
GateNews4m ago
Bitcoin’s ‘no direction’ action may lead to heavier breakout: Analyst
Bitcoin's prolonged consolidation below $70,000 may indicate a potential rally, despite mixed analyst sentiment. While some predict a breakout, others warn of deeper bearish trends. Current trading is stagnant, with Bitcoin at $66,890.
Cointelegraph1h ago
SHIB Consolidation Deepens With Symmetrical Triangle Taking Shape
SHIB remains inside a long descending channel, limiting upside potential for now.
A symmetrical triangle forms on lower timeframes, showing rising short-term bullish momentum.
Key resistance levels and breakout confirmation are needed for sustained upward movement.
Shiba Inu starts
CryptoNewsLand1h ago
Bitcoin ETFs will surpass Gold ETFs in scale, according to James Seyffart
James Seyffart predicts that Bitcoin spot ETFs may surpass gold ETFs in assets under management as investor demand evolves. Bitcoin is seen as a versatile investment option, while gold remains traditional. Despite recent declines, both asset classes have seen significant fund flow activity.
TapChiBitcoin3h ago
Bitcoin ETFs 'will be larger' than gold ETFs: Analyst
Spot Bitcoin exchange-traded funds (ETFs) could surpass gold ETFs in total assets under management (AUM) as investor demand expands beyond the traditional “digital gold” narrative, according to ETF analyst James Seyffart.
“There are just more use cases of why somebody would put a Bitcoin ETF in a p
Cointelegraph4h ago
Fidelity Investments: Bitcoin testing long-term support—are bullish divergences signaling a potential base being formed?
Fidelity Investments’ chief macroeconomic officer, Jurrien Timmer, analyzes Bitcoin’s price action and believes it is finding support in the $65k to $70k range, showing strong technical signals. Bitcoin is currently at relatively low levels versus the power-law support line and the Golden Ratio Z-score, which could be setting up a bullish divergence. If it can hold steady, the market may correct and rebound, but investors need to watch out for inflation and liquidity risks.
ChainNewsAbmedia5h ago
