Worldcoin (WLD), Canton (CC), and Jupiter (JUP) continue to maintain their upward momentum over the past 24 hours, despite the overall cryptocurrency market showing signs of stagnation following the Federal Reserve’s decision to keep interest rates unchanged announced on Wednesday. While Worldcoin is entering a short-term correction phase, Canton and Jupiter are approaching key resistance zones. From a technical perspective, the strongest performing assets of the day may face a reversal risk as selling pressure at resistance levels continues to increase.
Worldcoin loses momentum after 25% surge
Worldcoin (WLD) experienced a decline of about 5% on Thursday, as the price corrected back from the 100-day Exponential Moving Average (EMA) after a strong 25% breakout the previous day. The 50, 100, and 200-day EMAs remaining downward indicates that the bearish trend still dominates in the medium term.
In a negative scenario, if WLD continues to weaken and breaks below the 50-day EMA at $0.5547, selling pressure could intensify, pushing the price back to a key psychological support level around $0.5000.
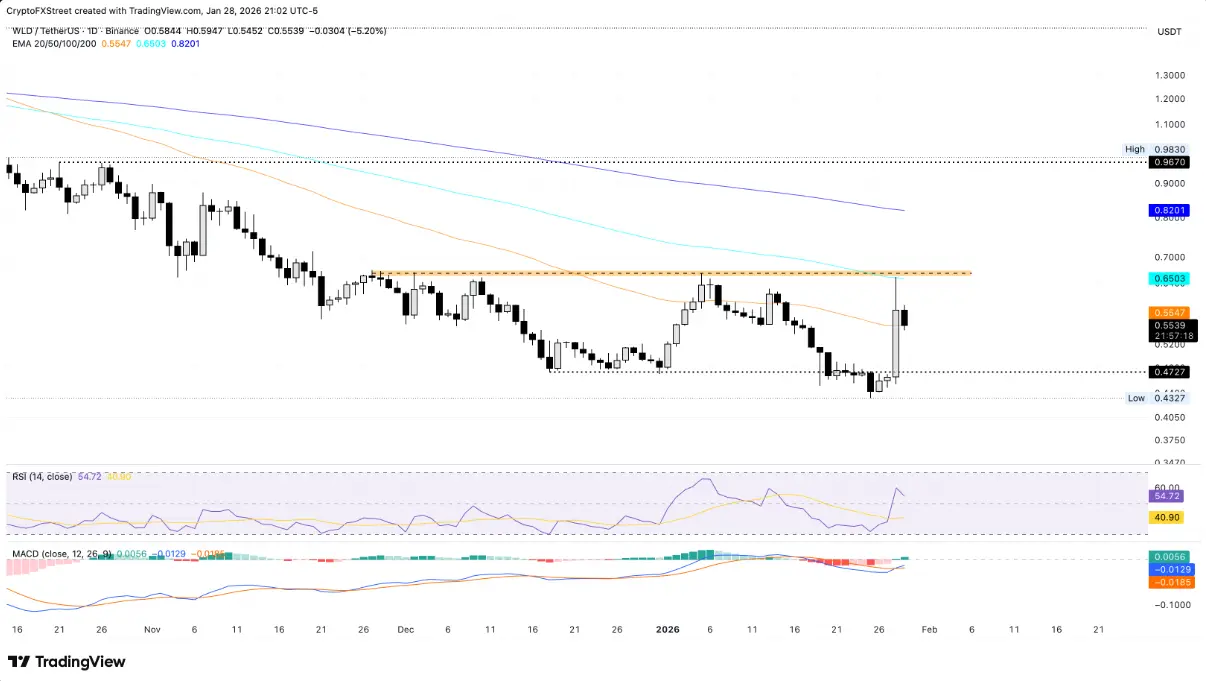 Daily WLD/USDT chart | Source: TradingViewOn the other hand, technical signals are beginning to show signs of improvement. The MACD histogram has shifted into positive territory as the MACD line crosses above the signal line near the zero mark, indicating increasing bullish momentum and the potential for an early recovery. Meanwhile, the Relative Strength Index (RSI) oscillates around 51, reflecting a neutral state and temporary market balance after recent strong volatility.
If WLD can break out and close stably above the 100-day EMA at $0.6503, the recovery momentum is likely to extend, with the next target around the 200-day EMA near $0.8201.
Canton at key resistance, aiming for upside targets
Canton is currently trading near a critical resistance zone at $0.1624, coinciding with the peak recorded on January 2nd. As of this writing, CC has risen slightly by 2% on Thursday, following a 2% increase on Wednesday, indicating stable buying pressure.
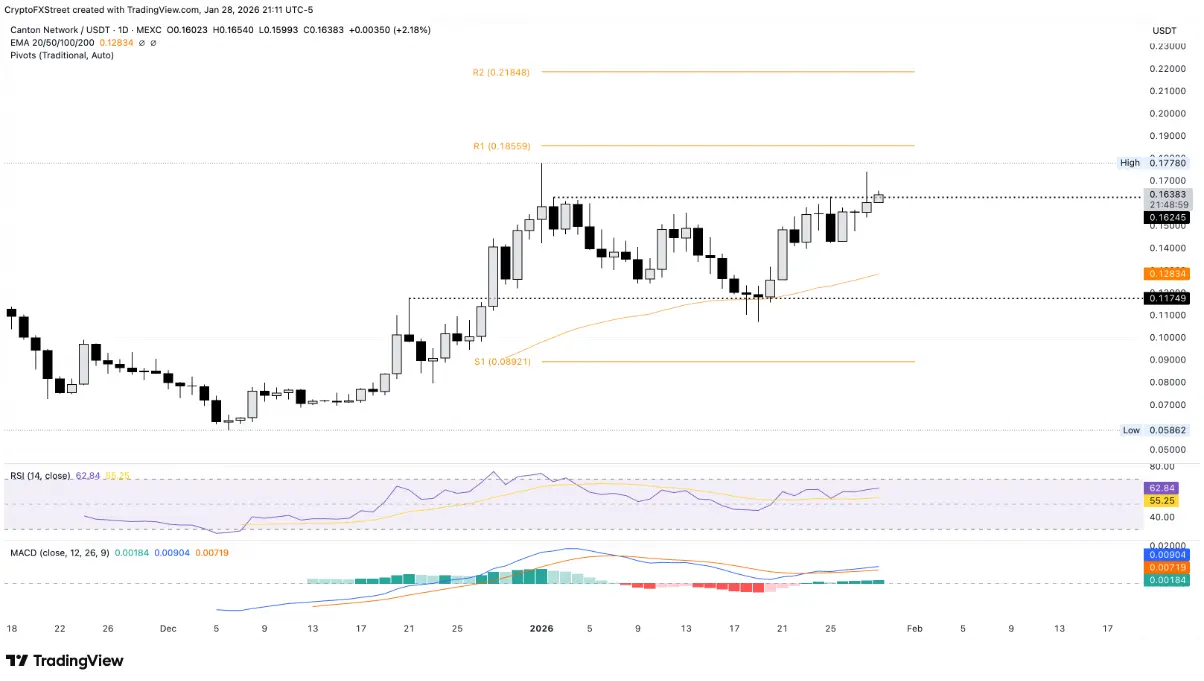 Daily CC/USDT chart | Source: TradingViewIf CC breaks above and closes convincingly above this level, the bullish trend is likely to target the R1 Pivot Point at $0.1855. The RSI remains sideways around 62, reflecting steady buying pressure and room for further gains before reaching overbought territory. Meanwhile, the MACD line and signal line continue to rise above zero, with expanding green histogram bars, confirming strong bullish momentum.
Conversely, if Canton drops below the round level of $0.1500, the 50-day EMA at $0.1283 will serve as an important support zone, helping to curb selling pressure.
Jupiter’s rally stalls at the 50-day EMA
Jupiter (JUP) is facing strong resistance at the 50-day EMA at $0.2174, after experiencing a 16% rally in the first three days of the week. As of now, JUP has declined nearly 1% on Thursday as pressure at the 50-day EMA increases.
If the current trading session closes below this level, the price could revisit the critical psychological level of $0.2000.
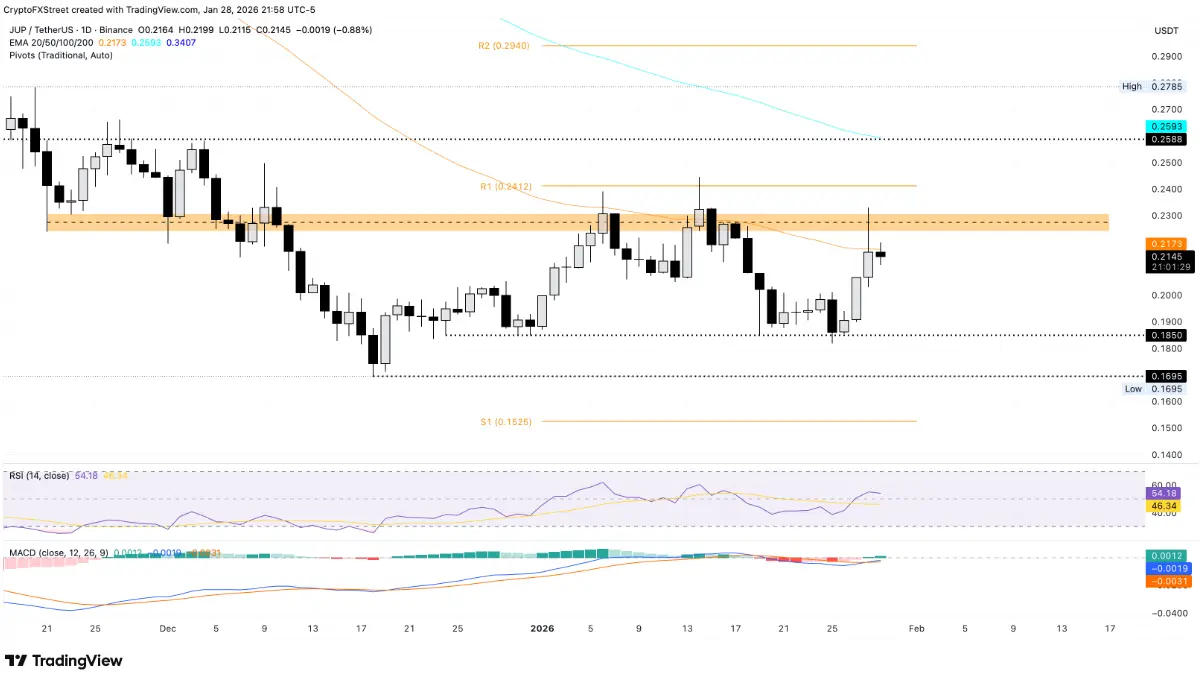 Daily JUP/USDT chart | Source: TradingViewFrom a technical standpoint, the MACD still signals a buy with a bullish crossover forming, while the RSI is at 54 and trending upward from the neutral zone, indicating that buying interest is gradually recovering after the previous rally.
If JUP breaks below the 50-day EMA, the next strong resistance zone between $0.2240 and $0.2308 could potentially control the upward movement.
Disclaimer: The information on this page may come from third parties and does not represent the views or opinions of Gate. The content displayed on this page is for reference only and does not constitute any financial, investment, or legal advice. Gate does not guarantee the accuracy or completeness of the information and shall not be liable for any losses arising from the use of this information. Virtual asset investments carry high risks and are subject to significant price volatility. You may lose all of your invested principal. Please fully understand the relevant risks and make prudent decisions based on your own financial situation and risk tolerance. For details, please refer to
Disclaimer.
Related Articles
Crypto Market Drops As Fear Index Rises and Bitcoin Falls
The global crypto market has faced a decline, with a 4% dip in total market cap to $2.44T. Bitcoin and Ethereum dropped by 4.56% and 5.85%, respectively. Despite these declines, some cryptocurrencies saw significant gains, while DeFi and NFT metrics also fell.
BlockChainReporter2h ago
Tron Reserve Fund Holds 687 Million TRX as Price Retests Key Resistance Level
Tron purchased an additional 167.999 TRX, bringing its reserve fund to 687 million TRX as the price retests key resistance levels. Despite signs of price appreciation and increased stablecoin activity, the number of active users declined amid a broader market downturn.
TapChiBitcoin2h ago
Ripple CTO: Current XRP Price May Deviate from Market Expectations, but Will Be Corrected in the Long Term
Ripple Chief Technology Officer David Schwartz stated that despite XRP's role in the payments space and rising institutional adoption, its current price of approximately $1.50 may be undervalued, noting that market participants will exploit pricing discrepancies to correct the price.
GateNews4h ago
Bitcoin Breaks Below $71,000, Peter Brandt Warns of Two-Way Movement Risk
On March 19th, Bitcoin's price fell below $71,000, declining approximately 5% within 24 hours. Ethereum, Solana, and Dogecoin all dropped 5% to 6%, with total market capitalization evaporating over $100 billion. Senior traders point out that Bitcoin exhibits both bullish and bearish technical patterns, and macroeconomic factors are affecting market sentiment, with short-term trends remaining uncertain.
GateNews4h ago
