The charts are lining up around an important moment for the ZEC price. After weeks of sideways and choppy action, Zcash is now sitting at a level that could either support a rebound or lead to another move lower.
On the lower-timeframe chart, the ZEC price is hovering around the $360–$370 area, a zone that has acted as a pivot multiple times. This is where traders are watching closely to see if a higher low can form. Holding this range keeps the recovery structure in place, while losing it would shift attention back toward lower support zones.
- Zcash Short-Term Levels That Matter Most
- The ZEC Daily Chart Shows the Bigger Picture
- What to Watch Next for the ZEC Price
Zcash Short-Term Levels That Matter Most
The 4-hour chart shared by Sjuul gives a clean roadmap. Support sits around $360–$370, which is where the ZEC price is currently trying to hold its ground. Above that, the next major hurdle comes in near $460, a level that has capped rallies in the past.
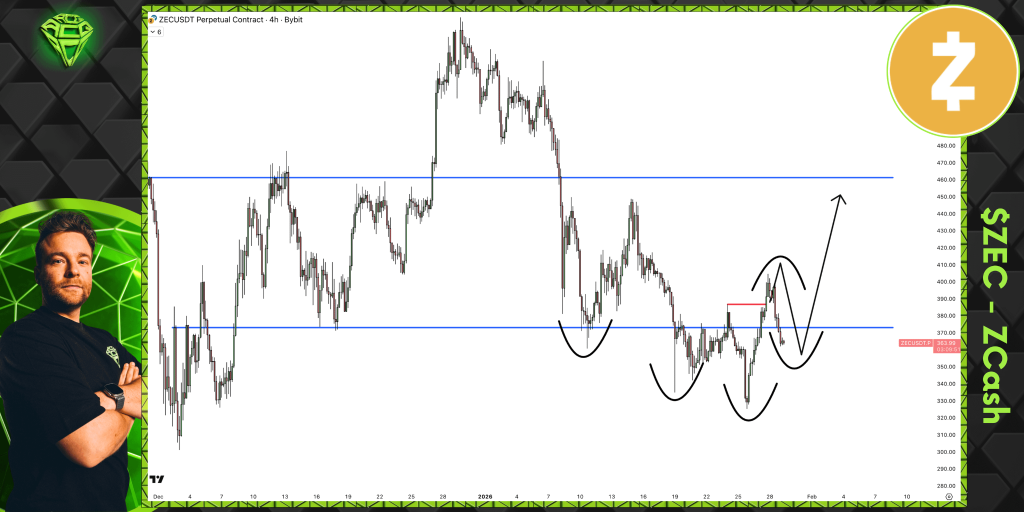
Source: X/@AltCryptoGems
There is also a clear invalidation level on the chart. A breakdown below $320 would invalidate the higher-low idea and shift the structure back toward a more bearish setup. That does not mean price is headed there, but it is the line that separates recovery from failure.
For the bullish scenario to materialize, ZEC needs to recover $370 and follow through. If so, a move to the high $300s and then testing the $460 resistance level is not entirely far-fetched.
The ZEC Daily Chart Shows the Bigger Picture
Zooming out to the daily chart shared by BitcoinCensus changes the perspective. The Zcash price has been trading within a wide bullish flag-like formation over the past months after a strong rally in the earlier stages of the cycle. The price is still trading within the flag formation. Therefore, it is likely to experience some minor corrections.
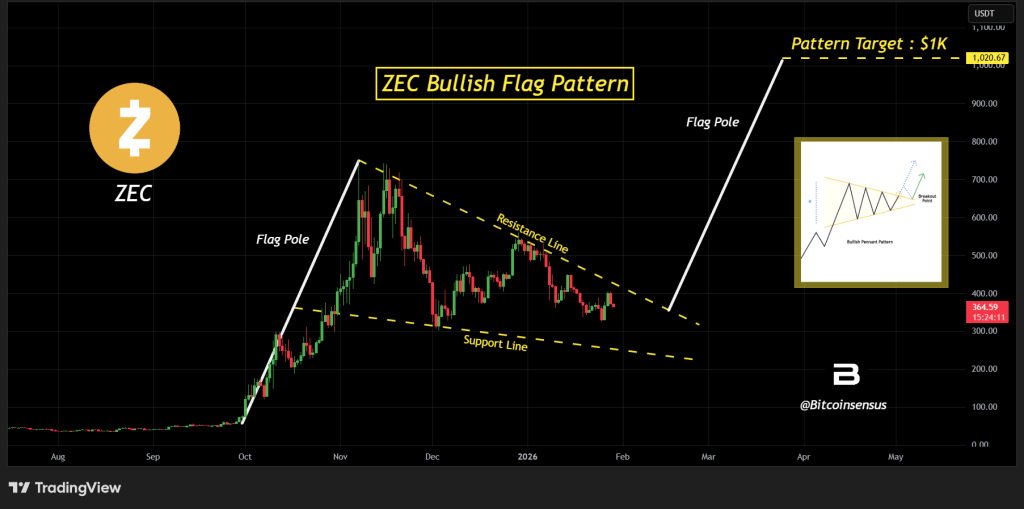
Source: X/@Bitcoinsensus
The long-term projection from this pattern points toward $1,000, but that is clearly a macro target, and not something expected in the near term.
For that scenario to even come into play, the ZEC price would need to reclaim several major resistance zones and eventually break out of the larger structure with momentum.
$KAS Price Prediction – $5,000 in Kaspa Now, How Much Could It Be Worth by 2027?_**
What to Watch Next for the ZEC Price
The big question in the short term is whether ZEC can continue to trade above the $360 to $370 level and keep the level around $320 at bay.
If that level continues to hold, the charts do indicate that ZEC could move back up towards the $400 level, perhaps facing resistance at the $460 level in the process.
Disclaimer: The information on this page may come from third parties and does not represent the views or opinions of Gate. The content displayed on this page is for reference only and does not constitute any financial, investment, or legal advice. Gate does not guarantee the accuracy or completeness of the information and shall not be liable for any losses arising from the use of this information. Virtual asset investments carry high risks and are subject to significant price volatility. You may lose all of your invested principal. Please fully understand the relevant risks and make prudent decisions based on your own financial situation and risk tolerance. For details, please refer to
Disclaimer.
Related Articles
DOGE Stabilizes At $0.09438 As TD Sequential Buy Signal Suggests Rising Accumulation Phase and Po...
Dogecoin (DOGE) shows potential for a significant rally as it flashes a TD Sequential buy signal, indicating early accumulation despite recent declines. With key support at $0.0892 and strong whale activity, a price surge to $0.18876 could be on the horizon.
BlockChainReporter29m ago
BTC Breaks Through $73,000, Mainstream CEX Cumulative Short Liquidation Intensity Reaches $834 Million
According to Coinglass data, if the Bitcoin price breaks through $73,000, it will trigger $834 million in short liquidations; if it falls below $69,000, it will trigger $940 million in long liquidations. This demonstrates the potential impact of market liquidity fluctuations.
GateNews3h ago
Ethereum Bottom In at $2,156, Says Tom Lee! Spike Soon?
Ethereum shows signs of stabilization with long-term holders increasing positions despite cautious institutional ETF outflows. This suggests a potential market bottom, though recovery may take time influenced by external factors.
Coinfomania4h ago
Quant enters important supply zone: Will QNT's 24% weekly rally slow down?
Quant (QNT) has shown strong recent performance, rising 4.91% in 24 hours and 24.14% over the week, contrasting with Bitcoin's drop. While a bullish trend is possible, signals indicate a cautious outlook, with key resistance levels to watch.
TapChiBitcoin5h ago
HODL Kings: Bitcoin Leads Diamond Hands Ranking
According to analysis shared by CEX.IO, long-term holding continues to be a defining strategy in the cryptocurrency market. The “diamond hands” metric measures the percentage of a digital asset’s supply that has remained inactive for extended periods, typically over one year. This indicator
Coinfomania5h ago
