
Hedera has quietly stayed on traders’ radars, even as the broader market has leaned bearish. The HBAR price is sitting around $0.09076 right now, and despite the pressure across altcoins, interest in Hedera hasn’t really dropped off. That’s largely because a lot has been happening around the project at the same time price has been pulling back.
Over the last few days, Hedera picked up attention as a top sub-$1 altcoin after a strong January performance, was pulled into conversations around potential institutional products, and expanded its reach through a new McLaren Racing partnership. It’s an interesting mix of strong fundamentals meeting a market that’s still clearly cautious.
- Enterprise Adoption Keeps Hedera in the Conversation
- What the HBAR Chart Is Showing Right Now
- HBAR Price Levels to Watch This Week
Enterprise Adoption Keeps Hedera in the Conversation
One thing Hedera continues to have going for it is its enterprise focus. The network’s governance model and low-cost, fast finality make it attractive for regulated use cases. Ongoing upgrades and work with large financial institutions keep that narrative alive, even during weaker market conditions.
That background helps explain why the HBAR price hasn’t completely unraveled. Selling pressure has been there, but price has spent more time stabilizing than free-falling, which stands out given how many altcoins have struggled recently.
What the HBAR Chart Is Showing Right Now
If we take a look at the 4-hour chart, we can see that HBAR is still in an overall decline, with lower highs and lower lows established. The price recently made a dip down to $0.0835 before bouncing back to $0.09076. That bounce hints at demand showing up near support.
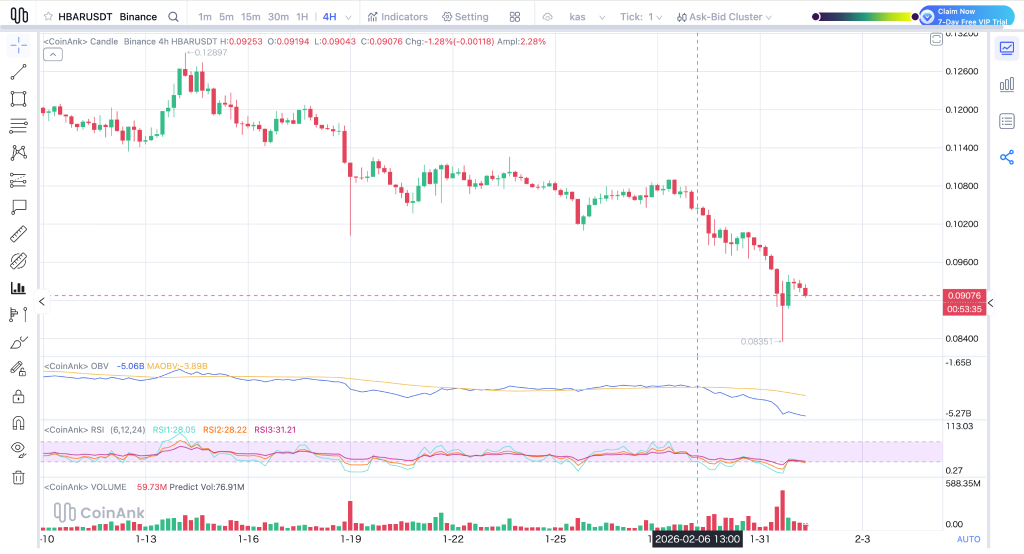
Source: CoinAnk
The current value of the RSI is around the low 30s on this chart, which means that selling pressure has been quite high. The OBV has also been declining recently.
At the same time, volume picked up during the sharp drop, which often shows sellers rushing rather than calmly unloading. Put together, the indicators indicate downside pressure may be losing pace, even if buyers haven’t fully taken control yet.
Stop Staring at the HBAR Chart: This Is Why Hedera Wins When Volatility Hits_**
HBAR Price Levels to Watch This Week
As long as HBAR trades above the $0.088–$0.090 band, the next target remains at $0.096. If HBAR manages to trade above this area, the next target will be at $0.102.
However, if HBAR manages a decent breakout, then the next targets will be at $0.108–$0.110, depending on the overall market conditions. But if HBAR trades below $0.088, then the next area of interest will be at $0.083–$0.085. A clean break below that zone brings $0.078 into view as the next area where buyers may step in.
For now, the HBAR price is in wait-and-see mode. The fundamentals keep the story alive, but the chart says this week is more about defending support and seeing if sellers finally ease off than chasing big upside moves.
Disclaimer: The information on this page may come from third parties and does not represent the views or opinions of Gate. The content displayed on this page is for reference only and does not constitute any financial, investment, or legal advice. Gate does not guarantee the accuracy or completeness of the information and shall not be liable for any losses arising from the use of this information. Virtual asset investments carry high risks and are subject to significant price volatility. You may lose all of your invested principal. Please fully understand the relevant risks and make prudent decisions based on your own financial situation and risk tolerance. For details, please refer to
Disclaimer.
Related Articles
XRP Eyes $3 As Bollinger Band Squeezes, Setting Stage for Massive 217% Price Spike
In the volatile cryptocurrency landscape, the XRP coin is drawing investor interest for its ability to spur liquidity-driven moves. Today, market analyst Ali Martinez examined the latest chart trajectory of XRP and disclosed a Bollinger Band squeeze that suggests that the market is building for a
BlockChainReporter9m ago
PEPE Stalls at $0.053354 While Oscillators Drift Below 40 Inside Tight Trading Band
PEPE fell to 2.4 per cent to trade at a price of $0.053354 but above the level of support in the vicinity of $0.053325.
Momentum indicators are tight and oscillator values are close to 39.47 and 36.73 and MACD is close to zero line.
The intra-day range of $0.053325 to $0.053473 is still r
CryptoNewsLand35m ago
'Black Swan' Author Nassim Taleb Believes Elon Musk's X Money is 'Much Smarter' Than Bitcoin - U.Today
Elon Musk's X Money will enter early access in April, with Nassim Taleb praising it as a superior alternative to Bitcoin. He argues it promotes competition in currency issuance, functional daily use, and is backed by a robust infrastructure, unlike volatile cryptocurrencies.
UToday1h ago
ETH 15-minute decline of 0.80%: On-chain large fund flows and DEX selling pressure resonate to trigger a downtrend
2026-03-11 15:00 to 2026-03-11 15:15 (UTC), ETH price briefly and rapidly declined within the range of 2042.35 to 2065.57 USDT, with a K-line return of -0.80% and an amplitude of 1.13%. Market volatility intensified during this period, with significantly increased attention, and short-term market pressure triggered market alertness.
The main driving force behind this anomaly is large-scale on-chain fund flows and sell pressure concentrated on decentralized exchanges (DEX). Monitoring data shows multiple large ETH transfers to trading platforms, suspected to involve institutions or whales.
GateNews1h ago
XRP Price Hints at Bullish Reversal as Negative Funding Rates Build Pressure on Short Sellers
XRP shows potential for a bullish reversal as market indicators align, with negative funding rates possibly triggering a short squeeze. Technical patterns and whale accumulation further support an upward move, indicating a significant price change may be imminent.
CryptometerIo2h ago
Shiba Inu (SHIB) regains momentum as buying pressure reaches the highest level of the month
The price of Shiba Inu (SHIB) is fluctuating around the 0.0000056 USD mark at the time of writing on Wednesday, after rising nearly 7% over the past two days. This recovery trend appears as on-chain indicators and derivatives market data begin to send positive signals. Trading volume is increasing.
TapChiBitcoin3h ago