
Key Takeaways
-
ZEC is holding a major support zone between $300–$335 after a 30% monthly correction.
-
A descending triangle pattern is forming on the daily chart.
-
A breakout above $411 could signal the start of a renewed bullish move.
Zcash (ZEC) is showing early signs of stabilization after a sharp corrective phase. As of January 26, 2026, ZEC is trading near the $360 level, posting a 4% gain over the past 24 hours. This bounce comes after a steep 30% decline over the last month, which followed ZEC’s explosive 2025 rally, where the privacy-focused cryptocurrency surged more than 800% at its peak, reaching levels near $750.
While broader market conditions remain volatile, ZEC’s latest price action suggests that the asset may be approaching a decisive moment — one that could determine whether bulls regain control or bears extend the correction.
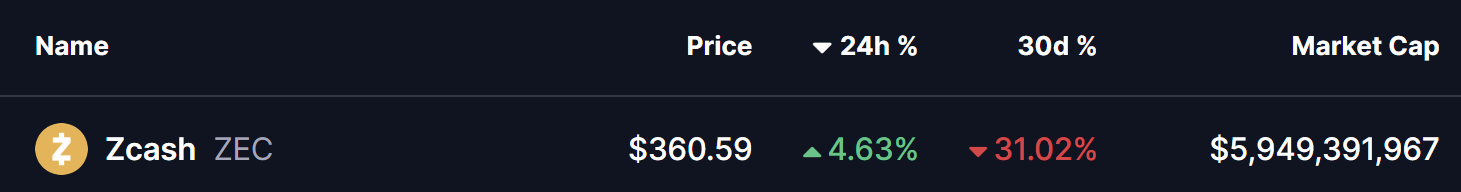
Source: Coinmarketcap
Descending Triangle Takes Shape on the Daily Chart
From a technical perspective, Zcash’s daily chart reveals a well-defined descending triangle pattern, a structure that typically forms after a strong uptrend and often precedes a major directional move.
This pattern is characterized by two key elements:
-
A horizontal support zone between $300 and $335, which has consistently attracted buyers during recent pullbacks.
-
A sequence of lower highs, creating a downward-sloping resistance line originating from the 2025 peak near $750.
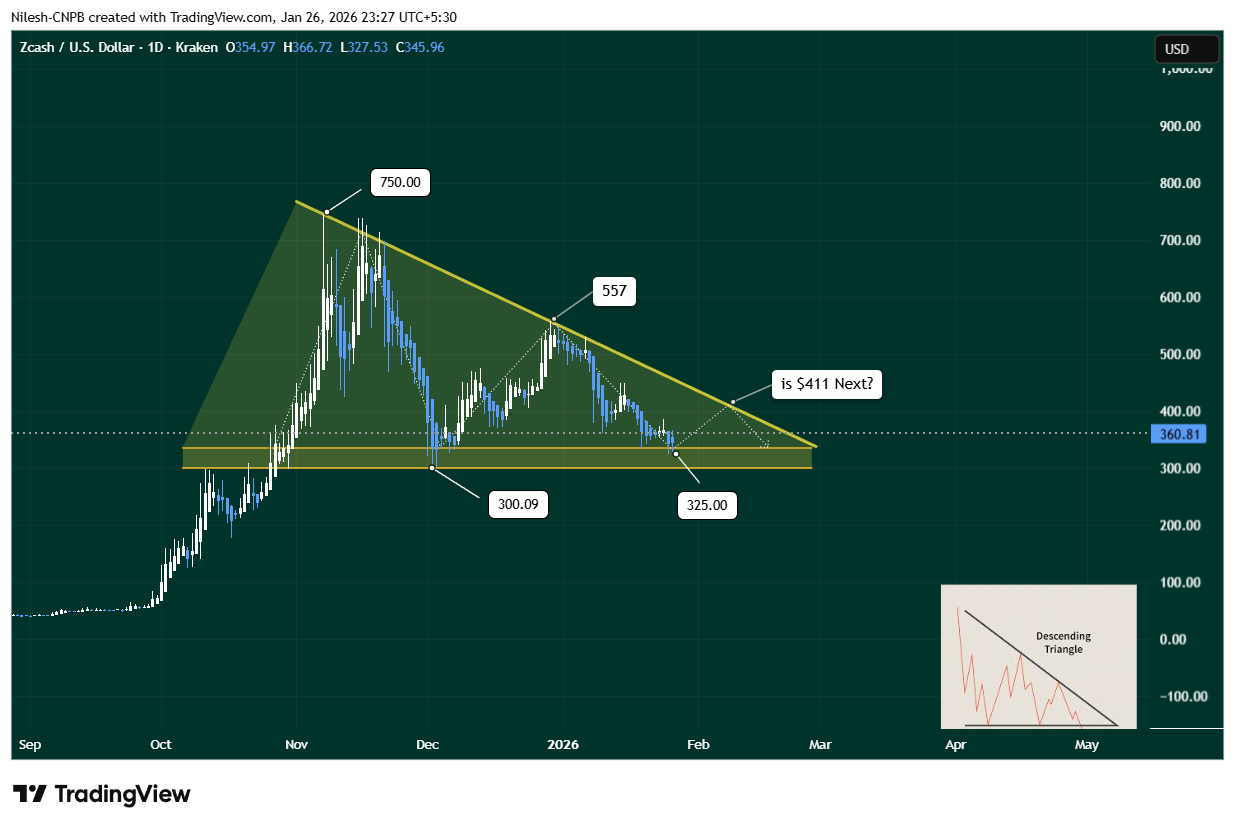
Zcash (ZEC) Daily Chart/Coinsprobe (Source: Tradingview)
During the most recent leg of the correction, ZEC dipped into the lower boundary of this support zone, finding demand near $325. Buyers stepped in aggressively at this level, triggering a rebound that lifted price back toward the $360 area. This reaction suggests that bulls are actively defending the structure and are not yet willing to concede control.
The repeated defense of the $300–$335 region highlights its importance as a critical accumulation zone. As long as ZEC continues to trade above this range, the broader technical structure remains intact.
What’s Next for ZEC?
Looking ahead, If ZEC continues to sustain above the support trendline, the next logical move would be a retest of the descending resistance near $411.
-
Bullish Scenario:
If ZEC holds above support and breaks above the $411 resistance with strong volume, it could invalidate the bearish implications of the descending triangle and mark the beginning of a new bullish expansion phase.
-
Bearish Scenario:
Failure to break resistance — or a loss of the $300–$335 support zone — could send ZEC back into consolidation or trigger another retest of lower demand levels before a clear trend emerges.
Final Outlook
Zcash is currently at a technical inflection point. The combination of strong historical support, a tightening price structure, and an early rebound off key demand levels suggests that a larger move may be approaching. Whether that move resolves higher toward $411 or lower back into support will depend on how price reacts as the descending triangle nears its apex.
For now, $325 support and $411 resistance remain the two most important levels to monitor.
Disclaimer: The views and analysis presented in this article are for informational purposes only and reflect the author’s perspective, not financial advice. Technical patterns and indicators discussed are subject to market volatility and may or may not yield the anticipated results. Investors are advised to exercise caution, conduct independent research, and make decisions aligned with their individual risk tolerance.
About Author: Nilesh Hembade is the Founder and Lead Author of Coinsprobe, with over 5 years of experience in the cryptocurrency and blockchain industry. Since launching Coinsprobe in 2023, he has been providing daily, research-driven insights through in-depth market analysis, on-chain data, and technical research.
Disclaimer: The information on this page may come from third parties and does not represent the views or opinions of Gate. The content displayed on this page is for reference only and does not constitute any financial, investment, or legal advice. Gate does not guarantee the accuracy or completeness of the information and shall not be liable for any losses arising from the use of this information. Virtual asset investments carry high risks and are subject to significant price volatility. You may lose all of your invested principal. Please fully understand the relevant risks and make prudent decisions based on your own financial situation and risk tolerance. For details, please refer to
Disclaimer.
Related Articles
BTC Breaks Through $73,000, Mainstream CEX Cumulative Short Liquidation Intensity Reaches $834 Million
According to Coinglass data, if the Bitcoin price breaks through $73,000, it will trigger $834 million in short liquidations; if it falls below $69,000, it will trigger $940 million in long liquidations. This demonstrates the potential impact of market liquidity fluctuations.
GateNews2h ago
Ethereum Bottom In at $2,156, Says Tom Lee! Spike Soon?
Ethereum shows signs of stabilization with long-term holders increasing positions despite cautious institutional ETF outflows. This suggests a potential market bottom, though recovery may take time influenced by external factors.
Coinfomania3h ago
Quant enters important supply zone: Will QNT's 24% weekly rally slow down?
Quant (QNT) has shown strong recent performance, rising 4.91% in 24 hours and 24.14% over the week, contrasting with Bitcoin's drop. While a bullish trend is possible, signals indicate a cautious outlook, with key resistance levels to watch.
TapChiBitcoin4h ago
HODL Kings: Bitcoin Leads Diamond Hands Ranking
According to analysis shared by CEX.IO, long-term holding continues to be a defining strategy in the cryptocurrency market. The “diamond hands” metric measures the percentage of a digital asset’s supply that has remained inactive for extended periods, typically over one year. This indicator
Coinfomania4h ago
BNB Chain leads the AI sector with 39.9% market share, so why is the price still falling?
BNB Chain is emerging as a leader in the AI agent ecosystem, holding 39.9% market share. However, its token BNB's price has not reflected this growth, remaining 25.9% below its previous peak, as market sentiment remains cautious.
TapChiBitcoin7h ago
