The price of Zcash (ZEC) continues to face strong selling pressure as it repeatedly sets lower highs and lower lows, while the resistance trendline remains the main barrier to any recovery efforts.
Currently, ZEC is trading around $205 after breaking below the important support level of $300, which has now become a new resistance zone. With the downward momentum weakening, the sellers have pushed the price close to the support zone of $200, seen as a short-term downside target.
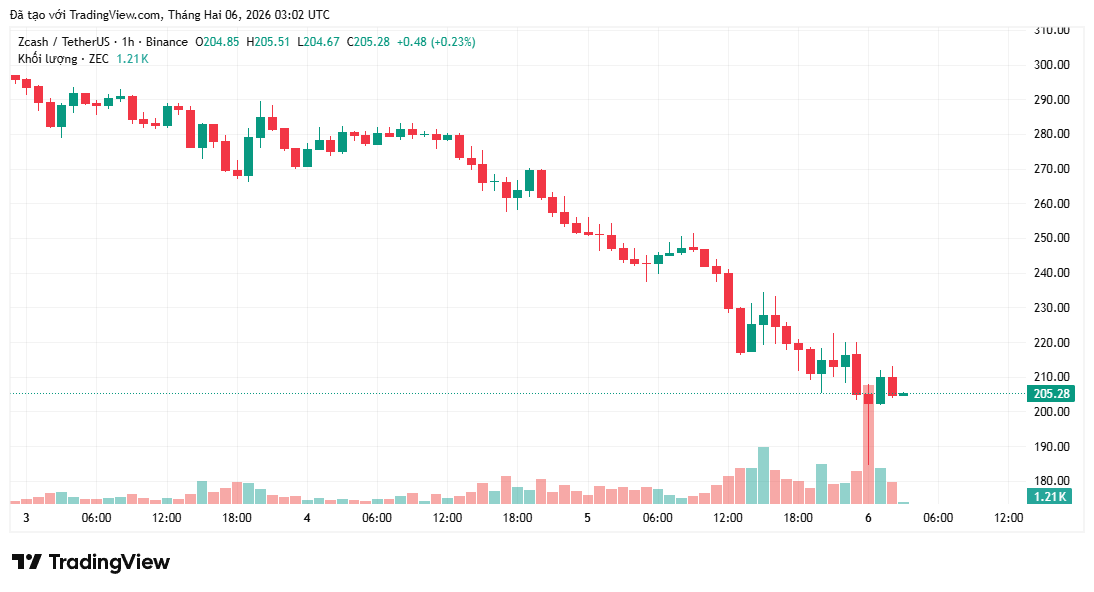 ZEC Price Chart | Source: CoinphotonIf this support zone cannot hold, the downside risk could extend to the psychological area of $200–$210, where stronger buying interest is expected to emerge.
Resistance and Support Outlook
On the upside, the current resistance zone lies between $260–$280, with the $300 level serving as a key structural barrier to establish a sustainable recovery. However, although signals such as MACD compression and prolonged price conditions suggest the market may be oversold, any rebound will require strong support from trading volume and positive macro factors.
Without the necessary support, short-term rallies are likely to quickly weaken and be overtaken by increasing selling pressure.
Beyond technical factors, ZEC still faces significant challenges from external influences. Tight regulation scrutiny and competition from newer security solutions continue to exert pressure on market sentiment.
The bears maintain control below the $300 level, and if the $240 level is broken, ZEC risks a deeper decline toward the $200 zone.
Recovery of Demand Above $240 After Sharp Decline
In the short term, Zcash completed a sharp decline from $270 down to the demand zone of $238–$240. Here, the downward momentum gradually stalled as buying interest began to reappear. This price zone reflects previous accumulation, driven by quick-reacting investors and short-term traders who absorbed selling pressure at similar levels before.
As the price returned to this zone, similar investors quickly re-entered, creating an important support level. At the bottom, strong buying interest emerged, forming a hammer candlestick with a long lower shadow, indicating a clear rejection of prices below $240.
This rejection shifted the short-term order flow, helping the price stabilize and avoid further sharp declines. Two consecutive green candles then appeared, forming a higher low around $244–$246, reinforcing the initial recovery signal.
Meanwhile, the RSI indicator oscillates near the oversold zone, reflecting deep correction conditions rather than a new downtrend extension. The slight increase in this indicator suggests selling momentum is beginning to weaken.
Maintaining above the psychological $240 level indicates strong buying demand as selling pressure has significantly decreased. The recovery could target the resistance zone of $260–$280, while a break below $240 might accelerate the decline toward $210.
Although the overall trend remains bearish, the reaction zone around $240 highlights a compression of downward pressure, as the market gradually reestablishes its position and prepares for new developments.
Mr. Teacher
Disclaimer: The information on this page may come from third parties and does not represent the views or opinions of Gate. The content displayed on this page is for reference only and does not constitute any financial, investment, or legal advice. Gate does not guarantee the accuracy or completeness of the information and shall not be liable for any losses arising from the use of this information. Virtual asset investments carry high risks and are subject to significant price volatility. You may lose all of your invested principal. Please fully understand the relevant risks and make prudent decisions based on your own financial situation and risk tolerance. For details, please refer to
Disclaimer.