Bitcoin trades within a narrow range, temporarily around $69,000, with ETF inflows totaling $516 million, but still not fully offsetting the $2.2 billion outflow. Deribit’s put/call ratio spiked to 3.1 before retreating to 1.7. Silver plunged 45%, triggering a chain of liquidations. Bitcoin remains trapped in a downtrend, needing to break above $72,000. Wednesday’s non-farm payrolls are expected to increase by 70,000, with market sentiment remaining cautious.
ETF Inflows of $516 Million Cannot Fully Cover $2.2 Billion Outflows
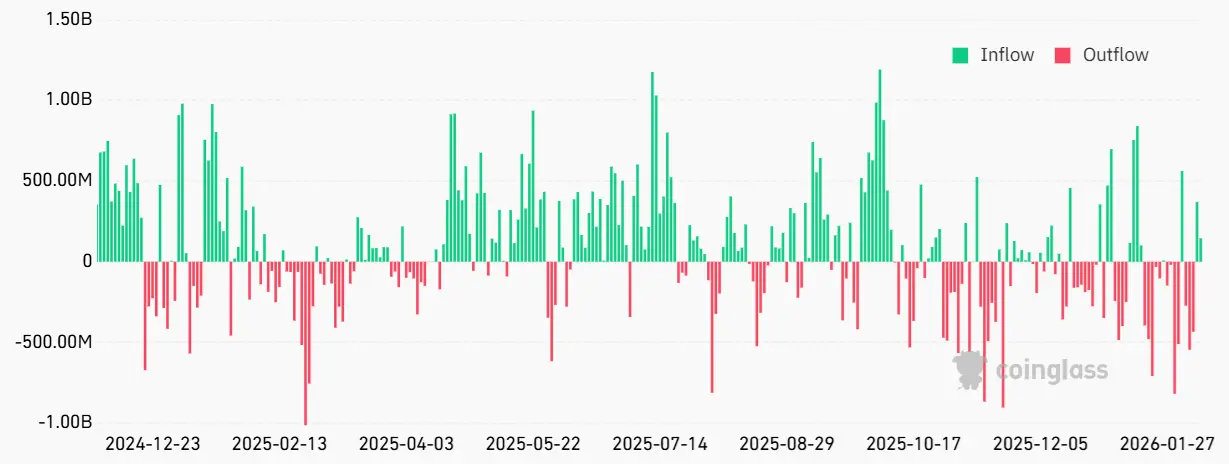
(Source: Coinglass)
Despite recent price weakness, demand for spot Bitcoin ETFs indicates that institutions have not fully turned bearish. Since last Friday, US-listed Bitcoin ETFs have seen a net inflow of $516 million, reversing the decline over the previous three trading days. As a result, the $2.2 billion net outflow from January 27 to February 5 appears to have diminished.
However, the key reason for Bitcoin’s stalled rebound is that the $516 million inflow is still insufficient relative to the $2.2 billion outflow. This recovers only about 23% of the outflow, leaving roughly $1.7 billion in net outflows still unrecouped. This “more out than in” asymmetry suggests that while panic selling has subsided, institutions remain hesitant to rebuild positions, mostly observing.
If ETF capital flows are viewed as a thermometer of institutional sentiment, the current reading is “from extreme cold to mild cold,” not “warming.” To truly reverse the trend, sustained weekly net inflows of $10-20 billion are needed to fully offset previous outflows and generate new upward momentum. At the current weekly inflow rate of around $500 million, the market can only maintain stability, not push through significant resistance.
A previous mainstream view attributed the $2.2 billion outflow to an Asian fund leveraging cheap yen, leading to ETF options trading failures. Franklin Bi, general partner at Pantera Capital, suspects a non-crypto-native trading firm may be the culprit. He notes that broader cross-asset margin liquidations coincided with a sharp correction in metals prices. For example, silver plummeted 45% in the week ending February 5, wiping out two months of gains.
Three Major Capital-Related Reasons for Bitcoin’s Rebound Stall
Insufficient ETF inflows: $516 million only recovers 23% of $2.2 billion outflow, weak buying pressure
Cross-asset liquidations: Silver’s 45% crash triggered chain reactions, forcing about $1 billion in forced liquidations
Low leverage demand: Derivatives market’s bullish appetite has sharply declined, lacking major drivers
This chain of cross-asset liquidations is a hidden killer in the current market. When a large institution is forced to meet margin calls due to a sharp drop in silver or other assets, it may be compelled to sell all holdings, including Bitcoin ETFs, to raise cash. This “forced selling” manifests as ETF outflows in data but is fundamentally a liquidity crisis rather than a loss of confidence in Bitcoin. Once the crisis subsides, these funds are expected to flow back, though timing remains uncertain.
Options Market’s Defensive Positioning at a 3.1 Put/Call Ratio
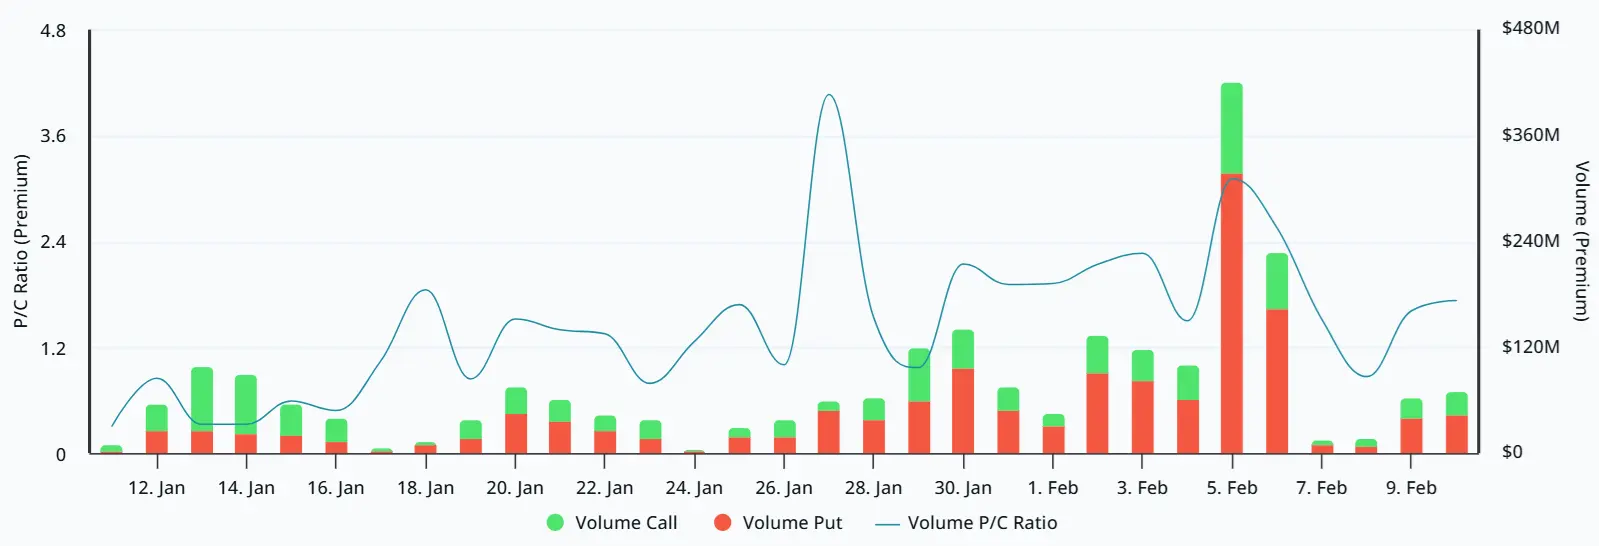
(Source: Laevitas)
The Bitcoin options market shows similar signs, with Thursday seeing a surge in neutral to bearish trading volume. Traders are not expecting worsening conditions but are adjusting strategies after Bitcoin drops below $72,000. On Thursday, Deribit’s put/call ratio soared to 3.1, indicating a strong bias toward bearish (sell) options, before retreating to 1.7.
A put/call ratio of 3.1 means trading volume in puts is 3.1 times that of calls, representing an extreme defensive stance. When traders buy大量 puts, it’s usually for hedging downside risk rather than outright betting on a crash. This behavior signals a lack of confidence in the sustainability of the current rebound, with traders preferring to pay premiums for protection.
The subsequent decline to 1.7 suggests a slight easing of panic but remains above neutral levels (~1.0). Overall, demand for long positions in Bitcoin derivatives has been subdued over the past two weeks. Despite deteriorating market sentiment, the lower leverage levels create healthier conditions for a sustainable rally once optimism returns. This is the “silver lining” after a plunge: markets have de-leveraged sufficiently to prevent large-scale liquidations on minor gains, potentially leading to a higher-quality rebound.
It remains unclear what factors could restore investor confidence in Bitcoin, as its core values—such as censorship resistance and strict monetary policy—remain unchanged. Weak demand in derivatives does not necessarily indicate a lack of confidence; rather, it reflects heightened uncertainty.
Non-Farm Payrolls and the $72,000 Technical Breakpoint: Double Tests
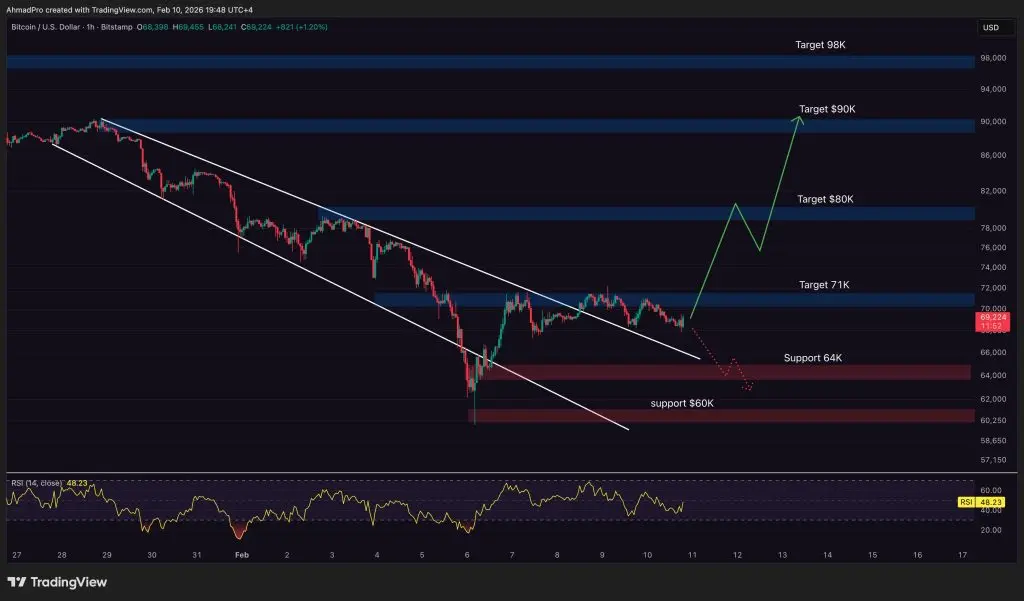
(Source: TradingView)
Traders are closely watching the non-farm payroll report due Wednesday, February 11. The US is expected to add 70,000 jobs in January, significantly higher than December’s 50,000. The unemployment rate is forecasted to stay at 4.4%. ING notes: “The market’s average expectation is around 70,000 new jobs in January, but markets will be more sensitive to weaker-than-expected results.”
Although the dollar was flat Tuesday, concerns remain that Wednesday’s data could disappoint. Former White House Council of Economic Advisers Chair Hassett said that a lower-than-expected jobs number should not cause panic. This “preemptive reassurance” has instead heightened worries that the data might be worse. Ahead of the report, most traders are on the sidelines rather than building new positions, which is a key reason for Bitcoin’s stalled rebound.
Charts show Bitcoin trapped in a downtrend. The current attempt to push toward $69,000–$71,000 appears more like a test of resistance rather than a strong rally. If it fails here, prices could fall back to $64,000 or even $60,000. Bitcoin needs a decisive close above $72,000 to confirm that this is not just a rebound and to lay the groundwork for a new rally toward all-time highs.
Disclaimer: The information on this page may come from third parties and does not represent the views or opinions of Gate. The content displayed on this page is for reference only and does not constitute any financial, investment, or legal advice. Gate does not guarantee the accuracy or completeness of the information and shall not be liable for any losses arising from the use of this information. Virtual asset investments carry high risks and are subject to significant price volatility. You may lose all of your invested principal. Please fully understand the relevant risks and make prudent decisions based on your own financial situation and risk tolerance. For details, please refer to
Disclaimer.
