Price predictions for top Layer 2s: Mantle, Arbitrum, Optimism
Layer 2 networks have become the focus of attention over the past week after Ethereum adjusted its development roadmap to prioritize rollups, while also facing candid assessments from co-founder Vitalik Buterin.
These developments quickly sparked lively debates among many Layer 2 founders and the community, amid a broader cryptocurrency market downturn. Increased selling pressure has caused many Layer 2 tokens to fall to new record lows.
Mantle aims to surpass $0.68
Mantle (MNT) is entering a consolidation phase after a strong rebound from the $0.51 bottom recorded last Friday, as it attempts to reclaim the important resistance level of $0.68. If it successfully breaks through this threshold, the Layer 2 token could extend its rally toward the target zone of $0.84.
However, MNT’s upward prospects remain under significant pressure as the 20-day exponential moving average (EMA) continues to act as a key barrier—a resistance level that has repeatedly hindered the recovery since December last year.
Conversely, in the event of a rejection at $0.68, MNT is likely to retreat and test the support zone around $0.51.
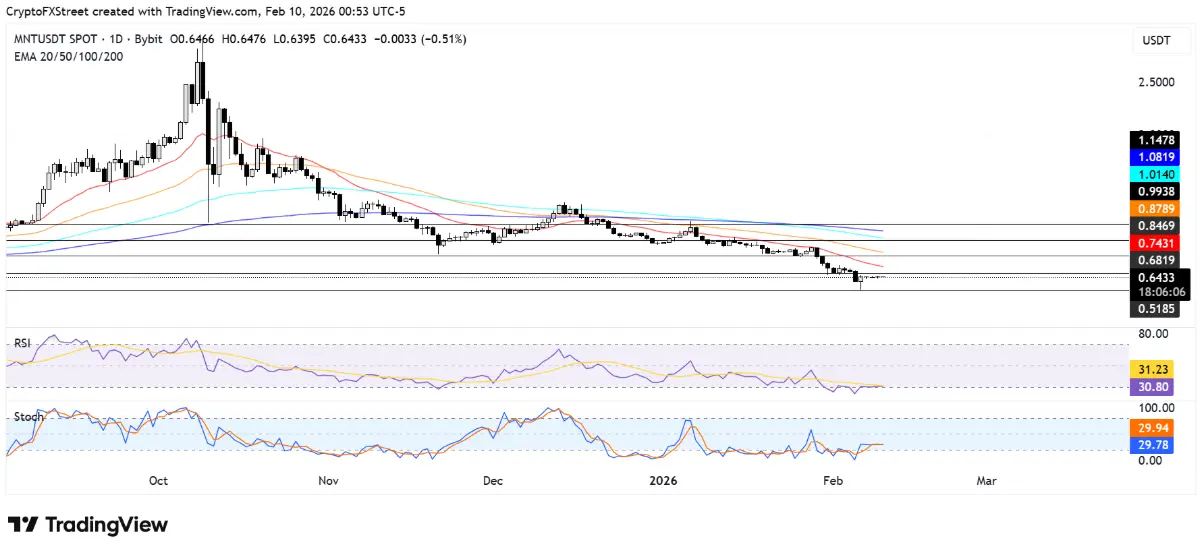 Daily MNT/USDT chart | Source: TradingView Notably, momentum indicators such as RSI and the Stochastic Oscillator on the daily timeframe are gradually moving out of oversold territory, signaling that selling pressure is waning and paving the way for a technical rebound.
As of Wednesday, MNT was trading around $0.64, down slightly by 0.1% over the past 24 hours.
Arbitrum could form a new bottom if $0.096 is broken
Arbitrum (ARB) continued to face selling pressure on Wednesday, as the price slid toward Friday’s low of $0.096—marking the token’s lowest point in history. The weakening momentum appeared after ARB failed to break above the key resistance zone of $0.126 in recent days.
From a technical perspective, ARB could initiate a recovery toward the $0.171 zone if it successfully breaks through the $0.126 level and surpasses the 20-day EMA. Conversely, if the support level of $0.096 is breached, the risk of further decline increases, potentially pushing the price toward a new bottom around $0.063.
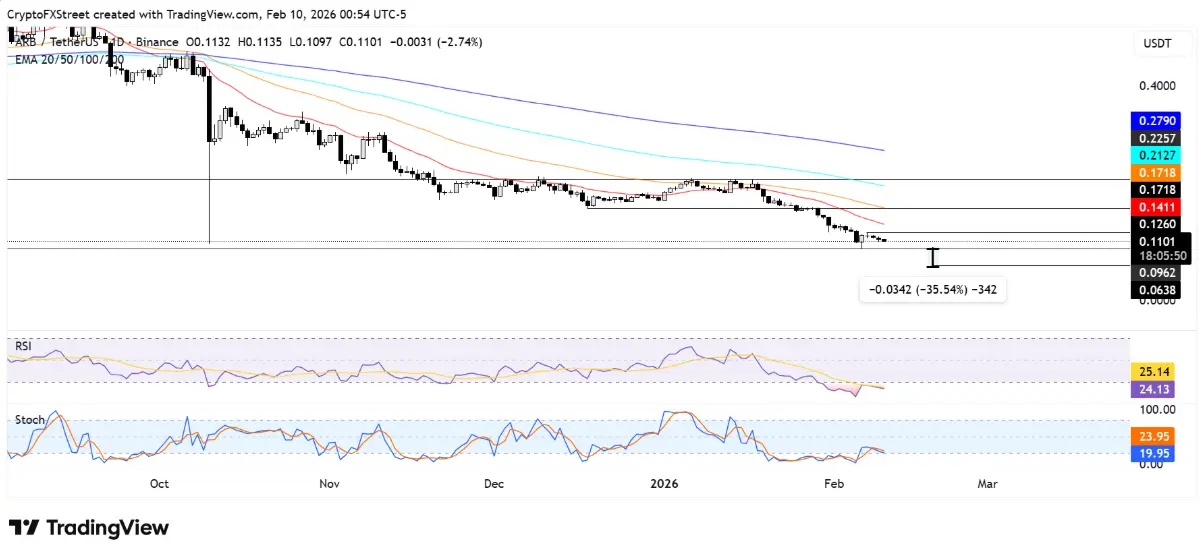 Daily ARB/USDT chart | Source: TradingView Momentum indicators such as RSI and the Stochastic Oscillator on the daily timeframe are both in oversold territory, indicating that the bears still hold clear dominance in the market.
Currently, ARB is trading around $0.11, down nearly 5% over the past 24 hours.
OP faces downside risk after rejection at $0.20
Optimism (OP) is in a consolidation phase after failing to break the resistance at $0.20 last weekend. Selling pressure remains dominant, suggesting a bearish trend and the possibility of retesting the historic low around $0.16.
In a positive scenario, OP could rebound toward the $0.24 zone—just below the 20-day EMA—if buyers regain control of the psychological level at $0.20.
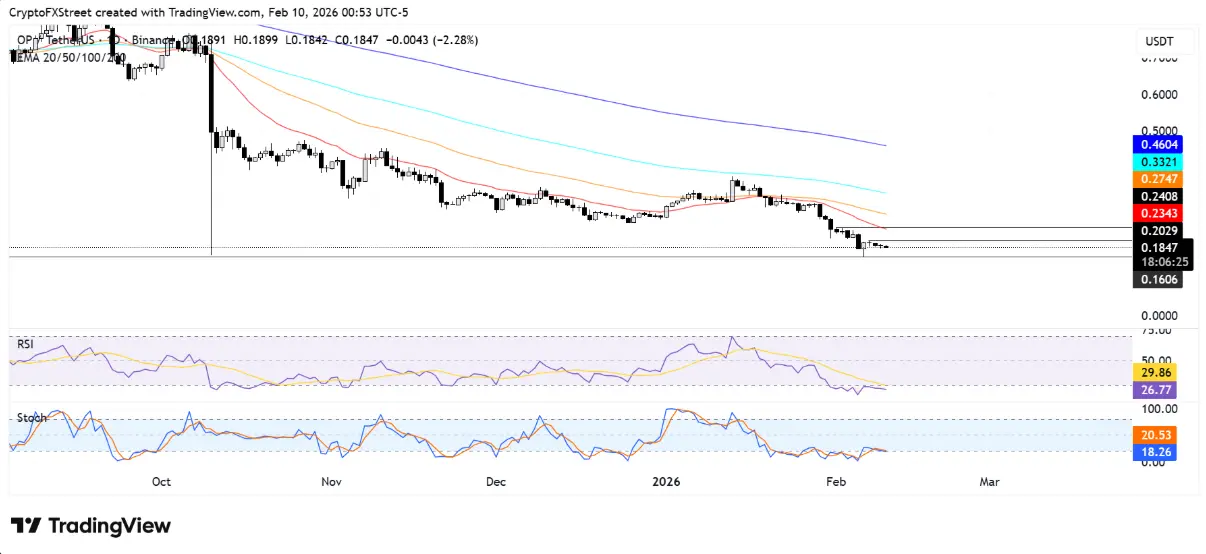 Daily OP/USDT chart | Source: TradingView On the daily chart, momentum indicators such as RSI and the Stochastic Oscillator remain deep in oversold territory, reflecting the bears’ dominance and indicating that the downward momentum has not yet weakened.
As of now, OP is trading around $0.18, down about 3% over the past 24 hours.
Related Articles
Michael Saylor doubles down on Bitcoin: Strategy remains heavily invested, long-term returns will be twice that of the S&P 500
Bitcoin Price Drops To $66,500, What Really Happened?
Wintermute Says AI Trade Is Draining Capital From Crypto
Spot Bitcoin ETF attracts $167 million in a single day, institutions rebalance holdings in XRP and Solana