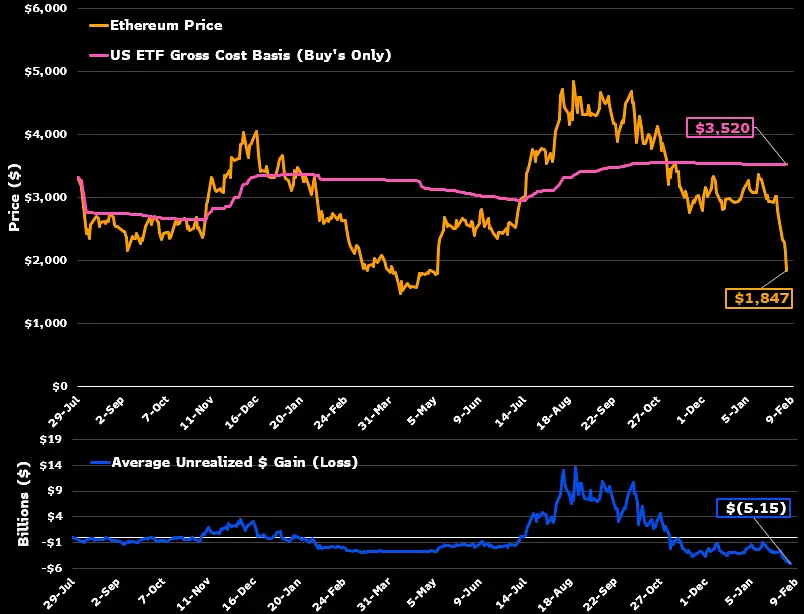
Bloomberg analyst James Seyffart states that Ethereum ETF holders are in a worse position than Bitcoin ETF investors. Ethereum’s price has fallen below $2,000, significantly below the estimated average cost basis of $3,500. The recent low of $1,736 has resulted in a decline of over 50%. In comparison, Bitcoin’s current price is $66,171, also below its estimated ETF cost basis of $84,063, though its retracement is smaller at 21%. Ethereum ETF assets have decreased from $30.5 billion to $11.27 billion.
The Tragic Drop in Ethereum Market Price Below ETF Cost Basis
(Source: James Seyffart)
Bloomberg analyst James Seyffart states that Ethereum ETF holders are in a worse situation than Bitcoin ETF investors. Ethereum’s price has fallen below $2,000, far below the estimated $3,500 average cost basis (the average price at which spot ETF investors built their positions), with a recent low of $1,736 representing a decline of over 50%. In comparison, Bitcoin is currently priced at $66,171, below its estimated ETF cost basis of $84,063, with a retracement of 21%.
From $3,500 down to $1,900, Ethereum ETF holders face an unrealized loss of about 46%. Such severe losses are a significant psychological and financial blow to any investor. Even worse, Ethereum has dropped from its high of $4,800 in 2021 to the current $1,900, a total decline of over 60%. This prolonged price slump is shaking the belief that “long-term holding will inevitably be profitable.”
Although Bitcoin ETF holders are also at a 21% loss, they are relatively “lucky.” From $84,063 down to $66,171, the loss is about $17,892 per coin. Holding 10 Bitcoin would mean a loss of approximately $180,000. Meanwhile, Ethereum ETF holders, from $3,500 to $1,900, face a loss of about $1,600 per coin. Holding 100 Ethereum would result in a loss of around $160,000. However, Ethereum’s decline percentage (46%) far exceeds Bitcoin’s (21%), making the psychological pain of “losing more” even harder to bear.
Comparison of Losses: Ethereum ETF vs. Bitcoin ETF
Ethereum ETF: Cost $3,500 vs. Market Price $1,900, Loss 46%
Bitcoin ETF: Cost $84,063 vs. Market Price $66,171, Loss 21%
Asset Value Shrinkage: ETH ETF from $30.5B to $11.3B (-63%), BTC ETF from $170B to $85.8B (-50%)
Seyffart points out that the total net inflow into ETH ETFs has only decreased by about $3 billion, indicating that most ETH ETF investors have held their positions during the recent decline. This “loss of 46% but still holding” can be interpreted as strong conviction or helplessness from being “too deep in the position to sell.” When losses reach 40-50%, many investors fall into the psychological trap of “selling means realizing a loss, not selling might still bring hope,” leading them to continue holding and betting on a rebound.
Asset Scale Halved from $170 Billion to $85.8 Billion
The spot Bitcoin ETF’s asset size peaked at $170 billion in October 2025 and is now at $85.76 billion. After mid-2025, capital inflows sharply slowed, with $13.7 billion flowing in during the first half of the year and $7.64 billion in the second half, with about $2 billion of outflows since the start of the year. Since July 2025, the net inflow has been approximately $5.64 billion.
The asset size has halved from $170 billion to $85.8 billion. This shrinkage mainly results from two factors: the decline in Bitcoin’s price (from $126,000 to $66,000, a drop of about 48%) reducing the value of holdings, and capital outflows (investor redemptions). If only considering price decline, assets should have fallen from $170 billion to about $88.4 billion (a 48% drop), but the actual figure is $85.8 billion, indicating roughly $2.6 billion in net outflows.
On February 5, Bloomberg senior ETF analyst Eric Balchunas noted that during the recent sell-off, only about 6% of Bitcoin ETF assets were liquidated. BlackRock’s IBIT Bitcoin ETF’s size has fallen from a peak of $100 billion to $51 billion, but it remains one of the fastest-growing ETFs to reach $60 billion.
This only 6% liquidation rate is significant. It means 94% of Bitcoin ETF investors are still holding, with no panic selling. This “holding firm” could reflect confidence or deep entrapment. But from a positive perspective, if most investors have not surrendered, it suggests the market may not have hit a true bottom yet. Conversely, it also implies that once a rebound occurs, these holders are less likely to sell immediately, potentially reducing resistance to upward movement.
Bitcoin ETF Enters Bear Market Outflow Zone
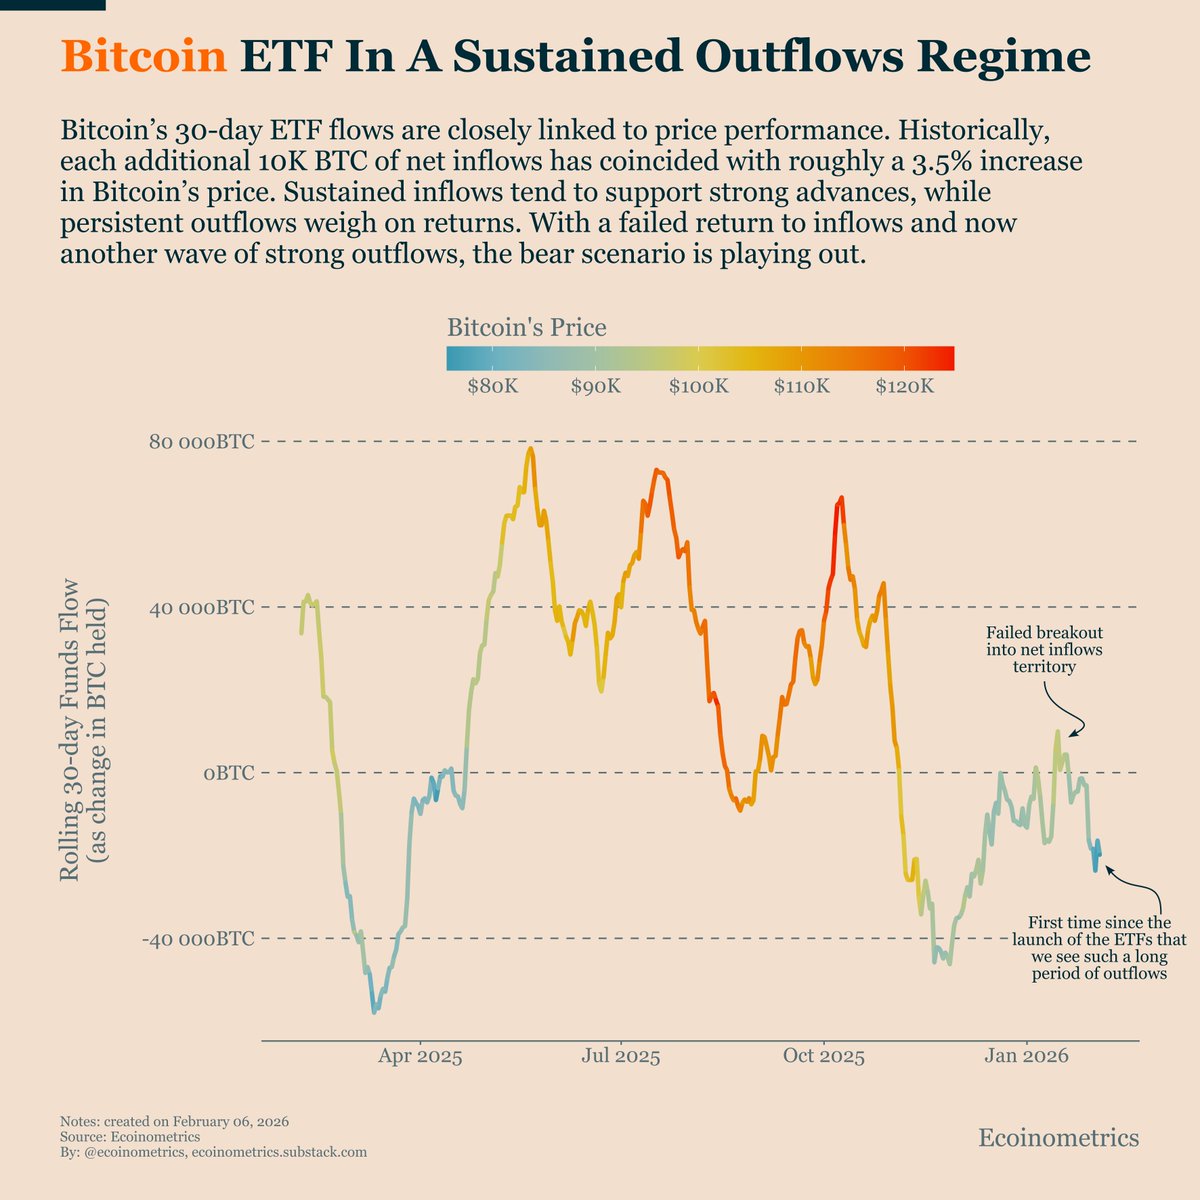
(Source: Ecoinometrics)
After failing to reverse the declining capital inflow trend, Bitcoin ETF’s rolling 30-day net flow has turned consistently negative over the past 30 days. Aside from brief rebounds, this is the longest continuous outflow since the ETF’s launch. Data from Glassnode also shows that the 30-day net flows for Bitcoin and Ethereum spot ETFs’ simple moving averages (SMA) have been mostly negative over the past 90 days, with no clear signs of recovery.
Ecoinometrics, a macroeconomic communication platform, states that the speed of these capital outflows indicates investors are actively reducing risk exposure rather than reacting to short-term volatility. The report also notes that weak prices and persistent negative capital flows align with a “bear market” state rather than a temporary correction.
This qualitative designation of “bear market” is very important. It implies that the current decline is not a healthy correction within a bull market but a trend-based bear market. Historically, bear markets take 12-18 months to bottom out and reverse. The 2018 bear market lasted from January to December, and the 2022 bear market from April to November. If the current bear market started in October 2025, it might not bottom until late 2026 or early 2027.
For Ethereum ETF and Bitcoin ETF holders, the current situation is extremely tough. Technicals are fully bearish, capital continues to flow out, and macro factors like high interest rates persist. The only hope is that the market is approaching extreme oversold levels. If catalysts such as an unexpected Fed rate cut, passage of the CLARITY Act, or Bitcoin breaking key resistance levels occur, a sharp rebound could be triggered. However, this hope is more akin to gambling than a solid investment based on logical fundamentals.

