When the "Old Map" No Longer Applies: A Review of 8 Failed Classic Crypto Indicators and Their Underlying Structural Reasons
Author: Frank, PANews
In early 2026, the crypto market is filled with a sense of frustration and confusion.
Bitcoin has retraced about 36% from its all-time high set in October 2025, and the market swings repeatedly between bulls and bears. But what’s more unsettling for many crypto investors isn’t the price itself, but the nearly complete failure of the indicator systems they previously relied on to gauge market conditions.
The S2F model’s $500,000 prediction has deviated more than threefold from reality. The four-year cycle, after the halving, has yet to produce a breakout rally. The Pi Cycle Top indicator has remained silent throughout the entire cycle. The fixed threshold of the MVRV Z-Score no longer triggers signals. The rainbow chart’s top zone has become unreachable. Meanwhile, the contrarian signals from the Fear & Greed Index repeatedly miss their mark, and the highly anticipated “altcoin season” has yet to arrive.
Why have these indicators collectively failed? Is it due to temporary deviations, or has the market structure undergone a fundamental change? PANews has systematically reviewed and analyzed eight widely discussed failed indicators.
Four-Year Cycle Theory: The Supply Shock from Halving Is Becoming Insignificant
The four-year cycle theory is one of the most widely accepted patterns in the crypto market. It posits that Bitcoin follows a fixed rhythm driven by halving events: accumulation before halving, explosive growth 12-18 months after, peak with 75-90% decline, then bottoming out and restarting. The halvings in 2012, 2016, and 2020 have largely validated this pattern.
However, after the April 2024 halving, the market did not experience the typical explosive rally seen in previous cycles. Bitcoin’s annualized volatility has dropped from over 100% historically to around 50%, showing more “slow bull” characteristics. The decline in bear markets has also narrowed: in 2022, the drop from peak to trough was 77%, less than 86% in 2014 and 84% in 2018.
Discussions about the failure of the four-year cycle are widespread on social media. The mainstream view suggests that institutional capital entry has fundamentally changed the microstructure of the market.
First, the continuous inflow of funds into Bitcoin spot ETFs in the US has created sustained demand, breaking the simple narrative driven solely by halving.
Second, on the supply side, the 2024 halving reduced block rewards to 3.125 BTC, decreasing daily new supply from about 900 BTC to 450 BTC, and annual supply growth by roughly 164,000 coins. This halving lowered Bitcoin’s annual inflation rate (supply growth rate) from 1.7% pre-halving to about 0.85%, with only 0.78% of the total 21 million supply being added annually. Compared to hundreds of billions in market cap, this supply reduction’s actual impact is minimal.
Pi Cycle Top: Lower Volatility Makes Moving Averages Crossings Less Likely
The Pi Cycle Top, developed by Philip Swift, identifies market tops by observing when the 111-day moving average crosses above twice the 350-day moving average. This indicator accurately signaled tops in 2013, 2017, and April 2021.
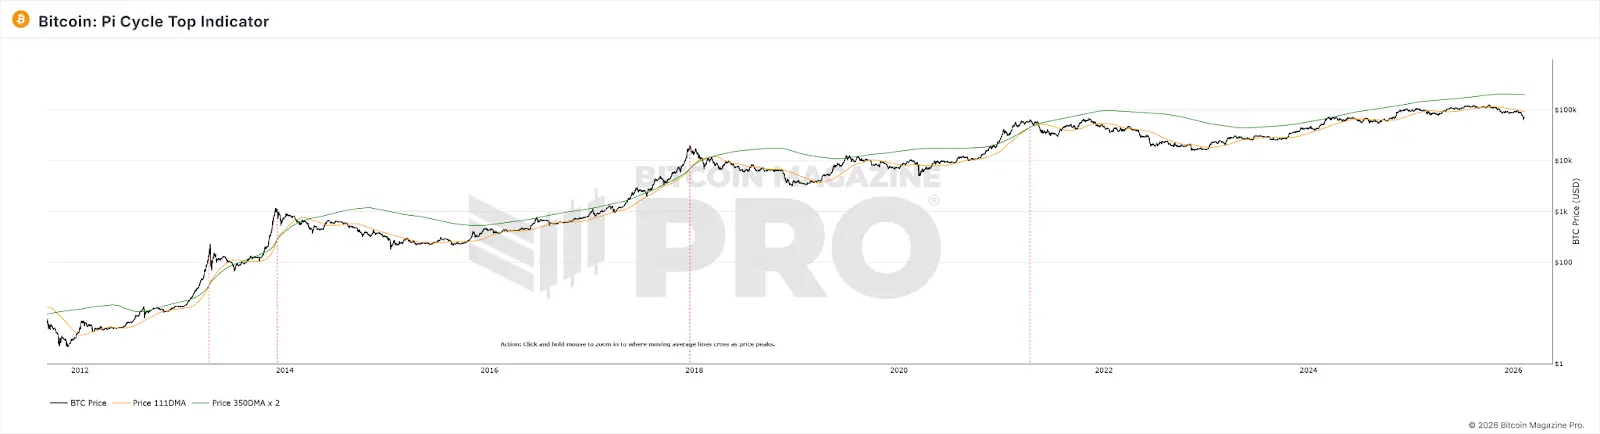
In the 2025 bull cycle, these two moving averages never produced a valid crossover, and the indicator remained “silent.” Yet, the downward trend was already quite clear.
The failure of this indicator may be because Pi Cycle Top relies on sharp price volatility to produce crossovers when short-term averages diverge significantly from long-term averages. As Bitcoin’s volatility structurally declines, and with ETF and institutional participation, the price trend has become smoother. Parabolic rises driven by retail speculation have diminished, making the conditions for moving average crossovers less likely. Additionally, this indicator is essentially a curve fit based on early adoption phases (2013–2021). As market participant structures change dramatically, the parameters fitted during early stages may no longer be applicable.
MVRV Z-Score: Changes in Market Scale and Holding Patterns Alter the Basis of Calculation
The MVRV Z-Score is an on-chain valuation metric comparing Bitcoin’s market value (current market cap) with realized value (the total value based on the last on-chain movement price per coin). Traditionally, a Z-Score above 7 signals overbought conditions and potential sell signals, while below 0 indicates extreme undervaluation and buy signals.
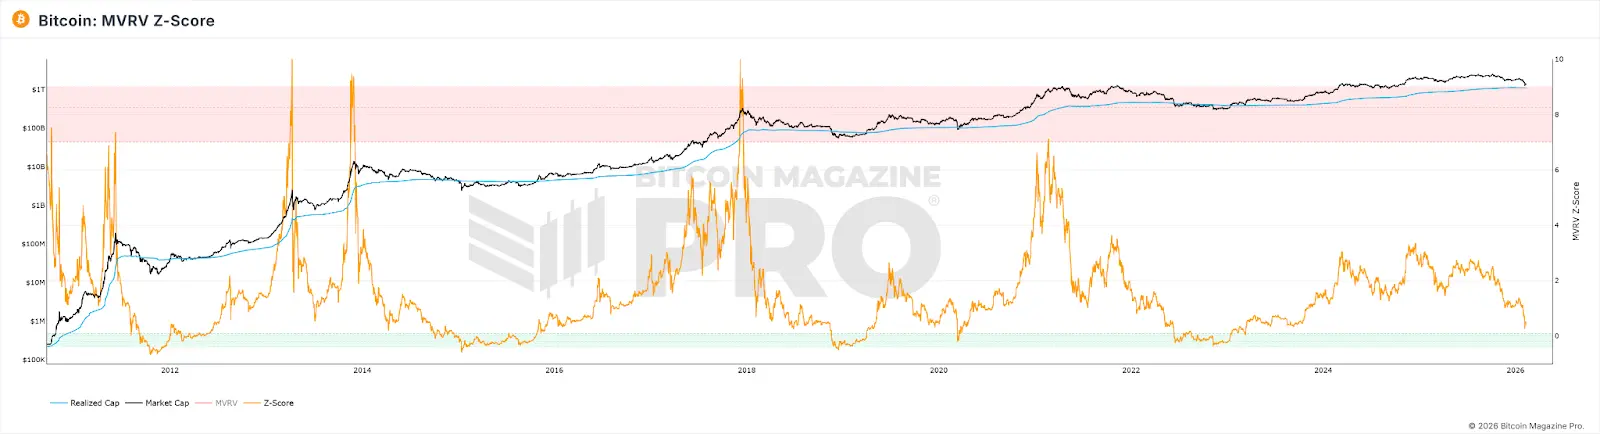
Even at the 2021 cycle top, the Z-Score did not reach previous cycle highs, and the fixed threshold (>7) was not triggered. By 2025, although Bitcoin topped out, the highest Z-Score was only 2.69.
Possible reasons include:
-
Institutional large-scale buying and long-term holding have systematically elevated the realized value close to market value, compressing the Z-Score’s volatility range.
-
High-frequency trading by active traders keeps the realized value “refreshed” near current prices, further narrowing the gap between market cap and realized value.
-
As market cap expands, generating the same extreme Z-Score values as in early cycles requires exponentially larger capital inflows.
The combined effect is that the Z-Score’s ceiling has been structurally lowered, and the original “7 = overbought” threshold is no longer reachable.
Rainbow Chart: Logarithmic Growth Assumption Is Being Broken
The Bitcoin Rainbow Chart fits long-term price trends with a logarithmic growth curve, dividing price ranges into color bands from “extremely undervalued” to “bubble peak,” guiding buy/sell decisions. In 2017 and 2021, when prices touched high-color bands, they indeed marked cycle tops.
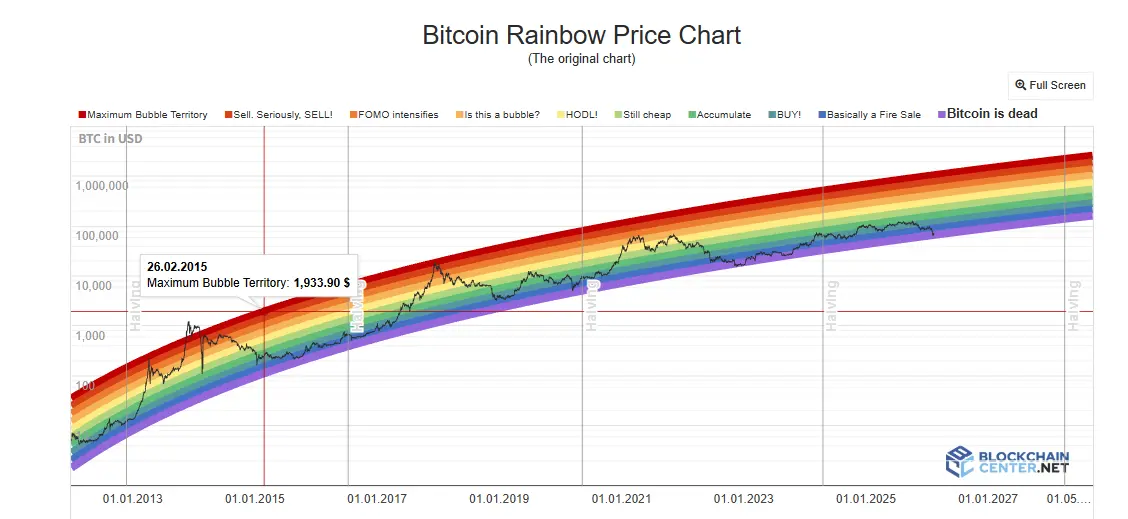
However, during the entire 2024–2025 bull cycle, Bitcoin’s price has only stayed within the neutral “HODL!” zone, never approaching the deep red “bubble” zone. The chart’s top prediction function has almost been inactive.
This model’s limitation is that the rainbow chart considers price as a function of time only. It does not incorporate halving events, ETFs, institutional flows, macro policies, or other variables. Moreover, the decline in volatility brought by institutionalization reduces the amplitude of price deviations from the trend line. Fixed-width color bands can no longer be reached. Additionally, Bitcoin’s growth is transitioning from the “steep segment of the adoption S-curve” to a “slow growth phase of a mature asset,” and the exponential extrapolation of the logarithmic function overestimates actual growth, causing prices to long remain below the centerline.
Altcoin Season Index and BTC Dominance: The Premise of “Fund Flows” Has Changed
The Altcoin Season Index measures the proportion of the top 100 altcoins outperforming BTC over the past 90 days; exceeding 75 indicates “altcoin season.” BTC Dominance, the ratio of Bitcoin’s market cap to total crypto market cap, falling below 50% or even 40% signals capital flowing from BTC into altcoins. In 2017, BTC dominance dropped from 85% to 33%; in 2021, from 70% to around 40%, both corresponding to major altcoin rallies.
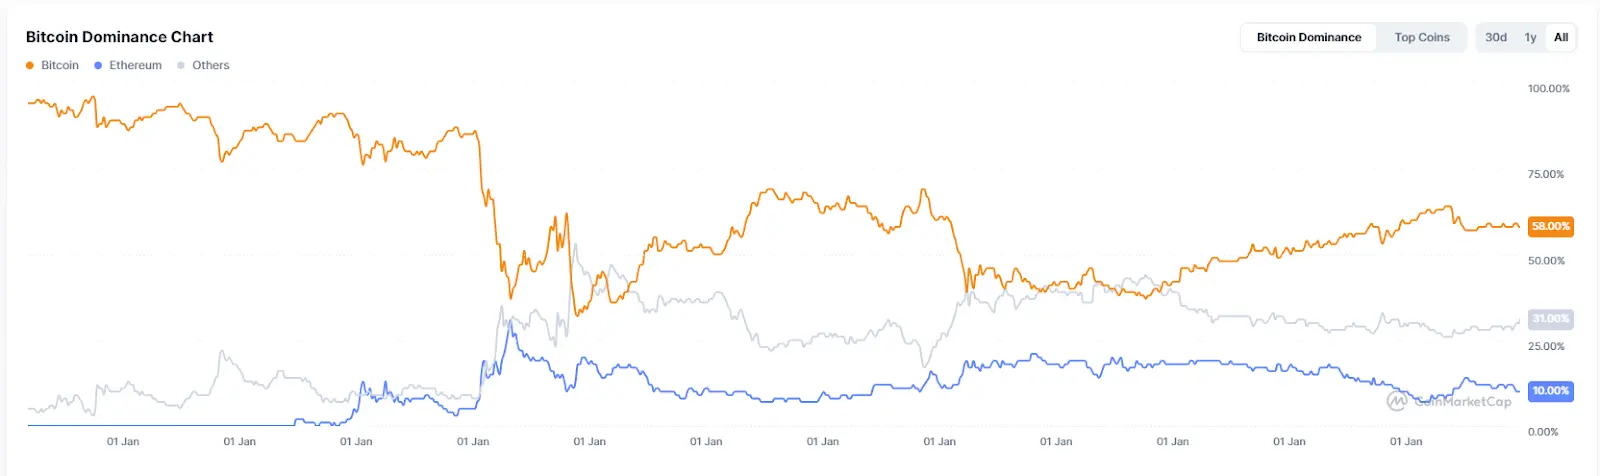
However, throughout 2025, the Altcoin Season Index has remained below 30, staying in “Bitcoin season.” BTC dominance peaked at 64.34% and never fell below 50%. As of early 2026, the so-called “Altseason” is more driven by targeted narratives—such as AI, RWA—rather than broad-based rallies.
The fundamental reason for these indicators’ failure is that the current market structure, dominated by institutional and ETF flows, favors Bitcoin’s risk profile over altcoins. Large amounts of capital are siphoned into AI and precious metals markets, reducing overall crypto inflows. The incremental funds attracted by Bitcoin ETFs flow directly into BTC, and these investors buy financial products rather than tokens in the crypto ecosystem. Additionally, the narrative exhaustion and liquidity decline in altcoin projects further delay any broad altcoin season.
Fear & Greed Index: Retail Sentiment Is No Longer the Price Driver
The Crypto Fear & Greed Index combines volatility, market momentum, social media sentiment, Google Trends, and other factors into a 0–100 score. The classic approach is to buy when fear is extreme and sell when greed is extreme.
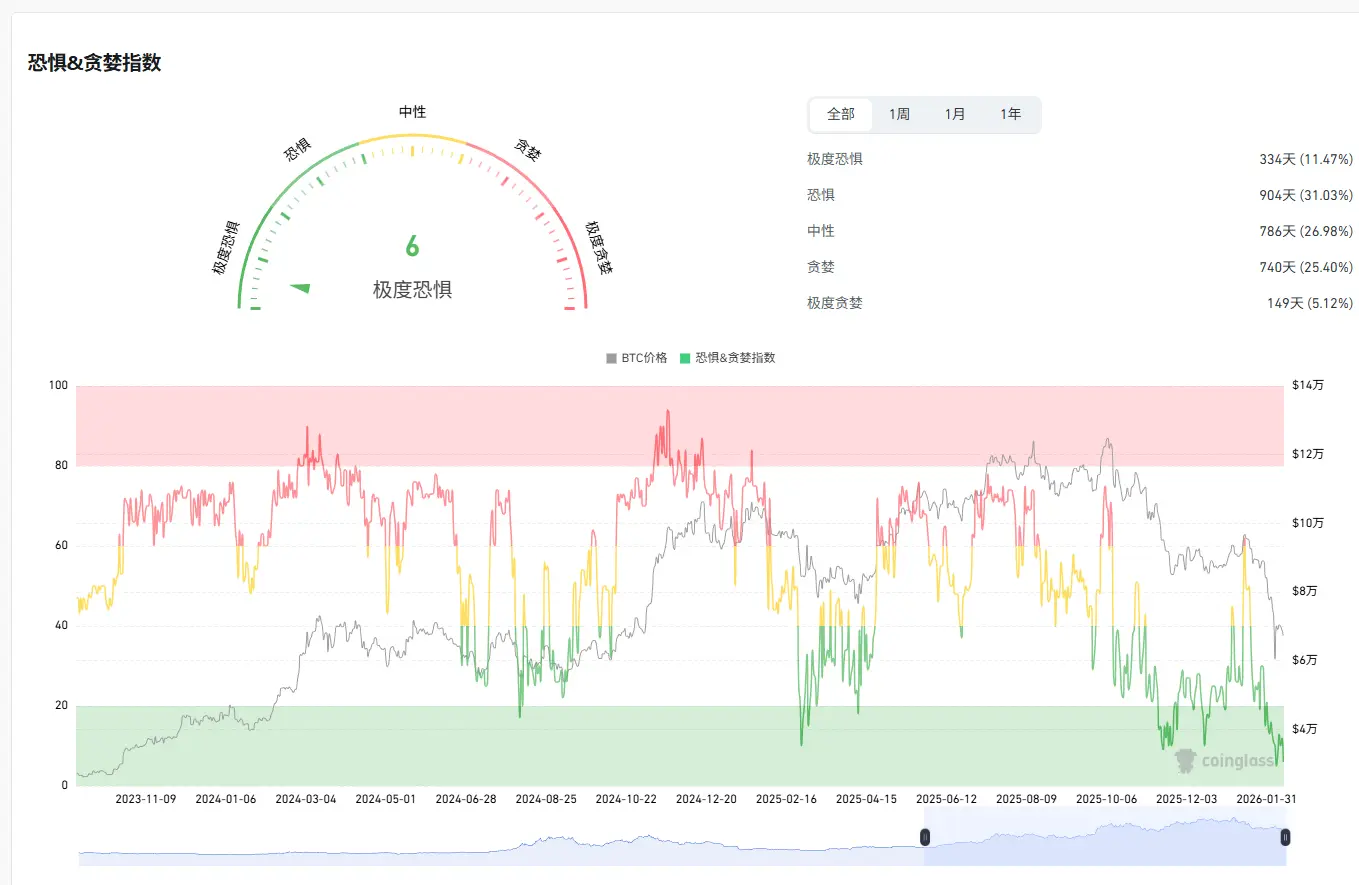
In April 2025, the index dropped below 10, lower than during the FTX collapse, but Bitcoin did not experience the expected sharp rebound. The 30-day moving average for the year was only 32, with 27 days in fear or extreme fear zones. As a top indicator, it has become unreliable. At the market high in October 2025, the index was only around 70.
The core reason for the index’s failure is that the transmission mechanism between sentiment and price has been disrupted by institutional capital. When retail investors are fearful, institutions may be buying the dip; when retail is greedy, institutions might be hedging with derivatives. This decouples retail sentiment from price movements.
NVT Ratio: On-Chain Transaction Volume No Longer Reflects True Economic Activity
The NVT ratio, dubbed “crypto PE ratio,” divides network value by daily on-chain transaction volume. A high NVT suggests overvaluation; a low NVT suggests undervaluation.
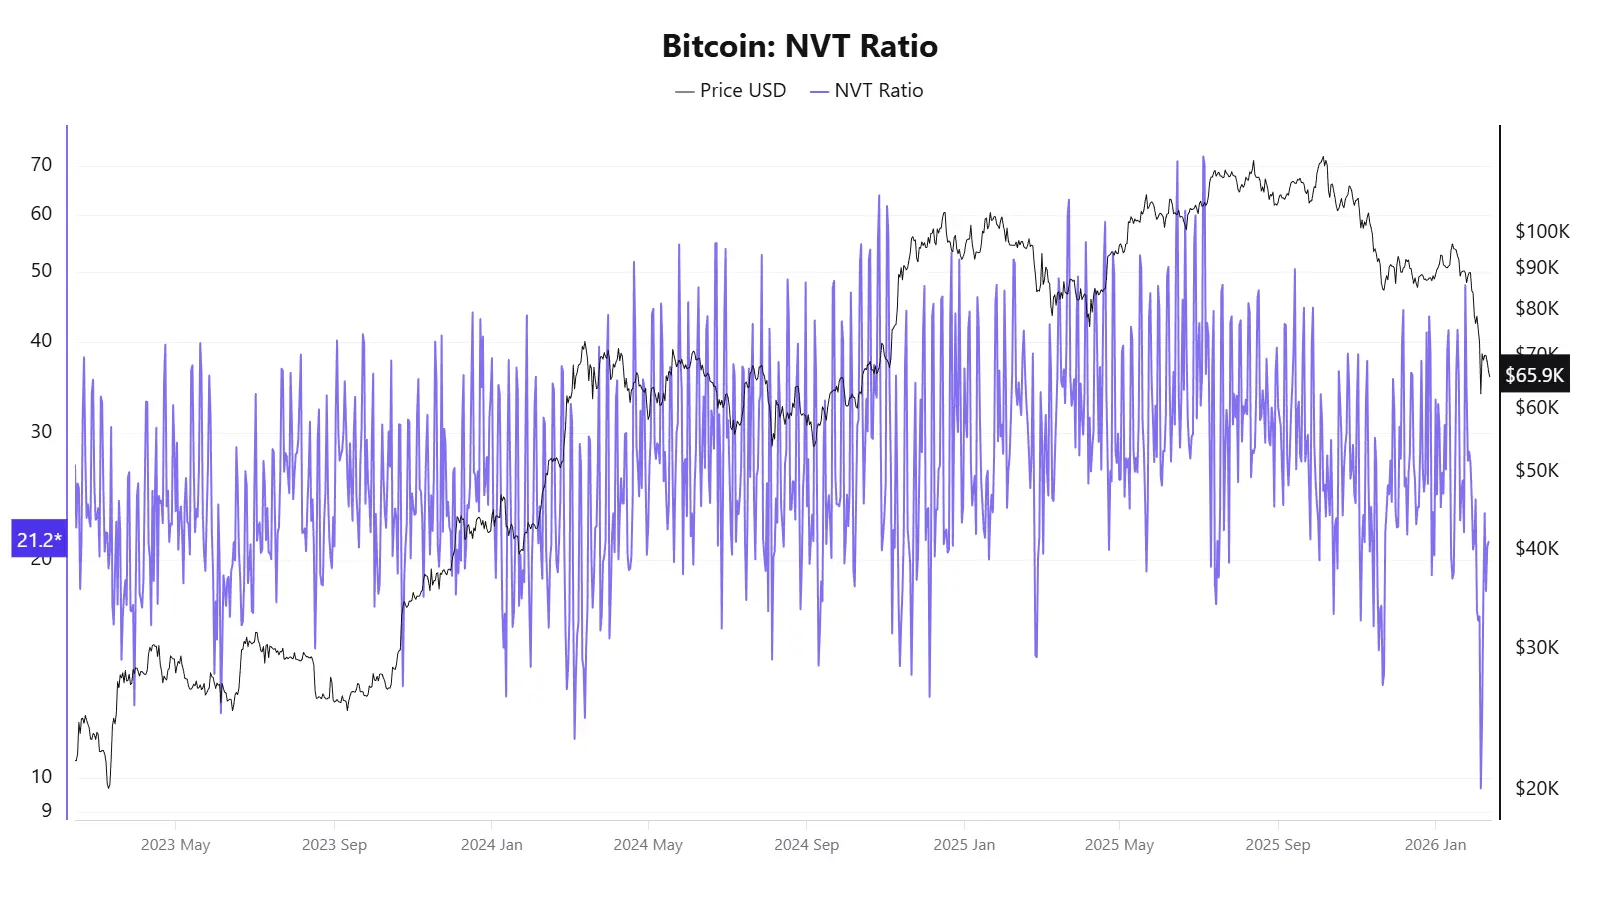
In 2025, conflicting signals emerged: in April, before a major price rise, the NVT Golden Cross reached 58, but by October, when prices hit around $120,000, it indicated undervaluation.
The fundamental reason for NVT’s failure is that its denominator—on-chain transaction volume—no longer accurately reflects the real economic activity of the Bitcoin network.
S2F Model: Focusing Only on Supply, Ignoring Demand
The Stock-to-Flow (S2F) model, proposed by anonymous analyst PlanB in 2019, borrows from precious metals valuation logic. It measures scarcity by the ratio of stock (total supply) to annual flow (new issuance), fitting a logarithmic price curve. The core assumption: after each halving, S2F doubles, and prices should rise exponentially.
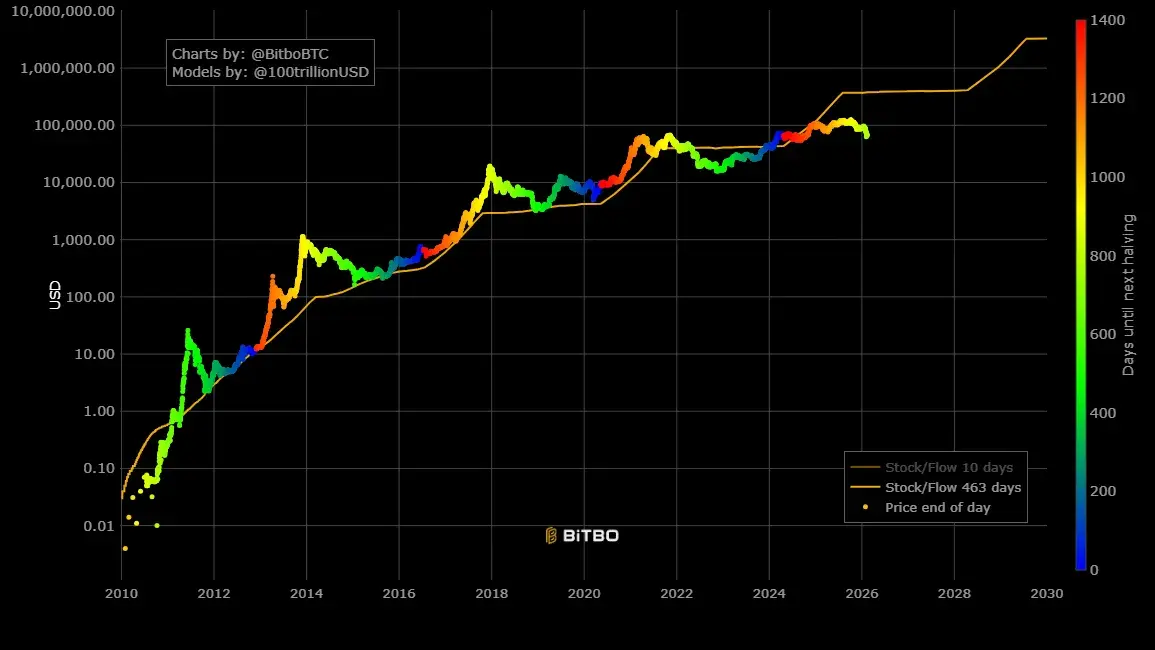
In terms of failure, in December 2021, the model predicted Bitcoin should reach about $100,000, but the actual price was around $47,000, a deviation of over 50%. For 2025, the target was $500,000, but the actual price was about $120,000, a gap exceeding three times.
The fundamental flaw of S2F is that it is a supply-only model, completely ignoring demand-side variables. Moreover, as Bitcoin’s market cap reaches trillions, exponential growth becomes physically harder to sustain, and diminishing marginal effects are unavoidable.
The Failures Are Not Isolated, but Reflect a Shared Market Assumption Breakdown
Viewing these indicators collectively reveals that their failures are not isolated incidents but point to a set of structural changes:
Institutional Changes in Market Microstructure: The entrance of Bitcoin ETFs, corporate treasury allocations, CME derivatives, and pension funds has fundamentally altered capital structures and price discovery mechanisms. Institutions tend to buy on dips and hold long-term, smoothing out the volatility previously driven by retail sentiment. This makes all extreme volatility or sentiment-based signals less effective. Additionally, the siphoning of funds into AI and precious metals markets reduces overall liquidity in crypto.
Structural Decline in Volatility: This is a direct technical reason behind many indicator failures: Pi Cycle Top and rainbow charts require extreme price moves to trigger signals; MVRV needs large deviations between market cap and cost basis; funding rates need extreme longs/shorts imbalance. As volatility drops from 100% to 50%, these conditions are harder to meet.
Bitcoin’s Asset Class Transition: From a digital commodity to a macro financial asset, Bitcoin’s price drivers are shifting from on-chain variables (halving, on-chain activity) to macro factors like Federal Reserve policies, global liquidity, and geopolitical risks. Indicators focused solely on on-chain data are increasingly disconnected from the broader macro environment.
On-Chain Data’s Diminished Representativeness: Trends like Layer 2 transactions, exchange internal settlements, and ETF custody models erode the relevance of on-chain metrics, making NVT, MVRV, and similar indicators less capable of capturing the full picture.
Small Sample Size and Model Overfitting: Many classic indicators are based on curve fitting over just 3–4 halving cycles. With the market environment changing dramatically, these models are prone to failure.
For ordinary investors, the collective failure of these indicators may convey a more fundamental message: understanding each indicator’s assumptions and boundaries is more important than relying on a single “universal” predictor. Overdependence on any one metric can lead to misjudgments. As the market’s underlying rules are being rewritten, maintaining cognitive flexibility may be more pragmatic than chasing the next “all-in-one” indicator.
Related Articles
A whale deposited 1,765,000 USDC into HyperLiquid to open long positions on ETH and BTC.
The UAE has accumulated $450 million worth of Bitcoin through mining, with a net profit of $344 million after deducting costs.
Harvard Buys $87M in Ethereum ETF, Cuts Bitcoin Stake
Yesterday, US Bitcoin spot ETFs experienced net outflows of $133 million, while Ethereum ETFs saw net outflows of $41.8 million.
Bitcoin futures open interest plummets 55%, marking the largest decline in nearly three years
Is Avalanche (AVAX) About to Repeat Its 2020 Magic Against Bitcoin? This Emerging Fractal Suggest So!