LayerZero (ZRO) has made an impressive breakout after the recent market crash, continuously setting higher highs despite the overall market still being weak.
This altcoin previously surged to $1.88 before entering a slight correction. At the time of writing, ZRO is trading around $1.81, up 1.29% for the day.
Notably, the price remains in an upward structure, indicating persistent buying pressure. Each correction quickly attracts buyers back, significantly reducing the risk of sharp declines.
LayerZero’s Momentum Indicators Turn Bullish
Earlier, LayerZero (ZRO) fell to around $1.30 during the late February correction. However, quick dip-buying activity helped stabilize the price early on.
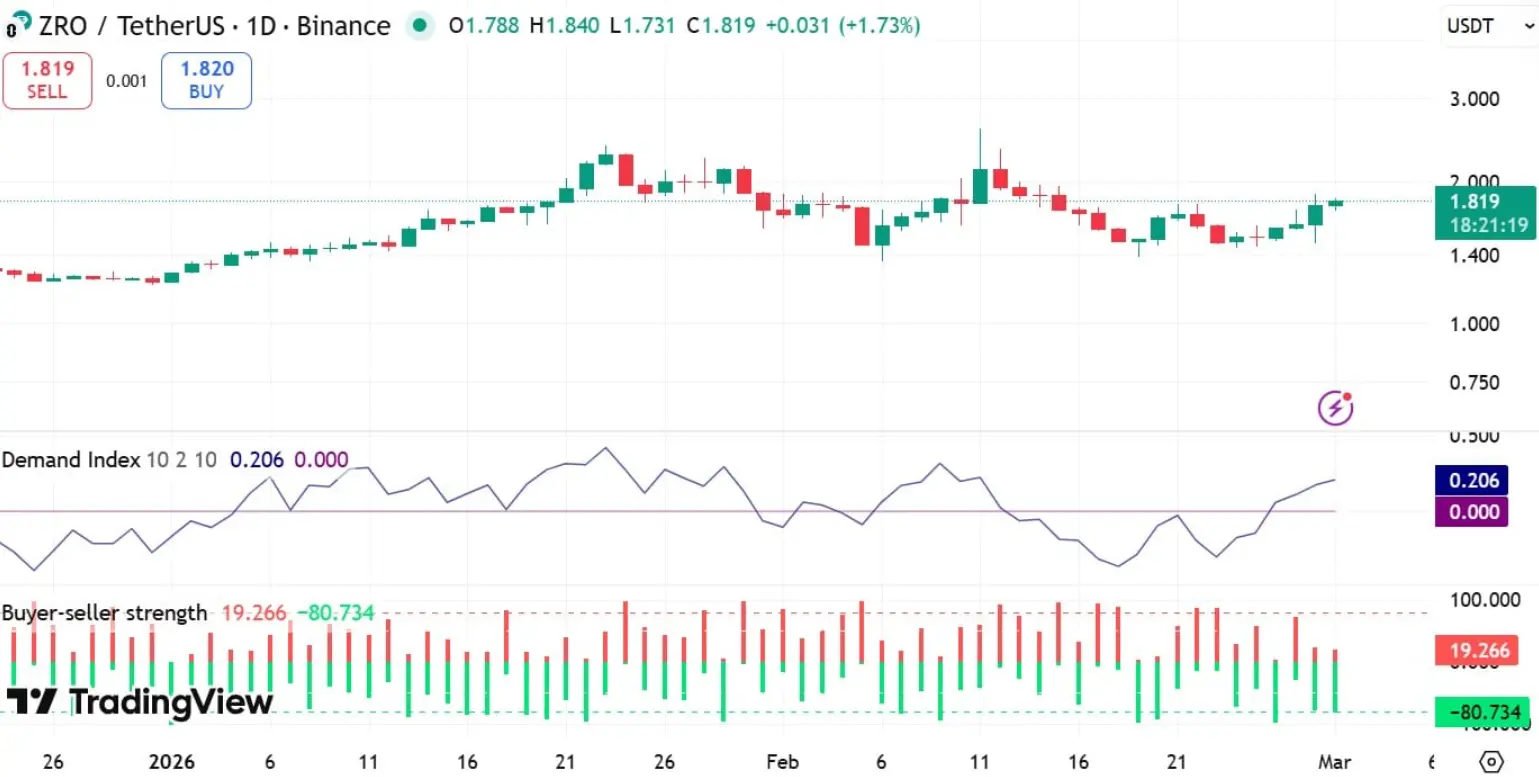
The Buy-Sell Strength indicator shows a clear dominance of bulls, with this metric approaching 80, while bearish strength remains below 25. This imbalance persisted until February 28, indicating that buying momentum continued to lead.
Meanwhile, the Demand Index surged from 0.058 to 0.206, confirming that accumulation pressure is returning to the market. Historically, a steadily expanding Demand Index often signals an early indication of a sustainable uptrend.
From a momentum perspective, the Stochastic RSI rose to 86.73, entering overbought territory. However, in strong uptrends, this indicator can remain high for some time before a significant correction occurs.
 Source: TradingView The Aroon indicator adds further technical insight: Aroon Down remains at 0%, while Aroon Up is at 28.57%. This structure suggests the trend is in a recovery phase rather than a confirmed breakout.
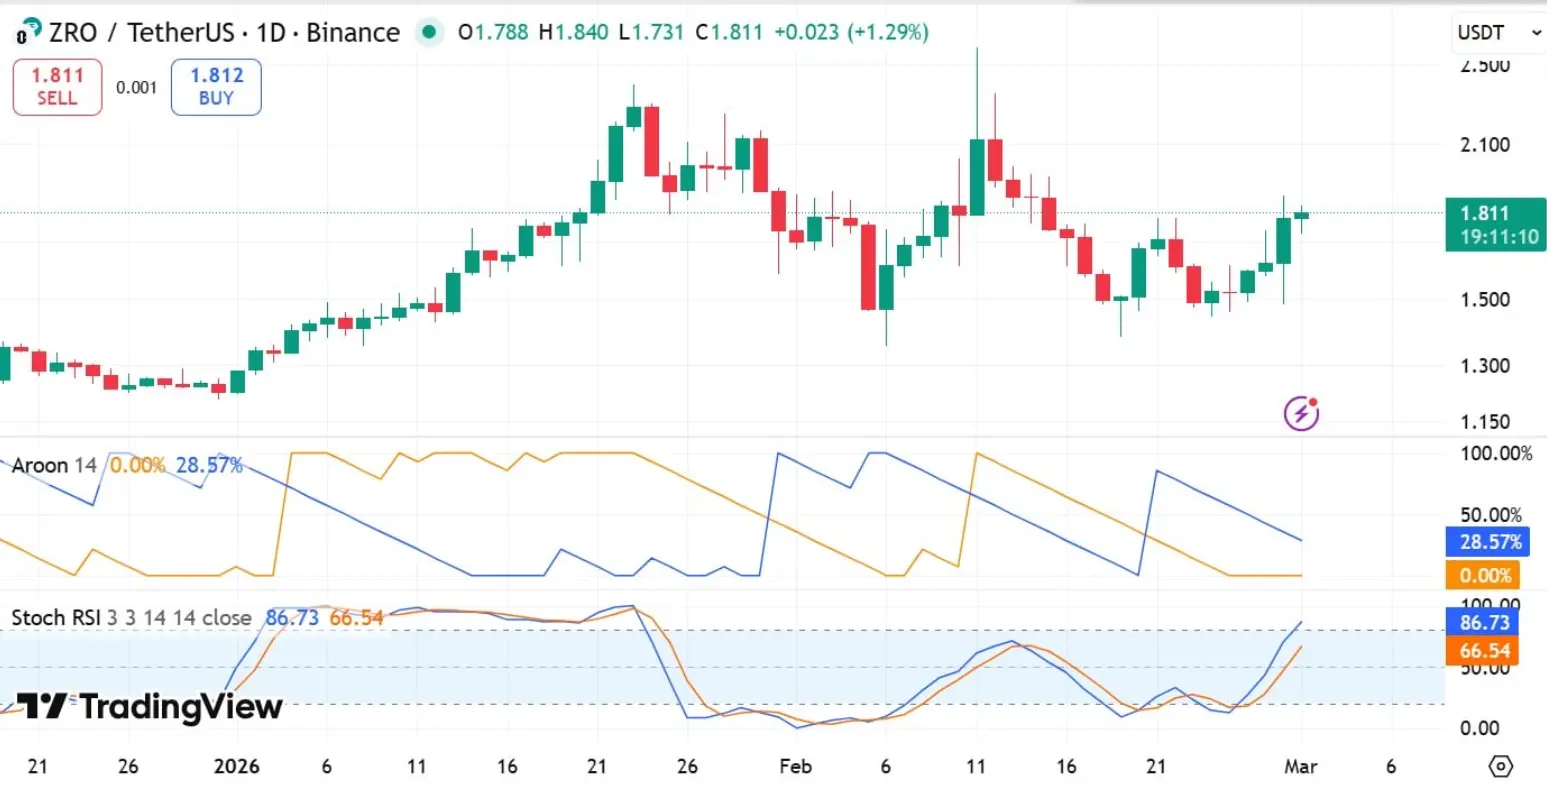 Source: TradingView These signals have traders paying close attention to the key resistance zone around $2.00. If current momentum is maintained, ZRO could test this level again and even extend gains toward $2.50. Conversely, if the technical structure weakens, the support zone near $1.50 may be challenged again.
Although the short-term outlook leans positive, profit-taking risks still exist. Investors who are “stuck” from the previous decline might use the rebound to sell, creating resistance to further price increases.
On-Chain Demand Remains Strong
Supported not only by positive technical signals, network data also reinforces the stability of the price.
Over the past month, the Price DAA Divergence indicator has consistently remained in positive territory, signaling that user activity growth is outpacing the price increase.
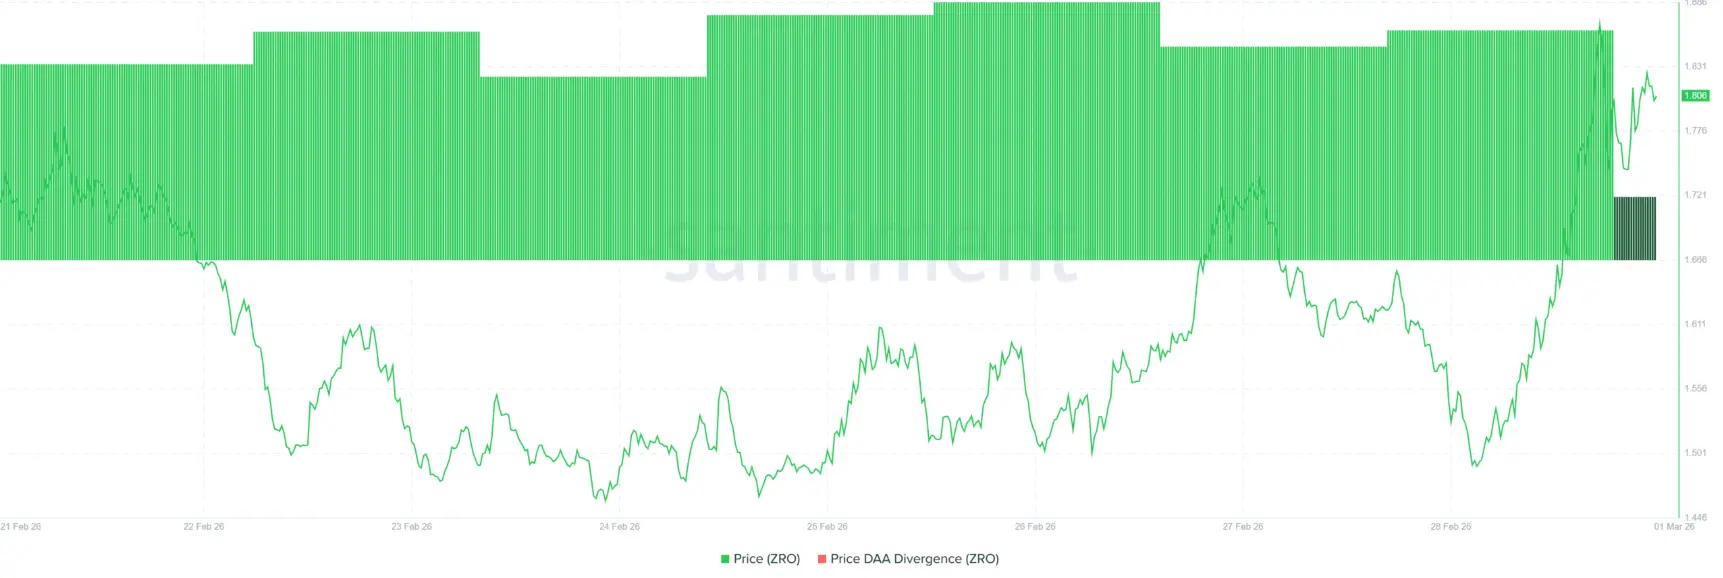 Source: Santiment Even during market corrections, on-chain activity levels stay high. This reflects steady new user participation, indicating the asset’s appeal remains strong. In other words, despite increased network usage, the price has yet to fully reflect this potential—a sign that the asset may be undervalued relative to the ecosystem’s expansion rate.
Historically, periods where market structure shows long-term capital accumulation like this often precede significant breakout rallies.
Therefore, the upward trend of this altcoin is likely to continue as long as on-chain activity remains high and stable.
Disclaimer: The information on this page may come from third parties and does not represent the views or opinions of Gate. The content displayed on this page is for reference only and does not constitute any financial, investment, or legal advice. Gate does not guarantee the accuracy or completeness of the information and shall not be liable for any losses arising from the use of this information. Virtual asset investments carry high risks and are subject to significant price volatility. You may lose all of your invested principal. Please fully understand the relevant risks and make prudent decisions based on your own financial situation and risk tolerance. For details, please refer to
Disclaimer.
Related Articles
Polkadot to Reset Tokenomics on March 12 With Major DOT Supply and Staking Changes
Polkadot will introduce a new monetary framework on March 12 that sets DOT’s supply cap at 2.1 billion and lowers emissions by 53.6%.
The overhaul will also create a Dynamic Allocation Pool and shorten the DOT unbonding period from 28 days to 24–48 hours.
On March 12, Polkadot will reset
CryptoNewsFlash11m ago
Solana Eyes $90.6 Trigger Point as $83 Support Holds and Liquidation Pressure Builds
A large cluster of short positions faces liquidation if SOL reaches $90.6, potentially increasing volatility.
SOL trades between $83.00 support and $89.58 resistance, keeping price action compressed in the short term.
SOL posts a 0.8% daily gain and rises 0.7% against BTC, holding
CryptoNewsLand31m ago
Will XRP Hold $1.33 or Extend Toward $1.30 Before Rebound?
XRP is currently trading at $1.35, experiencing a 1.3% decline. Key support is at $1.34, while resistance is at $1.40. The price is testing around the Fibonacci levels of $1.33 and $1.30, crucial for potential upward movement or deeper decline.
CryptoNewsLand36m ago
Solana Nears $95 Resistance With $17B Volume Surge
Solana approaches a key resistance level near $95, with increased trading volume and open interest signaling active trader interest. The token is currently at $90.20, facing potential upward movement if it surpasses $95, but may test $85 if rejected.
CryptoFrontNews1h ago
Analyst Says Bittensor (TAO) Could Be Ready for a Spike – Here’s the Price Target
Bittensor (TAO) is standing out again after spending months moving sideways. The AI-focused token has been hovering near a key support zone, and some analysts believe the chart may be setting up for a larger move.
Crypto analyst Karamata shared a breakdown of the TAO chart, arguing that
CaptainAltcoin1h ago
HBAR at a Crossroads: Will $0.095 Support Trigger a Break Toward $0.106?
HBAR is trading at $0.09739 and above the S/R flip of $0.094-$0.096 in the 12H chart.
The nearest resistance will be at $0.10 with a falling trendline pressure at around $0.104-$0.106.
The support is at $0.095835 and a breakdown at the
CryptoNewsLand1h ago

