Trade
Basic
Futures
Futures
Hundreds of contracts settled in USDT or BTC
TradFi
Gold
Trade global traditional assets with USDT in one place
Options
Hot
Trade European-style vanilla options
Unified Account
Maximize your capital efficiency
Demo Trading
Futures Kickoff
Get prepared for your futures trading
Futures Events
Participate in events to win generous rewards
Demo Trading
Use virtual funds to experience risk-free trading
Earn
Launch
CandyDrop
Collect candies to earn airdrops
Launchpool
Quick staking, earn potential new tokens
HODLer Airdrop
Hold GT and get massive airdrops for free
Launchpad
Be early to the next big token project
Alpha Points
Trade on-chain assets and enjoy airdrop rewards!
Futures Points
Earn futures points and claim airdrop rewards
Investment
Simple Earn
Earn interests with idle tokens
Auto-Invest
Auto-invest on a regular basis
Dual Investment
Buy low and sell high to take profits from price fluctuations
Soft Staking
Earn rewards with flexible staking
Crypto Loan
0 Fees
Pledge one crypto to borrow another
Lending Center
One-stop lending hub
VIP Wealth Hub
Customized wealth management empowers your assets growth
Private Wealth Management
Customized asset management to grow your digital assets
Quant Fund
Top asset management team helps you profit without hassle
Staking
Stake cryptos to earn in PoS products
Smart Leverage
New
No forced liquidation before maturity, worry-free leveraged gains
GUSD Minting
Use USDT/USDC to mint GUSD for treasury-level yields
More
AYATTAC
#GateSpringFestivalHorseRacingEvent like follow share my live stream 😉
- Reward
- 1
- 1
- Repost
- Share
AylaShinex :
:
Happy New Year! 🤑🚀 #BlackRockToBuyUNI
Big news: BlackRock is reportedly planning to acquire UNI!
💡 What this means:
Growing institutional interest in DeFi
Could boost confidence and liquidity in the UNI ecosystem
Potential positive impact on the broader crypto market
Stay updated and watch how the market reacts! 📈
#CryptoNews #DeFi #UNI #MarketUpdate #BlackRock
UNI3,52%

- Reward
- like
- Comment
- Repost
- Share
Participate in horse racing betting, complete tasks to earn horse racing tickets, and enjoy a million red envelope rain daily, sharing a prize pool of 100,000 USDT at the Gate 2026 Spring Festival Celebration. https://www.gate.com/competition/year-of-horse-2026?ref_type=165&utm_cmp=7EQB9Jba&ref=UwVDBF4M
View Original
- Reward
- like
- Comment
- Repost
- Share
芝麻传奇
芝麻传奇之路
Created By@gatefunuser_e111
Listing Progress
100.00%
MC:
$2.01K
More Tokens
Participate in horse racing betting, complete tasks to earn horse racing tickets, and enjoy a million red envelope rain daily, sharing a prize pool of 100,000 USDT at the Gate 2026 Spring Festival Celebration. https://www.gate.com/competition/year-of-horse-2026?ref_type=165&utm_cmp=7EQB9Jba&ref=VQJMBFXWUQ
View Original
- Reward
- like
- Comment
- Repost
- Share
Participate in horse racing betting, complete tasks to earn horse racing tickets, and enjoy a million red envelope rain daily, sharing a prize pool of 100,000 USDT at the Gate 2026 Spring Festival Celebration. https://www.gate.com/competition/year-of-horse-2026?ref_type=165&ref=BABCVQta
View Original
- Reward
- like
- Comment
- Repost
- Share
#我在Gate广场过新年 BTC ETH Technical Analysis Deep Dive
1. From a technical indicator perspective, Bitcoin (BTC) remains in a bearish configuration on the daily chart, with MACD fast and slow lines below the zero axis, indicating that bearish momentum has not yet been fully released. However, the 4-hour candlestick chart found support near $65,800, showing signs of stabilization and rebound. The Bollinger Bands are narrowing, and short-term volatility is decreasing.
Key price levels:
Support levels: The short-term key support is $65,000, which is the low support area after today’s sharp decline. If
View Original1. From a technical indicator perspective, Bitcoin (BTC) remains in a bearish configuration on the daily chart, with MACD fast and slow lines below the zero axis, indicating that bearish momentum has not yet been fully released. However, the 4-hour candlestick chart found support near $65,800, showing signs of stabilization and rebound. The Bollinger Bands are narrowing, and short-term volatility is decreasing.
Key price levels:
Support levels: The short-term key support is $65,000, which is the low support area after today’s sharp decline. If


[The user has shared his/her trading data. Go to the App to view more.]
- Reward
- 5
- 13
- Repost
- Share
牛气爆棚:
🚀🚀🚀🚀🚀🚀🚀🚀🚀🚀🚀🚀🚀🚀🚀🚀View More
Participate in horse racing betting, complete tasks to earn horse racing tickets, and enjoy a million red envelope rain daily, sharing a prize pool of 100,000 USDT at the Gate 2026 Spring Festival Celebration. https://www.gate.com/competition/year-of-horse-2026?ref_type=165&utm_cmp=7EQB9Jba&ref=VVJFUA0OVA
View Original
- Reward
- like
- Comment
- Repost
- Share
Participate in horse racing betting, complete tasks to earn horse racing tickets, and enjoy a million red envelope rain daily, sharing a prize pool of 100,000 USDT at Gate 2026 Spring Festival Celebration. https://www.gate.com/competition/year-of-horse-2026?ref_type=165&utm_cmp=7EQB9Jba&ref=VQRGXQ1FBW
View Original
- Reward
- like
- Comment
- Repost
- Share
Participate in horse racing betting, complete tasks to earn horse racing tickets, and enjoy a million red envelope rain daily, sharing a prize pool of 100,000 USDT at the Gate 2026 Spring Festival Celebration. https://www.gate.com/competition/year-of-horse-2026?ref_type=165&utm_cmp=7EQB9Jba&ref=VGBNXFFEUG
View Original
- Reward
- like
- Comment
- Repost
- Share

- Reward
- like
- Comment
- Repost
- Share
Participate in horse racing betting, complete tasks to earn horse racing tickets, and enjoy a million red envelope rain daily, sharing a prize pool of 100,000 USDT at the Gate 2026 Spring Festival Celebration. https://www.gate.com/competition/year-of-horse-2026?ref_type=165&utm_cmp=7EQB9Jba&ref=XlFNU1sN
View Original
- Reward
- like
- Comment
- Repost
- Share
Participate in horse racing betting, complete tasks to earn horse racing tickets, and enjoy a million red envelope rain daily, sharing a prize pool of 100,000 USDT at Gate 2026 Spring Festival Celebration. https://www.gate.com/competition/year-of-horse-2026?ref_type=165&utm_cmp=7EQB9Jba&ref=U1YRUVEN
View Original
- Reward
- like
- Comment
- Repost
- Share
zc
aztec
Created By@MuhyiddinBridi
Listing Progress
0.00%
MC:
$0.1
More Tokens

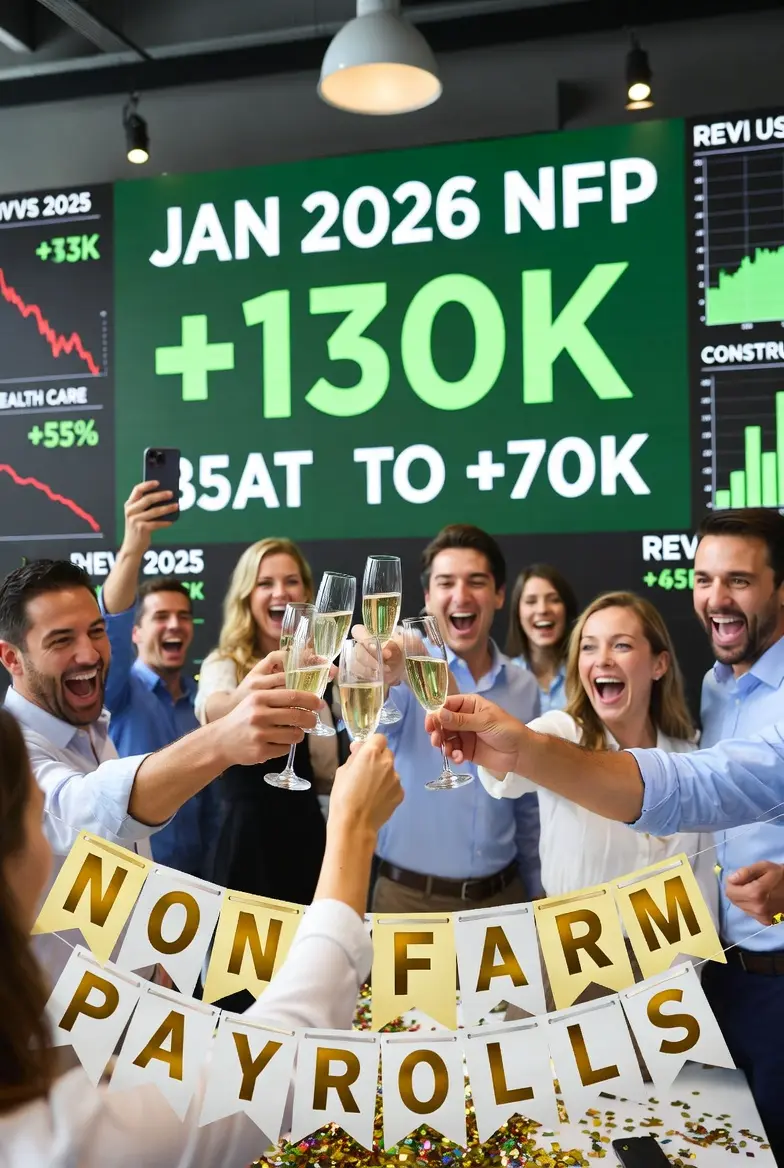
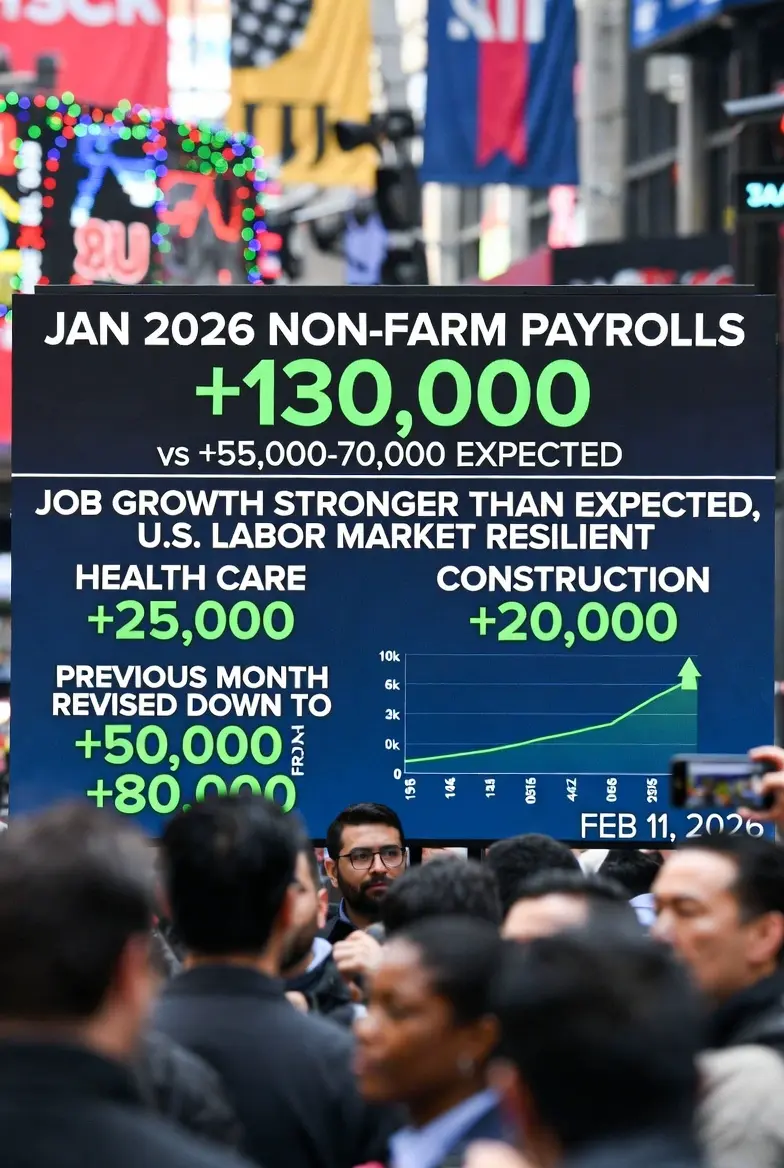
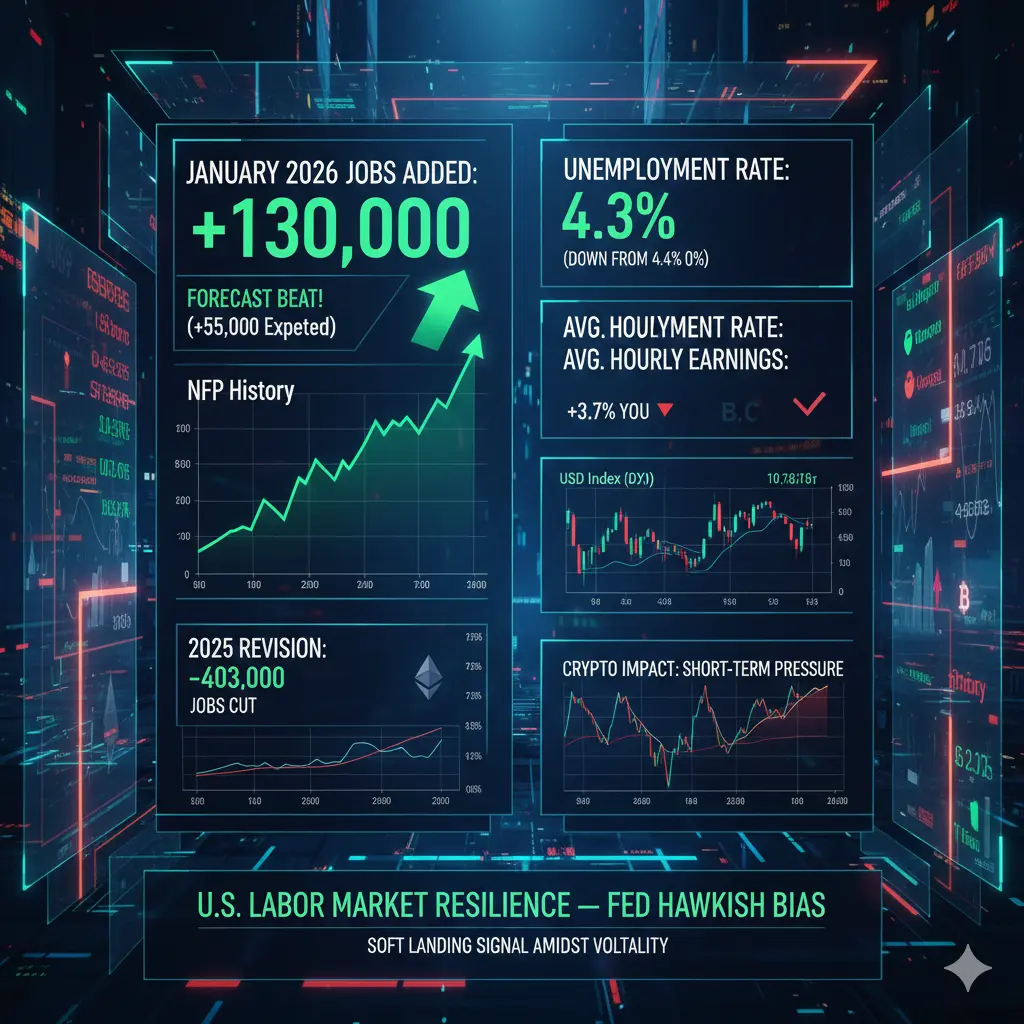
#NFPBeatsExpectations
The Non-Farm Payroll (NFP) report for January 2026 (released February 11, 2026, by the U.S. Bureau of Labor Statistics) was a major surprise — and in a good way for the economy's resilience. It showed stronger job growth than almost anyone expected, reversing some of the weakness seen in late 2025. Let me explain everything in full detail, step by step, in clear English so you can understand the big picture, the numbers, why it matters, and what it means for markets like crypto, stocks, forex, and the Fed's decisions.
1. What Happened: The Headline Numbers (The Big Surpr
BTC-0,7%
- Reward
- 1
- 1
- Repost
- Share
Amelia1231:
2026 Go Go Go 👊it was his last $27
he turned it into$62.1k
he never stopped clicking
lock in
This can be you today.
Lock in
7:00 PM utc
he turned it into$62.1k
he never stopped clicking
lock in
This can be you today.
Lock in
7:00 PM utc
- Reward
- like
- Comment
- Repost
- Share
Participate in horse racing betting, complete tasks to earn horse racing tickets, and enjoy a million red envelope rain daily, sharing a prize pool of 100,000 USDT at the Gate 2026 Spring Festival Celebration. https://www.gate.com/competition/year-of-horse-2026?ref_type=165&utm_cmp=7EQB9Jba&ref=BAUXUlwN
View Original
- Reward
- like
- Comment
- Repost
- Share
🚢 Set Sail with Gate – Win a Luxurious Mediterranean Cruise! 🌊
🎉 Crazy Wednesday Episode 25 is now live!
Trade just 1 USDT to unlock exciting rewards, including PYBOBO, a luxurious Mediterranean cruise experience, plus high-yield financial benefits.
🔥 How to participate:
✔️ Trade
✔️ Recharge
✔️ Invite friends
✔️ Complete financial tasks
🎁 100% chance to win!
💰 Limited-Time Offer:
Enjoy USDT 14-day fixed-term financial products with annualized yields of up to 10%.
Financial users will also share an extra 100,000 USDT prize pool!
Don’t miss out — trade, earn, and sail toward amazing reward
PYBOBO0,28%

- Reward
- like
- Comment
- Repost
- Share
Participate in horse racing betting, complete tasks to earn horse racing tickets, and enjoy a million red envelope rain daily, sharing a prize pool of 100,000 USDT at Gate 2026 Spring Festival Celebration. https://www.gate.com/competition/year-of-horse-2026?ref_type=165&utm_cmp=7EQB9Jba&ref=VLRGV1PBUQ
View Original
- Reward
- like
- Comment
- Repost
- Share
Load More
Join 40M users in our growing community
⚡️ Join 40M users in the crypto craze discussion
💬 Engage with your favorite top creators
👍 See what interests you
Trending Topics
View More542 Popularity
226 Popularity
130 Popularity
31.12K Popularity
235.57K Popularity
Hot Gate Fun
View More- MC:$2.41KHolders:20.00%
- MC:$0.1Holders:10.00%
- MC:$2.37KHolders:20.00%
- MC:$0.1Holders:10.00%
- MC:$0.1Holders:10.00%
News
View MoreArthur Hayes bought an additional 20,274 HYPE tokens 5 hours ago, currently holding 189,195 HYPE tokens.
8 m
SharpLink CEO: The macro positive outlook for Ethereum is currently at its best in its ten and a half year history
8 m
Gate stock CFD minimum order quantity will be adjusted to 0.1, entering close-only mode on February 13.
10 m
Meme coin CLAWNCH surges over 30% in a short period, with a market capitalization of approximately $17.2 million.
14 m
BERA price surged and then retraced 30%. Trader "Loracle" accurately shorted at the high point and has now taken profits.
16 m
Pin