Looking at the current trend, the four-hour candlestick chart saw a rise in the afternoon, hitting the upper band of the Bollinger Bands and then retracing to a thousand points. The current price is stabilizing around 57,000, with the candlestick chart running between the middle and upper bands. The KDJ indicator has formed a golden cross, indicating a strong long position. In the short term, the market is in a period of consolidation after the retracement. The retracement bottomed out around 56,600, and short positions are being blocked and consolidated. There is a downside of 2,000 points an
View OriginalTrade
Trading Type
Spot
Trade crypto freely
Pre-Market
Trade new tokens before they are officially listed
Margin
Magnify your profit with leverage
Convert & Block Trading
0 Fees
Trade any size with no fees and no slippage
Alpha
Points
Get promising tokens in streamlined on-chain trading
Leveraged Tokens
Get exposure to leveraged positions simply
Futures
Futures
Hundreds of contracts settled in USDT or BTC
Options
HOT
Trade European-style vanilla options
Unified Account
Maximize your capital efficiency
Demo Trading
Futures Kickoff
Get prepared for your futures trading
Futures Events
Participate in events to win generous rewards
Demo Trading
Use virtual funds to experience risk-free trading
Earn
Launch
CandyDrop
Collect candies to earn airdrops
Launchpool
Quick staking, earn potential new tokens
HODLer Airdrop
Hold GT and get massive airdrops for free
Launchpad
Be early to the next big token project
Alpha Points
NEW
Trade on-chain assets and enjoy airdrop rewards!
Futures Points
NEW
Earn futures points and claim airdrop rewards
Investment
Simple Earn
Earn interests with idle tokens
Auto-Invest
Auto-invest on a regular basis
Dual Investment
Buy low and sell high to take profits from price fluctuations
Soft Staking
Earn rewards with flexible staking
Crypto Loan
0 Fees
Pledge one crypto to borrow another
Lending Center
One-stop lending hub
VIP Wealth Hub
Customized wealth management empowers your assets growth
Private Wealth Management
Customized asset management to grow your digital assets
Quant Fund
Top asset management team helps you profit without hassle
Staking
Stake cryptos to earn in PoS products
Smart Leverage
NEW
No forced liquidation before maturity, worry-free leveraged gains
GUSD Minting
Use USDT/USDC to mint GUSD for treasury-level yields
More
Promotions
Activity Center
Join activities and win big cash prizes and exclusive merch
Referral
20 USDT
Earn 40% commission or up to 500 USDT rewards
Announcements
Announcements of new listings, activities, upgrades, etc
Gate Blog
Crypto industry articles
VIP Services
Huge fee discounts
Proof of Reserves
Gate promises 100% proof of reserves
# 动态挖矿
22.93K
BackTo1988
#动态挖矿
BlockBeats News: On August 23, top trader Eugene Ng Ah Sio posted on social media that ETH has underperformed SOL and BTC throughout the current Bull Market cycle, and pessimists believe that ETH's lack of retail-investor-friendly architecture and selling points is the key reason. While this is largely true, markets don't always move in one direction on a consistent basis. In its view, the most important factor remains the current position of the ETH market. ETH has been the most revered asset for Indigenous people in the encryption space for months, and even more so when the ETH ETF wa
View OriginalBlockBeats News: On August 23, top trader Eugene Ng Ah Sio posted on social media that ETH has underperformed SOL and BTC throughout the current Bull Market cycle, and pessimists believe that ETH's lack of retail-investor-friendly architecture and selling points is the key reason. While this is largely true, markets don't always move in one direction on a consistent basis. In its view, the most important factor remains the current position of the ETH market. ETH has been the most revered asset for Indigenous people in the encryption space for months, and even more so when the ETH ETF wa


- Reward
- like
- Comment
- Repost
- Share
- Reward
- like
- Comment
- Repost
- Share
#观察员
In the constantly fluctuating and declining cryptocurrency market, the price of BTCBTCUSD may fall to $45,000. Despite reaching a new high of $73,750 in March, the current trading price of BTC is below $55,000.
Due to the changes in active BTC addresses and widespread market decisions, a major adjustment is expected. BTC addresses reached their peak in November 2023 and then sharply declined in the first quarter of 2024. Short-term holders began reducing the amount of BTC in April, while long-term holders started selling at high prices, indicating that the cyclical peak has been reache
View OriginalIn the constantly fluctuating and declining cryptocurrency market, the price of BTCBTCUSD may fall to $45,000. Despite reaching a new high of $73,750 in March, the current trading price of BTC is below $55,000.
Due to the changes in active BTC addresses and widespread market decisions, a major adjustment is expected. BTC addresses reached their peak in November 2023 and then sharply declined in the first quarter of 2024. Short-term holders began reducing the amount of BTC in April, while long-term holders started selling at high prices, indicating that the cyclical peak has been reache
- Reward
- 7
- 1
- Repost
- Share
GateUser-4261ae24:
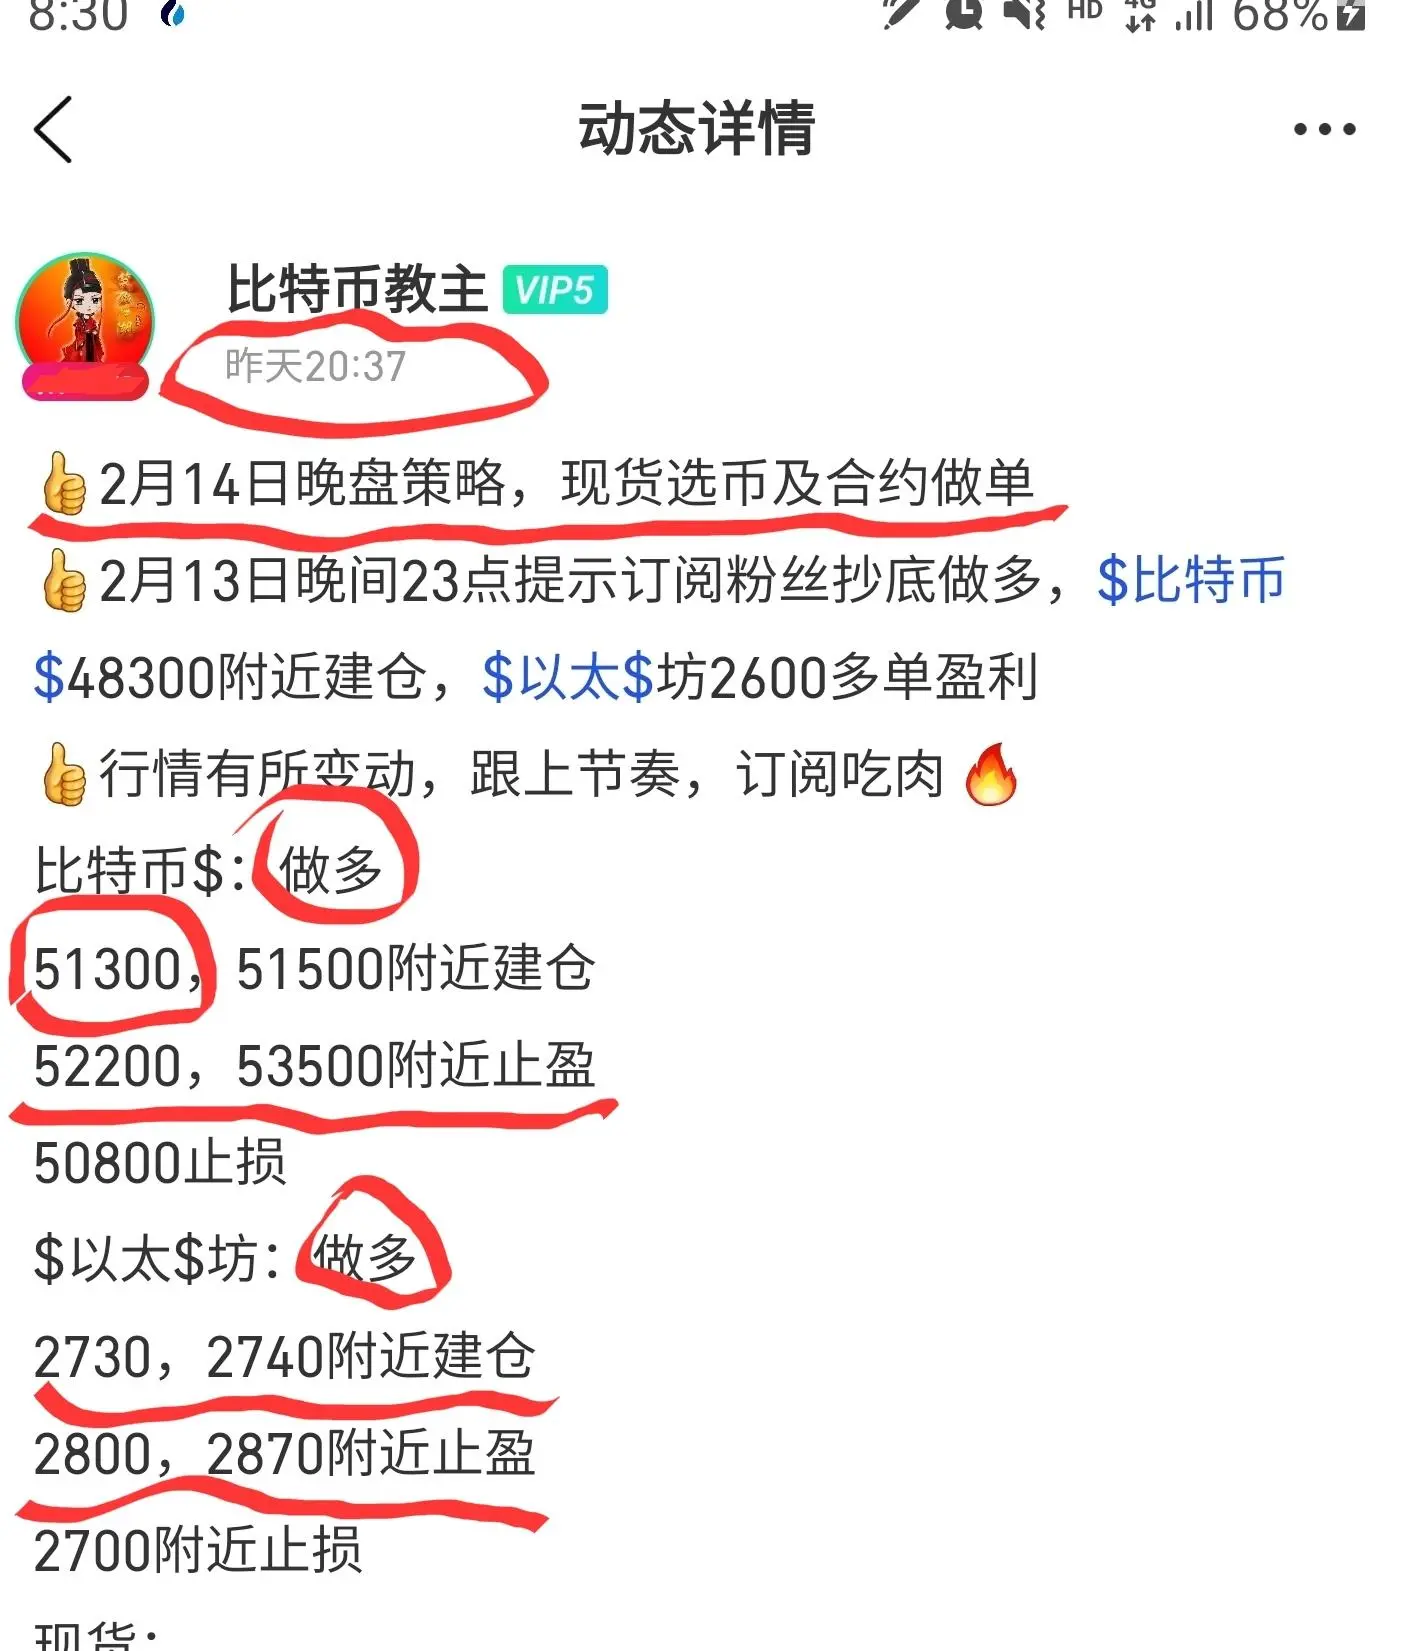
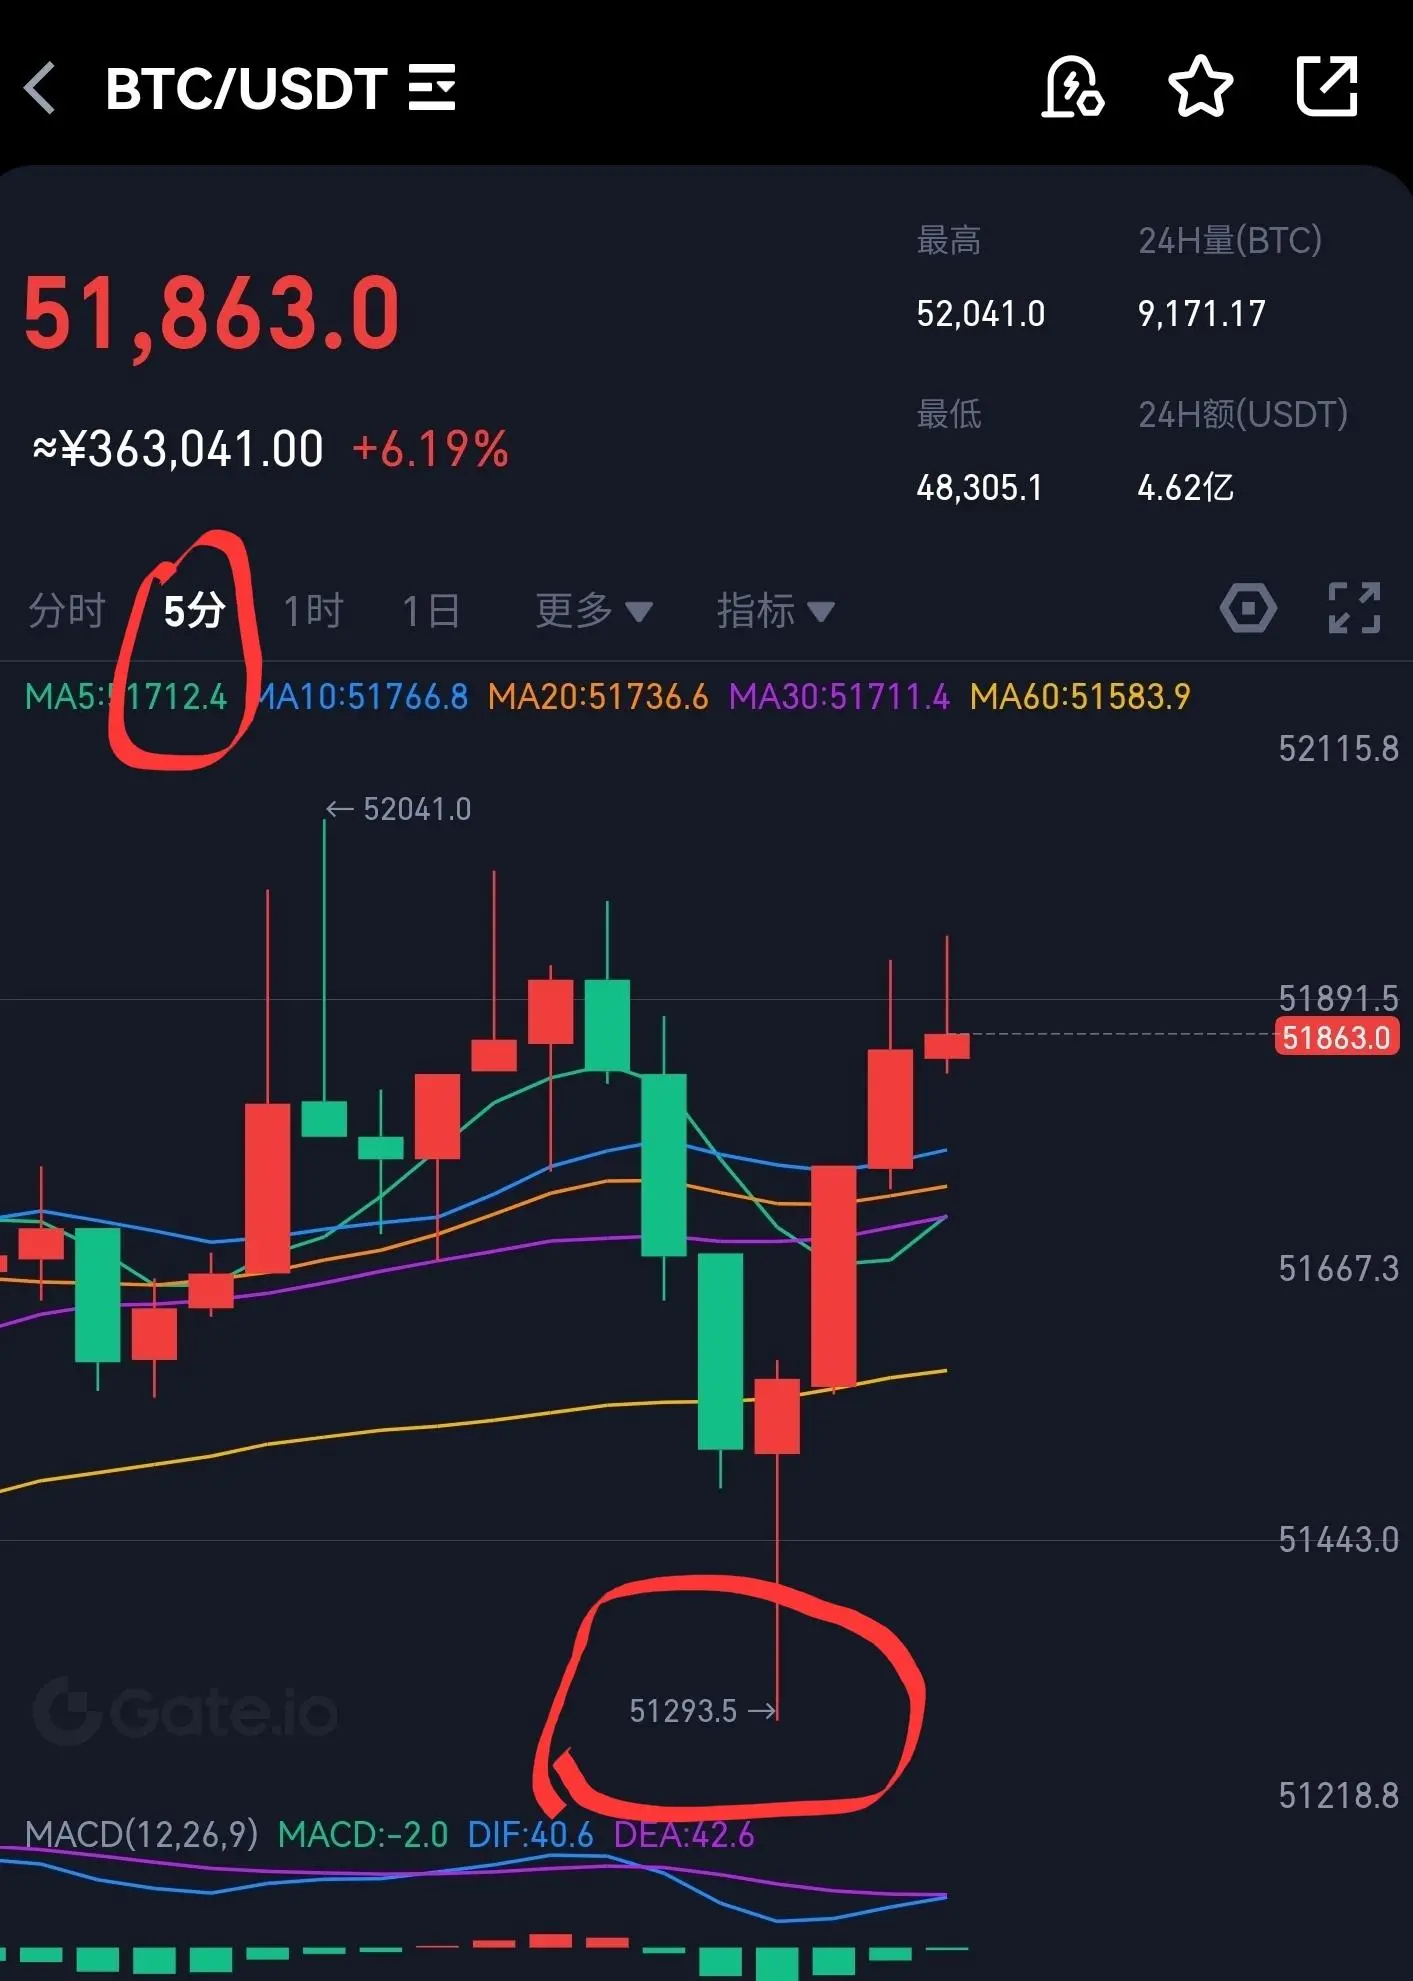
Ambush 100x coin 📈👍On the evening of February 14, the strategy suggested 51300 points to buy the bottom and Long, the actual minimum is 51293 points, see the figure below to verify the dynamic release time, points
👍 The market has changed, keep up with the rhythm, it is recommended that everyone must subscribe 🔥
👍 Click the link to join the fan exchange community: https://gateio.onelink.me/LHro/group?exclusive_chat_room=qWszewtT45
#动态挖矿
View Original👍 The market has changed, keep up with the rhythm, it is recommended that everyone must subscribe 🔥
👍 Click the link to join the fan exchange community: https://gateio.onelink.me/LHro/group?exclusive_chat_room=qWszewtT45
#动态挖矿

- Reward
- 39
- 8
- Repost
- Share
Reddragon06:
BTC $48,500 HER/USDT $2, BTC $38,000 HER/USDT $0.6,
BTC $52000 HER/USDT IS STILL $0.6 WHEN WILL YOU TAKE FLIGHT HER/USDT? 🔥🔥🔥🔥🔥🔥🔥🔥🔥🔥🔥🔥🔥🔥🔥🔥🔥🔥🔥🔥🔥🔥🔥
View More
BITCOINLFG posted on X platform that billionaire MICHAEL DELL, the founder of Dell, may buy a large amount of BTC.#BTC #GateioInto11 #动态挖矿
X-0,96%
- Reward
- 1
- 1
- Repost
- Share
GateUser-849994aa:
We will get there! 💪- Reward
- 1
- 1
- Repost
- Share
Moonspid :
:
To Da Moon 🌕Buy the Dip 🤑WAGMI 💪Keep BUIDL 🧐Wen Lambo? 🏎️Diamond Hands 💎Ne pas FOMO/FUD 🙅BTC Halving to Moon 🚀There's no way around it. Suckers who speculate on cryptocurrency have evolved over the years, thinking they can make big money with their strategies, but forgetting that the market also evolves. Once all the suckers start holding onto their strategies, the market will tell you that strategies are useless, and the only way to make money is to take profits and trade short-term. #BTC #动态挖矿 #WOZX
BTC0,68%
- Reward
- 1
- Comment
- Repost
- Share
Cryptocurrency analyst Jason Pizzino warns BTC (BTC) investors to remain cautious when important support levels are breached.
Pizzino said that BTC faces further downside risks and may lead to a return to the low price level recorded in early 2023. Pizzino stated that the key support level for BTC is $44,600, and dropping below this level brings serious risks for BTC. The analyst said, "Any close below $44,600 is likely to put BTC in trouble." He emphasized that this trouble implies a drop in BTC price to below $40,000.#HotTopicDiscussion #BTC #GateioInto11 #ContentStar #币圈观察员 #动态挖矿
Pizzino said that BTC faces further downside risks and may lead to a return to the low price level recorded in early 2023. Pizzino stated that the key support level for BTC is $44,600, and dropping below this level brings serious risks for BTC. The analyst said, "Any close below $44,600 is likely to put BTC in trouble." He emphasized that this trouble implies a drop in BTC price to below $40,000.#HotTopicDiscussion #BTC #GateioInto11 #ContentStar #币圈观察员 #动态挖矿
BTC0,68%
- Reward
- like
- Comment
- Repost
- Share
👍Morning trading strategy on January 30: urgent notice, subscribe to view long and short points
🙏 Keep up with the rhythm, join the team, and stick to our dreams%00 %00%00 %00 🔥 🔥
First, Favourable information events
The first is the $Bitcoin production cut in April, the second is the $Ether ETF, and the third is the interest rate cut
Second, the direction point
Bitcoin: Many
Build a Position around 42800, 43000
Take profit around 43600, 44400
42400 stop loss
Ethereum: Multi
Build a Position around 2270, 2280
Take profit around 2320, 2360
Stop loss near 2240
3. Spot recommendation
Spot:
$T
View Original🙏 Keep up with the rhythm, join the team, and stick to our dreams%00 %00%00 %00 🔥 🔥
First, Favourable information events
The first is the $Bitcoin production cut in April, the second is the $Ether ETF, and the third is the interest rate cut
Second, the direction point
Bitcoin: Many
Build a Position around 42800, 43000
Take profit around 43600, 44400
42400 stop loss
Ethereum: Multi
Build a Position around 2270, 2280
Take profit around 2320, 2360
Stop loss near 2240
3. Spot recommendation
Spot:
$T
- Reward
- 1
- Comment
- Repost
- Share
#观察员
In the constantly fluctuating and declining Crypto Assets market, the price of BTCBTCUSD may fall to $45,000. Although the BTC price set a new high of $73,750 in March, the current trading price is below $55,000.
Due to the changing BTC Address activity and widespread market decisions, a major adjustment is expected. The BTC Address peaked in November 2023 and then sharply declined in the first quarter of 2024. Short-term holders began reducing the amount of BTC in April, while long-term holders started selling at high prices, indicating that the cycle has reached a peak.
However, the
View OriginalIn the constantly fluctuating and declining Crypto Assets market, the price of BTCBTCUSD may fall to $45,000. Although the BTC price set a new high of $73,750 in March, the current trading price is below $55,000.
Due to the changing BTC Address activity and widespread market decisions, a major adjustment is expected. The BTC Address peaked in November 2023 and then sharply declined in the first quarter of 2024. Short-term holders began reducing the amount of BTC in April, while long-term holders started selling at high prices, indicating that the cycle has reached a peak.
However, the


- Reward
- 3
- Comment
- Repost
- Share
Load More
Join 40M users in our growing community
⚡️ Join 40M users in the crypto craze discussion
💬 Engage with your favorite top creators
👍 See what interests you
Trending Topics
20.03K Popularity
58.41K Popularity
67.49K Popularity
102.15K Popularity
4.54K Popularity
9.48K Popularity
321.13K Popularity
25.57K Popularity
89.77K Popularity
31.27K Popularity
220.13K Popularity
12.43K Popularity
13.92K Popularity
3.33K Popularity
232.32K Popularity
News
View MoreOverview of Major Whales: The bullish whales led by "BTC OG Insider Whale" have not adjusted their positions, while the "Shanzhai Air Force Leader" increased their LIT short position to $9.3 million.
8 h
The Farm2 community founded by AI16Z founder Shaw is about to launch the world's first 3D AI Agent
9 h
Solana founder Toly: Instead of buybacks, a long-term capital structure should be built through staking mechanisms
9 h
Deshare launches on-chain stock "IPO subscription" feature, unlocking a new way to participate in IPOs
9 h
Yili Hua: Before the 2026 big bull market, short sellers close early with small losses, and later close with huge and disastrous losses.
10 h
Pin