
The current market shows obvious bullish strength but short-term overbought characteristics.
Below is a detailed analysis and operational advice based on technical indicators (Bollinger Bands BOLL, MACD, KDJ):
1. Market Trend Analysis
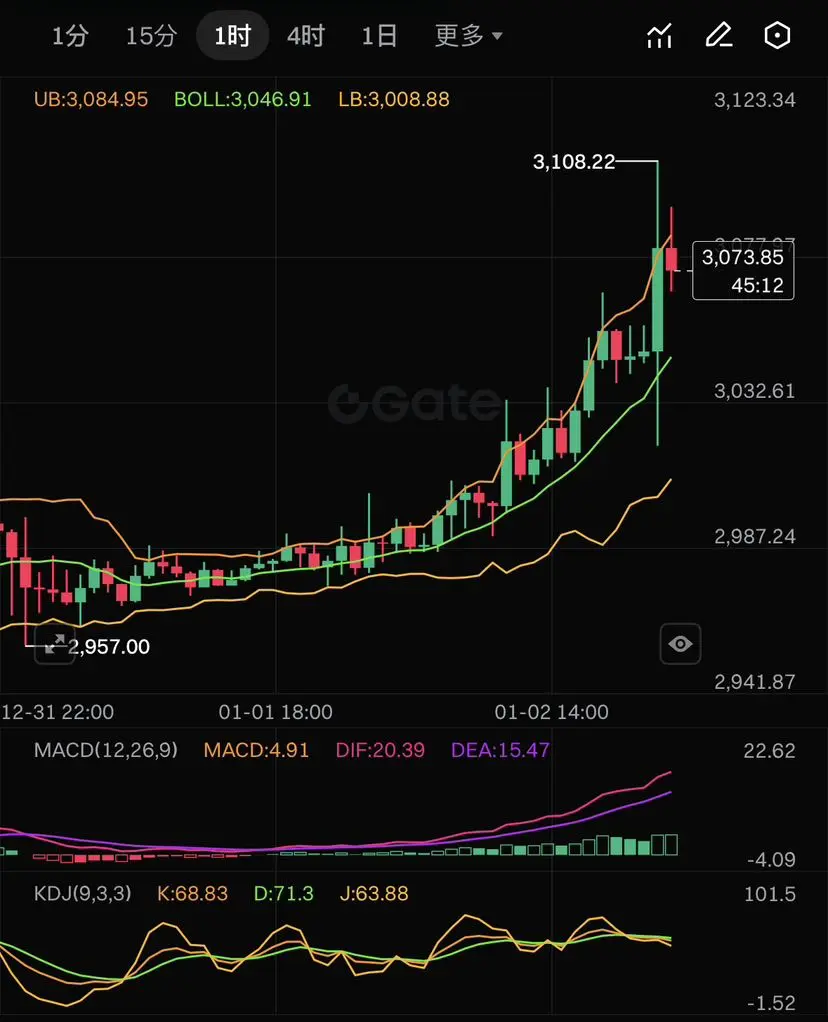
• Daily Level (1D): Trend turning stronger. Price has volume-broken through the middle band of Bollinger Bands (around 2962), moving upward toward the upper band (3051). MACD green bars are expanding, a golden cross has just appeared, indicating a warming trend.
• 4-Hour Level (4H): Very strong momentum. Price is running along the upper band of Bollinger Bands (3
Below is a detailed analysis and operational advice based on technical indicators (Bollinger Bands BOLL, MACD, KDJ):
1. Market Trend Analysis
• Daily Level (1D): Trend turning stronger. Price has volume-broken through the middle band of Bollinger Bands (around 2962), moving upward toward the upper band (3051). MACD green bars are expanding, a golden cross has just appeared, indicating a warming trend.
• 4-Hour Level (4H): Very strong momentum. Price is running along the upper band of Bollinger Bands (3
ETH-0,06%