WanBoss

vip
Crypto Market Researcher
Market Analyst
Airdrop Hunter
No content yet
Pin
Apple subscription Big Boss Click here👇
https://www.gate.com/zh/profile/%E4%B8%87%E8%80%81%E5%A4%A7
View Original
  • Reward
  • 3
  • Repost
  • Share
稳稳的幸福VIP888vip:
2026 Go Go Go 👊
View More
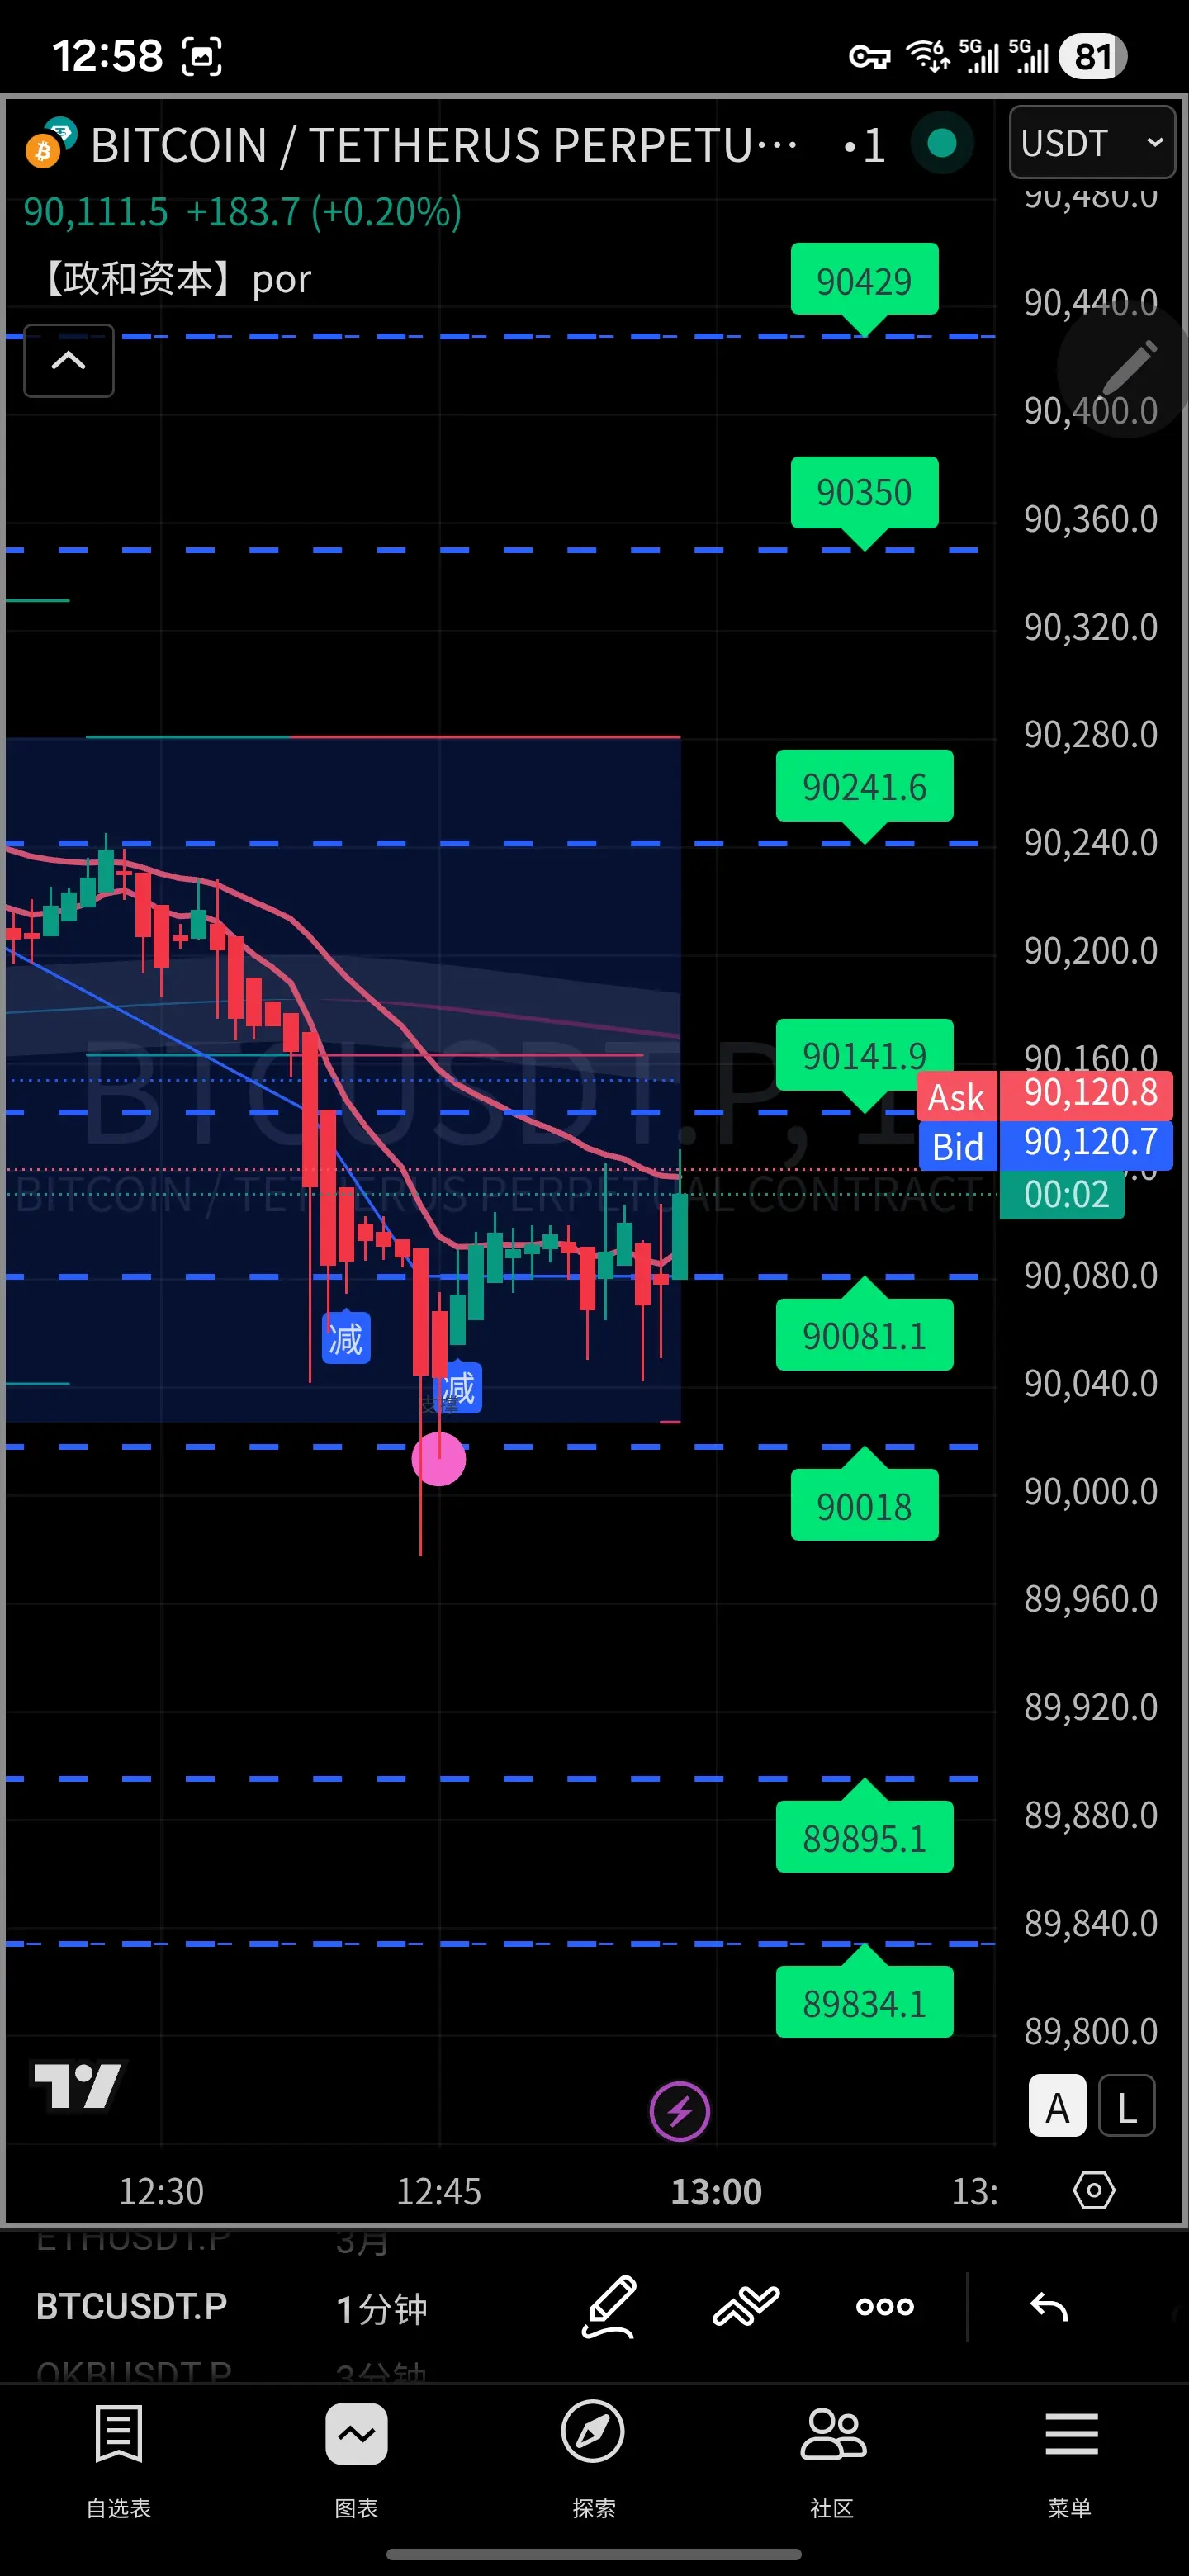
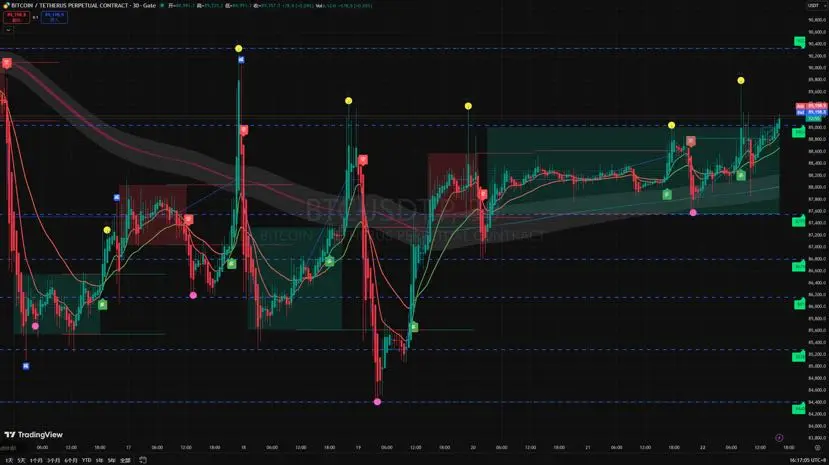
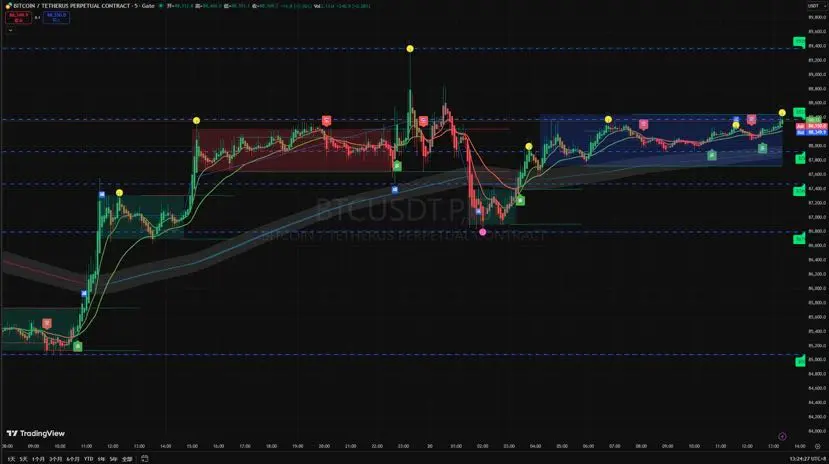
As of January 3, 2026, 13:30, BTC is currently trading at $89,800, with intra-day volatility leaning bullish. The core range is 88,700-90,500, primarily employing high sell and low buy strategies. Breakouts are followed by trend-based position increases, with strict risk control.
Core Key Levels (Professional Grade, Including Technical Basis)
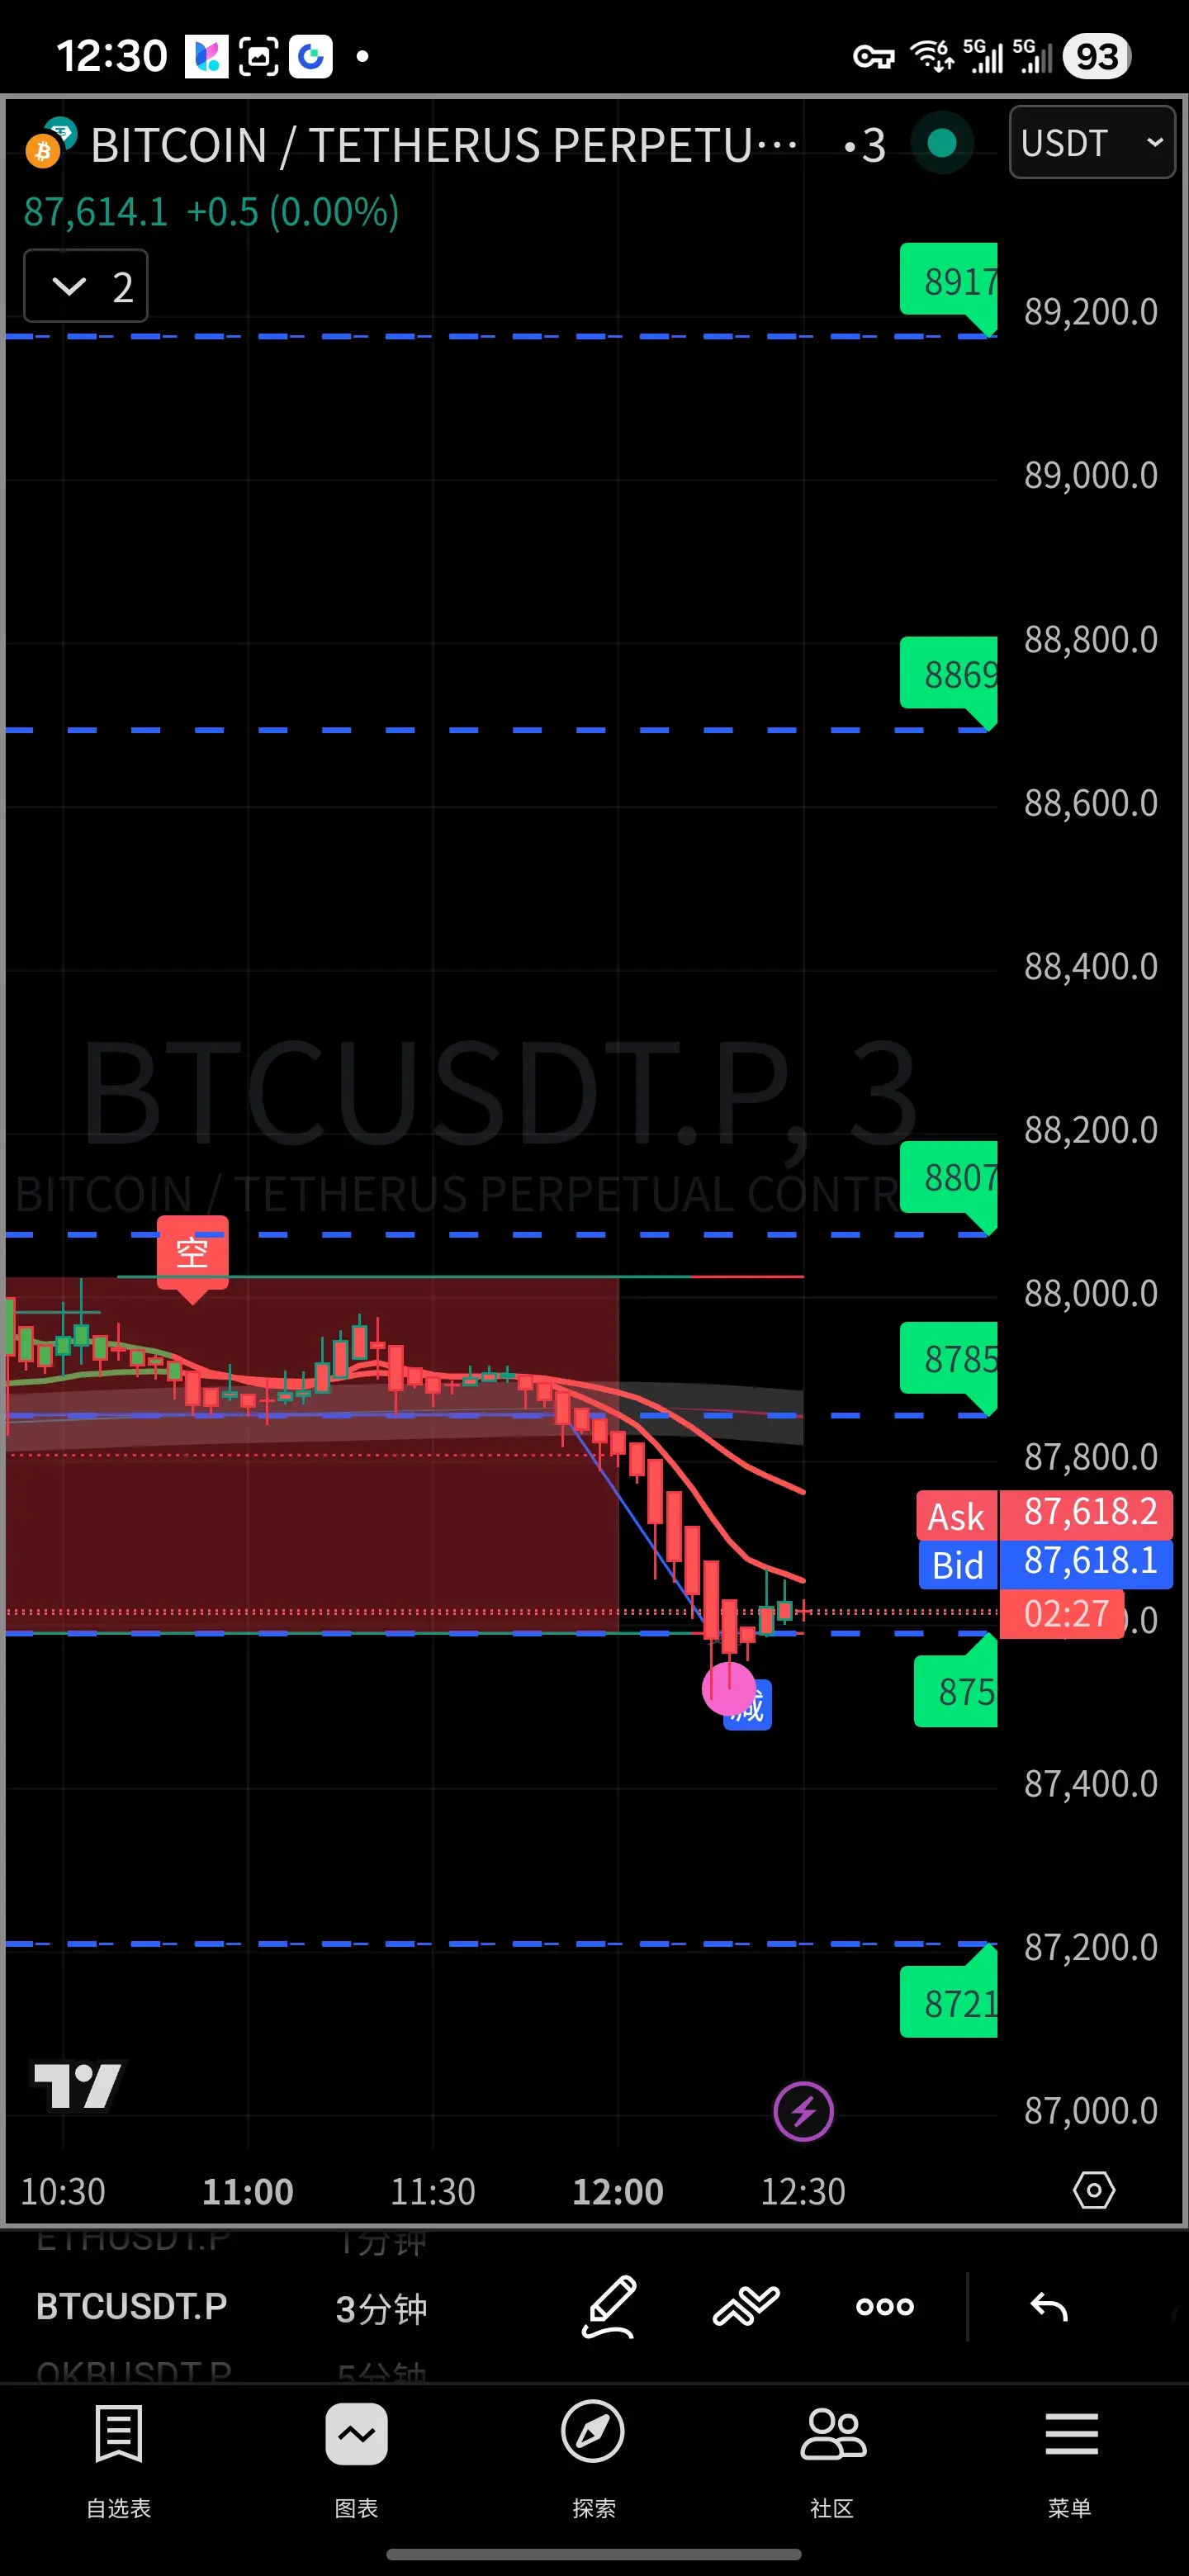
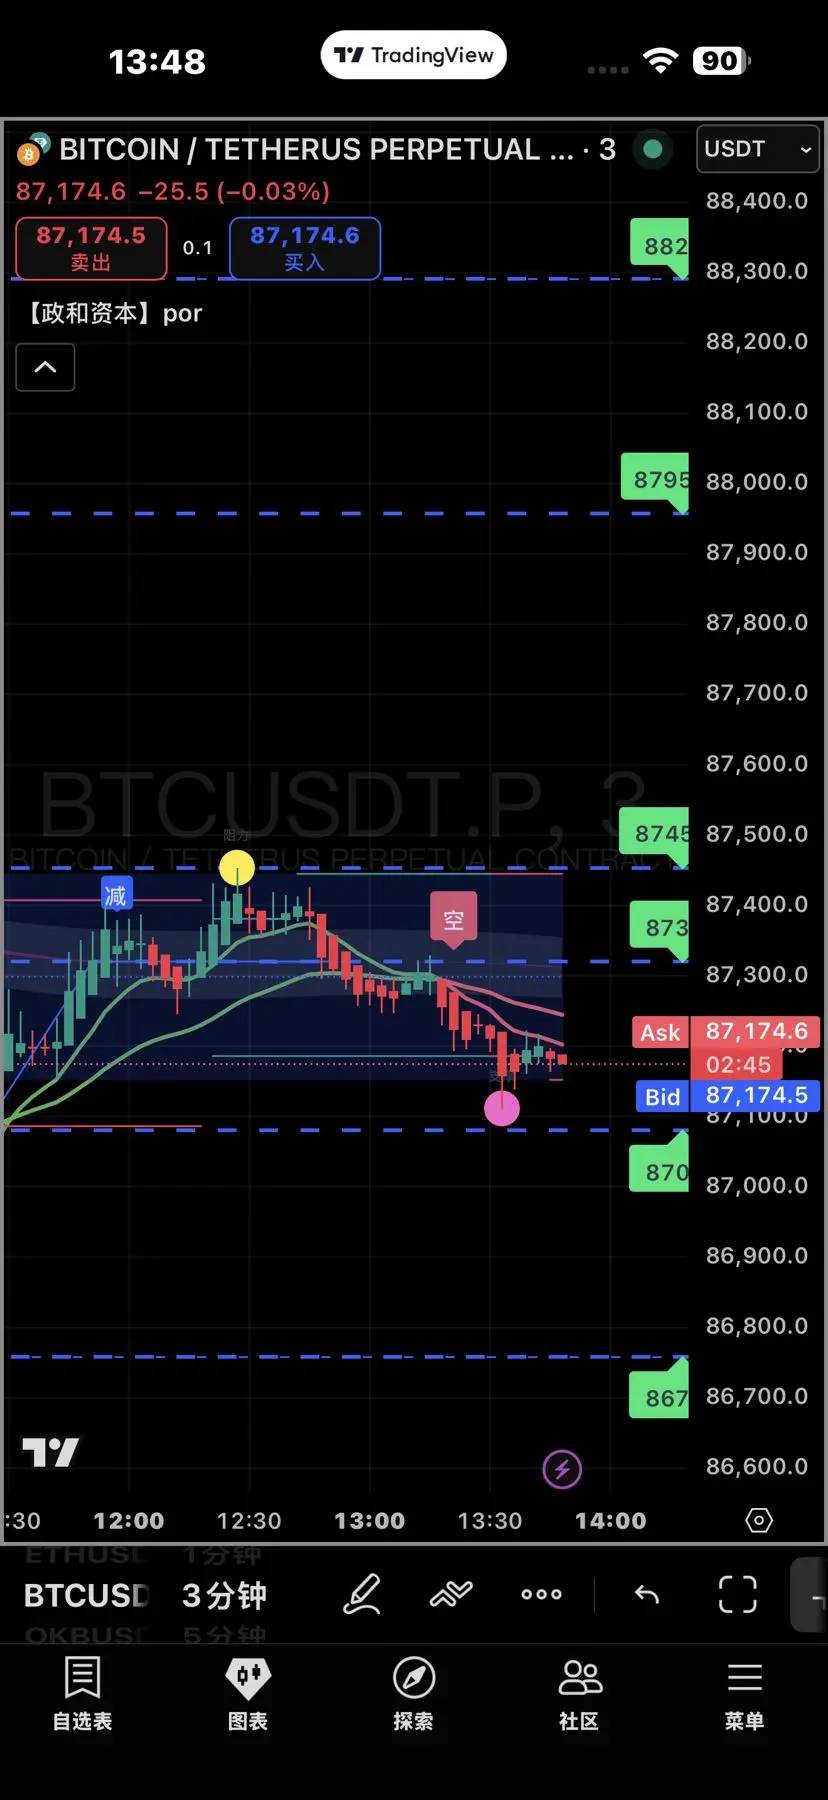
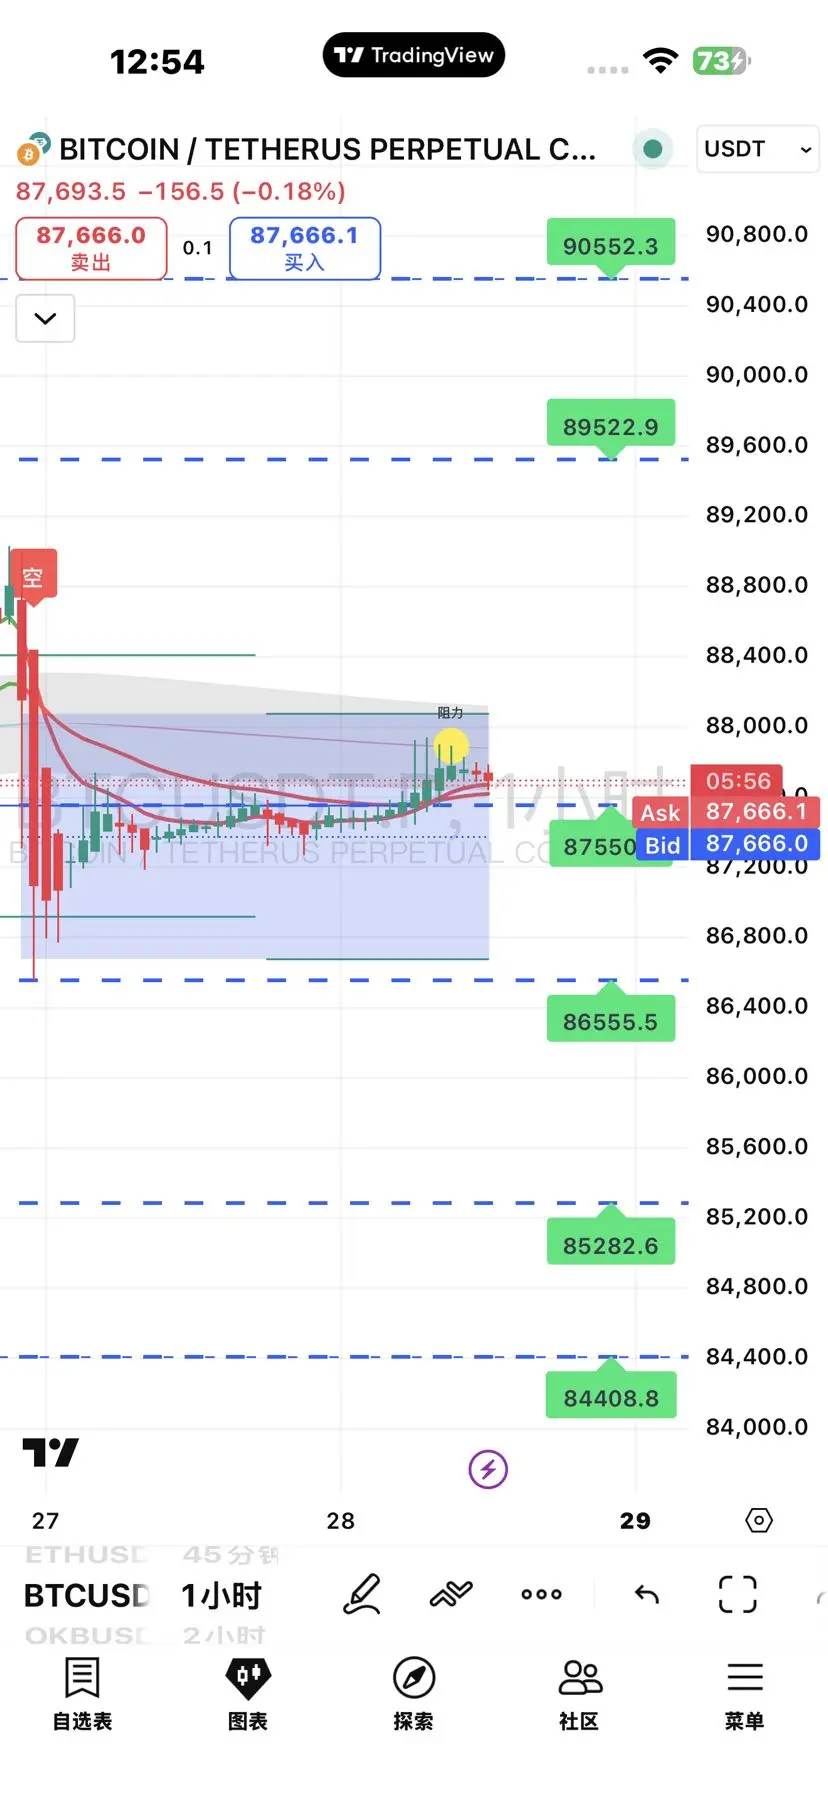
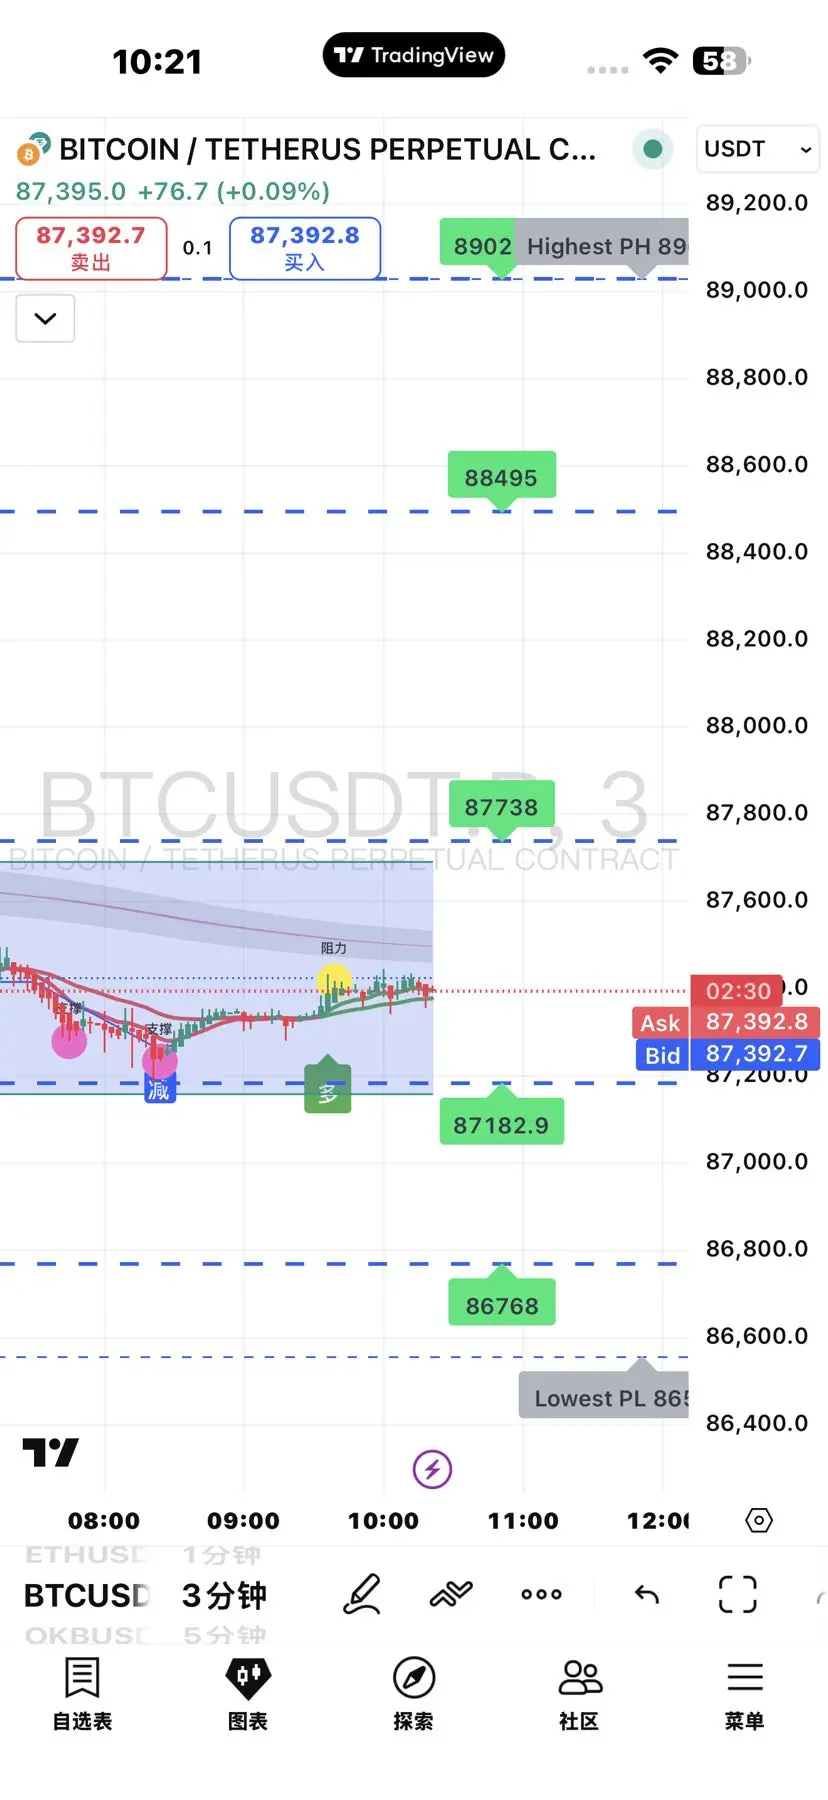
- Support: 88,700 (EMA120 + 4-hour neckline), 88,000 (EMA200 + previous high turning support), 87,500 (dividing line between bulls and bears, a breakdown signals a bearish trend)
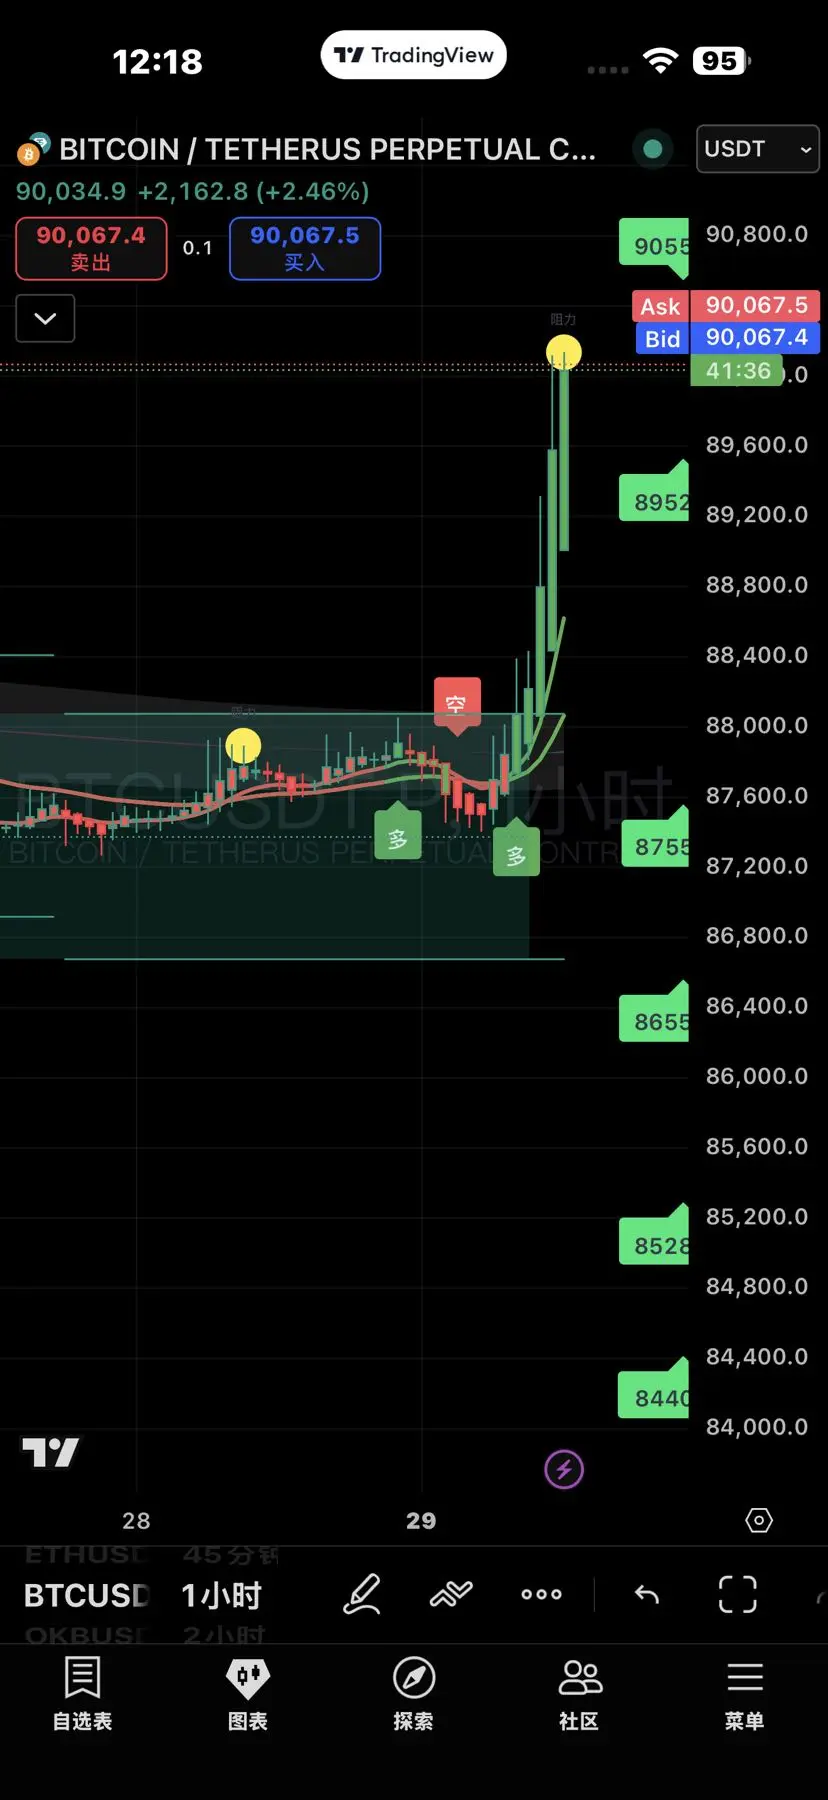
- Resistance: 90,000 (psychological barrier + intra-day high), 90,500 (dense
BTC0,64%
View Original
post-image
  • Reward
  • 7
  • Repost
  • Share
GateUser-10fce37evip:
Vibe at 1000x 🤑
View More
January 2nd BTC Technical Strategy (As of 12:40, current price approximately 88,500)
- Core judgment: Volatile with a slight bearish bias, double top + double cycle death cross resonance, weak rebound
- Intraday range: 86,800-88,800; key resistance at 88,800/89,000; key support at 87,000/86,800
- Indicator signals: 4-hour double top + MACD death cross, daily chart with 3-day long upper shadow, heavy selling pressure at 90,000, 7/30 moving averages (88,307/88,104) will form a death cross, rebound lacks volume
Trading strategy (short-term, risk control prioritized)
1. Mainly shorting at high lev
BTC0,64%
View Original
post-image
  • Reward
  • Comment
  • Repost
  • Share
January 1 BTC Technical Strategy (As of 12:30, Price approximately 87,800 USD)
Core Judgment: Daily chart is bearish + 4-hour consolidation + hourly chart weak bullishness. During New Year's low liquidity, focus on trading within the 87,000–89,000 USD range, with key levels at 88,800 (strong resistance) and 87,000 (weak support). Breakouts to be followed with trend.
Key Price Levels (USD)
- Resistance: 88,800 (4-hour upper band) → 90,000 (psychological level) → 92,000 (medium-term resistance)
- Support: 87,000 (intraday weak support) → 86,000–86,500 (medium-term moving averages) → 85,769 (100-
BTC0,64%
View Original
post-image
  • Reward
  • 1
  • Repost
  • Share
Next0vip:
Hop on board!🚗
As of 14:00 on December 31, 2025, BTC is experiencing short-term volatility with a weak bias and an unclear direction; the core range is $86,500–$88,800. The year-end closing and large option expirations suggest a focus on range trading and observation, with strict position control (≤20%).
Core Market Overview (as of 14:00)
- Price: approximately $87,400, up about 0.5% in 24H, with reduced volume and oscillation; liquidity is low at year-end
- Main Trend: Daily EMA30 resistance, moving averages in a bearish alignment, MACD dead cross, bearish dominance
- Rhythm: 4-hour MACD shows shrinking bea
BTC0,64%
View Original
post-image
  • Reward
  • 1
  • Repost
  • Share
GateUser-d4344eaevip:
2026 Go Go Go 👊
December 30th BTC short-term oscillation is slightly bearish, mainly focusing on rebound highs and short-term support for low positions; key boundaries: 88500 (breaks to turn bullish), 86500 (breaks to turn bearish).
1. Core Price Levels (12/30 14:00, current price ≈ 87200)
• Resistance: 87800 (4h EMA30), 88500 (upper boundary of range / 100EMA), 89500 (previous high), 90000 (integer threshold)
• Support: 87000 (lower boundary of range), 86500 (strong support), 85800 (100-week EMA), 84000 (previous platform)
2. Technical Indicators (4h+1h)
• 4h: Price below EMA30/100, RSI≈43 (weak), MACD below
BTC0,64%
View Original
post-image
  • Reward
  • 2
  • Repost
  • Share
TheElegantLittleWaterMonstervip:
Experienced driver, guide me 📈
View More
As of 2025-12-29 12:00 (UTC+8), BTC current price is approximately $87,600. The daily chart shows a bearish arrangement, with a four-hour range-bound correction. Year-end trading volume is sluggish, making "spikes" easy. The strategy mainly focuses on range high selling and low buying, with risk control as a priority.
1. Quick Overview of Core Technical Aspects
• Daily: Price below 20/50/100-day moving averages, MACD dead cross, RSI≈42 (neutral leaning bearish), Bollinger Bands narrowing, low volatility.
• 4-Hour: Range correction, MACD shows a bullish crossover at low levels but weak momentum
BTC0,64%
View Original
post-image
  • Reward
  • 1
  • Repost
  • Share
川普我孙子vip:
Merry Christmas, let's get bullish! 🐂
December 28th BTC Core Conclusion: Narrow fluctuation between $87,200 and $88,000, short-term slightly bearish with no strong trend, mainly trading within high reward-to-risk zones, total position ≤30%, beware of weekend low liquidity spikes and false breakouts without volume.
1. Key Levels (4H/Daily chart, as of 12:00 on December 28th, current price approximately $87,700)
• Support: 87200 (4H strong support / high trading volume zone), 87000 (psychological level), 86500 (strong support), 85900 (stop-loss level)
• Resistance: 87900-88000 (20-day moving average / rebound high), 88500 (previous
BTC0,64%
View Original
post-image
  • Reward
  • Comment
  • Repost
  • Share
As of December 27, 2025, 10:00 (UTC+8), BTC is quoted at approximately $86,900, with short-term volatility leaning weak, in a core range of $86,000-$88,000. Holiday liquidity is low, and the direction awaits a breakout.
Core Views
• Trend: No strong trend on the 4H chart (ADX<25), -DI slightly stronger than +DI; price faces resistance below the 20-day moving average (88,900 USD).
• Pattern: 4H shows converging oscillation, mid-term weekly trend is somewhat bearish; beware of downside breakout risks.
• Sentiment: Fear and Greed Index at 23 (Extreme Fear), weekend trading is light, funds are on
BTC0,64%
View Original
post-image
  • Reward
  • Comment
  • Repost
  • Share
December 26 BTC Technical Analysis (11:00, China Time)
• Price Snapshot: approximately $87,600 USD, narrow fluctuations, low trading volume; about $28.5 billion BTC/ETH options expiring on Deribit, significantly increasing volatility risk.
• Key Levels: Resistance at 88,000-89,000, strong resistance at 90,000; support at 87,000, 86,000-86,500, breaking below targets 80,500 (November low).
• Chart Patterns and Indicators: Daily chart shows an ascending wedge (bearish), EMA20/50 resistance; 4-hour RSI≈43 neutral to weak, MACD bearish shrinking, OBV declining, bullish momentum insufficient.
Actio
BTC0,64%
View Original
post-image
  • Reward
  • Comment
  • Repost
  • Share
December 25, 2025 ETH Christmas Technical Analysis (11:00, UTC+8)
• Current Price: around 2,930. During the Christmas holiday, liquidity is extremely low, with BTC moving sideways; on-chain chips are scarce but contracts are de-leveraging, which may lead to “volume shrinking and needle insertion”
• Core Judgment: Daily chart shows slight bearish oscillation, 4H/2H lack clear direction; mainly trading within range, strictly controlling positions, switching to trend strategy after volume breakout
🎯 Key Price Levels (USD, layered precision)
• Support: 2,900 (intraday strong support/psychological
ETH-0,18%
View Original
post-image
  • Reward
  • Comment
  • Repost
  • Share
As of December 24, 13:30, the current price of BTC is approximately 87200 USD, the daily chart shows a bearish-dominated weak oscillation pattern, with low liquidity during the Christmas holiday, focusing on high shorts and supporting low longs, strictly controlling positions and stop loss.
Key Price Level (Multi-Period)
• Support: 87000 (intraday) → 85200 (4H) → 84000-84500 (daily strong support) → 80600 (extreme defense)
• Resistance: 87800 (4H midline) → 88500 (Fibonacci) → 90000 (psychological/trend line) → 94588 (daily confirmation level)
Daily Chart Indicator Overview
• RSI 44.57 (neutra
BTC0,64%
View Original
post-image
  • Reward
  • 2
  • Repost
  • Share
LanQiqiGevip:
Can you not think so, baby, why do you still love your mother so much
View More
ETH trading strategy for December 23
1. Bullish Strategy
• Entry: Stabilize and open positions at 3018-3024 USD
• Stop loss: 2998 USD (key support at 3000)
• Target: ① 3050 USD (reduce position by 50%); ② 3080 USD (remaining take profit)
• Position increase trigger: closes above 3050 USD on a 4-hour chart with increased volume
2. Short Selling Strategy
• Entry: 3046-3050 USD under pressure to open positions
• Stop Loss: 3060 USD (break 3050 key resistance)
• Target: ① 3030 USD (reduce position by 50%); ② 3000 USD (remaining take profit)
• Position increase trigger: Close below 3000 USD for 2 h
ETH-0,18%
View Original
post-image
  • Reward
  • Comment
  • Repost
  • Share
As of 2025-12-22 16:00 (UTC+8), BTC is currently reported at 88150 USD, with a 24h Fluctuation of 87680-88820 USD, showing weak oscillation, waiting for a breakout.
Key price level
• Support: 87700 USD (24h low) → If broken, look at 86000 USD (daily key support)
• Resistance: 88800 USD (24h high) → Breakthrough looking at 89800 USD (4h previous high)
• Boundary: 88000 USD, stand firm on the bullish side, if lost, turn bearish.
Multi-Period Indicator
• Daily: RSI≈38 (weak), MACD death cross continues, bears dominate, trading volume is low.
• 4 hours: KDJ turning at a low level, Bollinger Bands
BTC0,64%
View Original
post-image
  • Reward
  • Comment
  • Repost
  • Share
📌 As of December 21, 10:30, SOL is currently at 131.2, moving sideways at a low level, with 133 being a short-term turning point. Without volume, it is difficult to break the situation; first, we will look at the range fluctuation.
Key Price Level (USD)
• Resistance: 133 (EMA15) → 135 (psychological level) → 138 (Bollinger band middle line) → 142 (previous high)
• Support: 129.5 (intraday low) → 127 → 125 (strong support) → 123.8 (Bollinger band lower bound)
Multi-Timeframe Indicators and Patterns
• Daily: EMA15/30 bearish arrangement, MACD dead cross with narrowing green bars, RSI around 43
SOL0,47%
View Original
post-image
  • Reward
  • Comment
  • Repost
  • Share
BTC December 20th(22:00 UTC+8) Technical Analysis
Government and Core Data
Current Price: 87,799.9 USDT (+3.71%, 24h)
Today’s Range: 85,110-89,510 USDT, Volatility 5.16%
RSI(14): 36-44 (Daily oversold, hourly correction)
MACD: Bearish crossover, decreasing green histogram (short-term rebound signal)
Key Moving Averages: Price well below EMA20(91,640) and EMA50(111,648)
Trend Analysis
Daily Level: Clear bearish alignment, has broken below the key ascending wedge, confirming a mid-term downtrend
• MACD bearish crossover persists, green histogram not yet significantly shrinking, bearish momentum
BTC0,64%
View Original
post-image
  • Reward
  • Comment
  • Repost
  • Share
As of 11:40 on December 18 (UTC+8), the current BTC price is approximately 85,800. The daily chart is dominated by a bearish trend, with weak rebounds during the 4-hour oversold conditions. Overall, the market is oscillating weakly, mainly trading rebounds to short positions, with light positions at low levels for trying long positions.
Core Price Levels and Key Multi-Period Zones
• Daily: Support at 85,000 (Fibonacci 0.786) / 83,500; Resistance at 88,000 / 90,000-91,000 (strong resistance)
• 4-Hour: Support at 85,200 / 84,000; Resistance at 87,500 / 89,000
• 2-Hour: Support at 85,000; Resista
BTC0,64%
View Original
post-image
  • Reward
  • Comment
  • Repost
  • Share
On December 15, 2025, BTC overall shows a oscillating and weak trend. The daily chart indicates a clear bearish trend, with the short-term range trading. The specific technical analysis is as follows:
1. Overall Trend and Moving Averages: The daily chart displays a pronounced bearish trend, with the three EMA lines in a bearish alignment, and a death cross signaling further downside. However, BTC is still within a large range of $85,000 to $94,500, having touched a low of $87,575 in the morning and quickly rebounded. As of around 13:00, the price has returned to approximately $89,600, and has
BTC0,64%
View Original
post-image
post-image
  • Reward
  • Comment
  • Repost
  • Share
On December 11, 2025, ETH surged and then retraced, remaining in a short-term correction phase. The bulls and bears are fiercely competing. Based on technical analysis, the following trading strategies and precise entry points are provided for reference only and do not constitute investment advice:
1. Short-term Long Strategy: Consider opening long positions in the $3240 - $3250 range, with a stop-loss set at $3190 - $3200, risking 30 - 50 points. The first target is $3300 - $3340; if broken, further upside targets are $3390 - $3400. If ETH can stabilize above $3400, subsequent targets include
ETH-0,18%
View Original
post-image
post-image
  • Reward
  • 1
  • Repost
  • Share
Long-shortEquityStrategyMastervip:
Empty ether is sent back to the west
On December 10, 2025, ETH showed a strong upward trend, with a 24-hour increase of nearly 7%. The current price is around $3,365, leading the rise among major coins. Wan Laoda's technical analysis and strategy are as follows:
View Original
Subscribers Only
Subscribe now to view exclusive content
  • Reward
  • Comment
  • Repost
  • Share
On December 9, 2025, after BTC surged to $92,000, it quickly pulled back and briefly fell below the $90,000 level. The battle between bulls and bears is intense and is being influenced by cautious market sentiment ahead of the Federal Reserve's interest rate decision. Technical indicators across different timeframes show signs of consolidation and accumulation. The detailed analysis is as follows:
1. Daily chart: The MACD fast and slow lines remain above the zero axis, maintaining a golden cross, but bullish momentum has weakened, and the market has entered a consolidation phase. The RSI (14)
BTC0,64%
View Original
post-image
post-image
  • Reward
  • Comment
  • Repost
  • Share
  • Pin

Trade Crypto Anywhere Anytime
qrCode
Scan to download Gate App
Community
  • 简体中文
  • English
  • Tiếng Việt
  • 繁體中文
  • Español
  • Русский
  • Français (Afrique)
  • Português (Portugal)
  • Bahasa Indonesia
  • 日本語
  • بالعربية
  • Українська
  • Português (Brasil)