TianshengTrading

vip
Age 0.1 Yıl
Peak Tier 0
No content yet
Conclusion: High-level Sideways fluctuations, accompanied by a fall.
Resistance above: 2980/3100/3180
Support levels: 2880/2760/2680
Bollinger Bands: The current 4-hour chart shows the upper Bollinger Band line opening upwards, with the middle line and lower line trending slightly horizontal upwards, corresponding to prices 2956--2822--2689.
The 4-hour chart shows a short-term moving average trend moving upwards, with the current price running between the MA5 and the upper trend line, currently testing the upper trend line at a price of 2956. From the hourly chart perspective, the short-term m
View Original
post-image
  • Reward
  • Comment
  • Repost
  • Share
Conclusion: fall
Resistance above: 2980/3100/3180
Support levels: 2880/2760/2680
Operation Strategy:
High-altitude strategy: If the rebound does not effectively stabilize near 2980, establish a head position short order, with a supplementary position near 3180. If it breaks and stabilizes above 3180, stop loss.
First take profit: 2900/Second take profit: 2820
Long strategy: If the pullback does not effectively fall below around 2880, establish the primary long position, and the replenishment point is near 2680. Stop loss if it falls and stabilizes below 2680.
First Take Profit: 2980 / Second T
View Original
  • Reward
  • Comment
  • Repost
  • Share
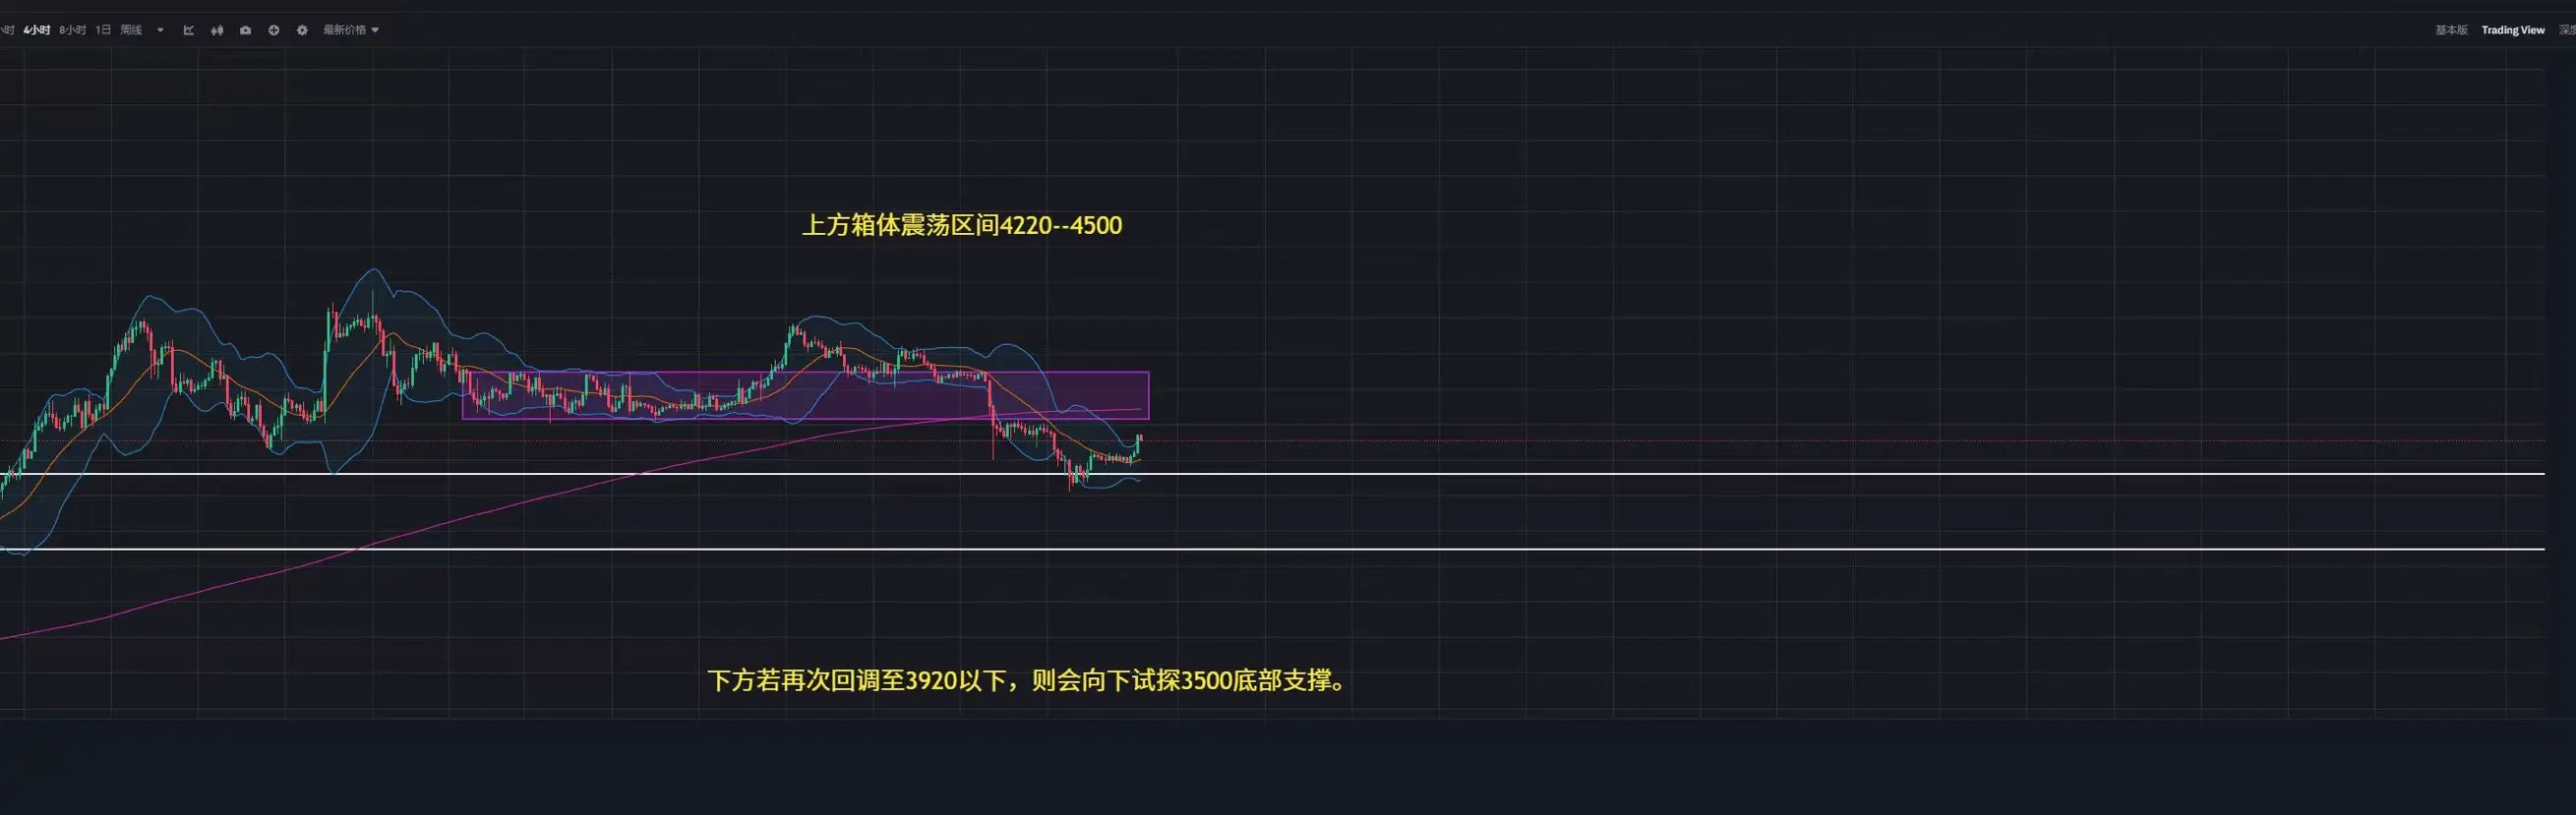
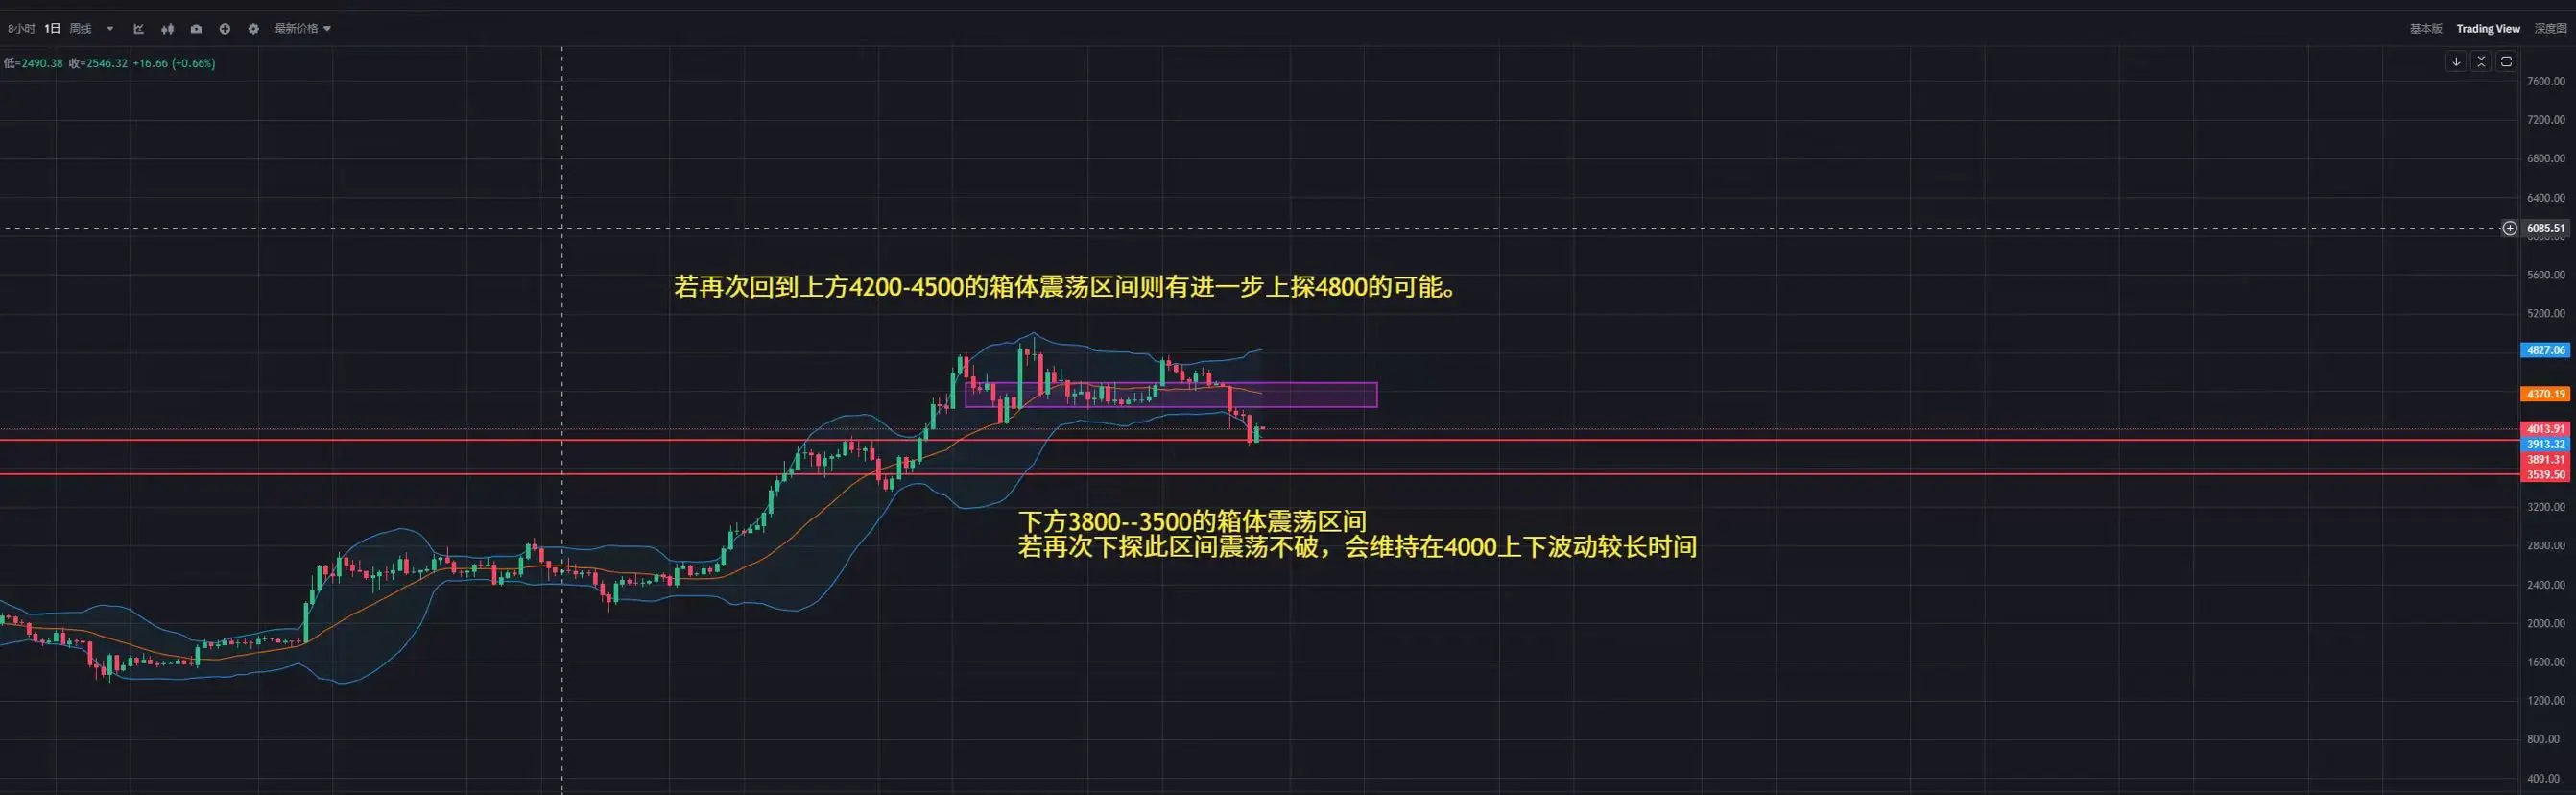
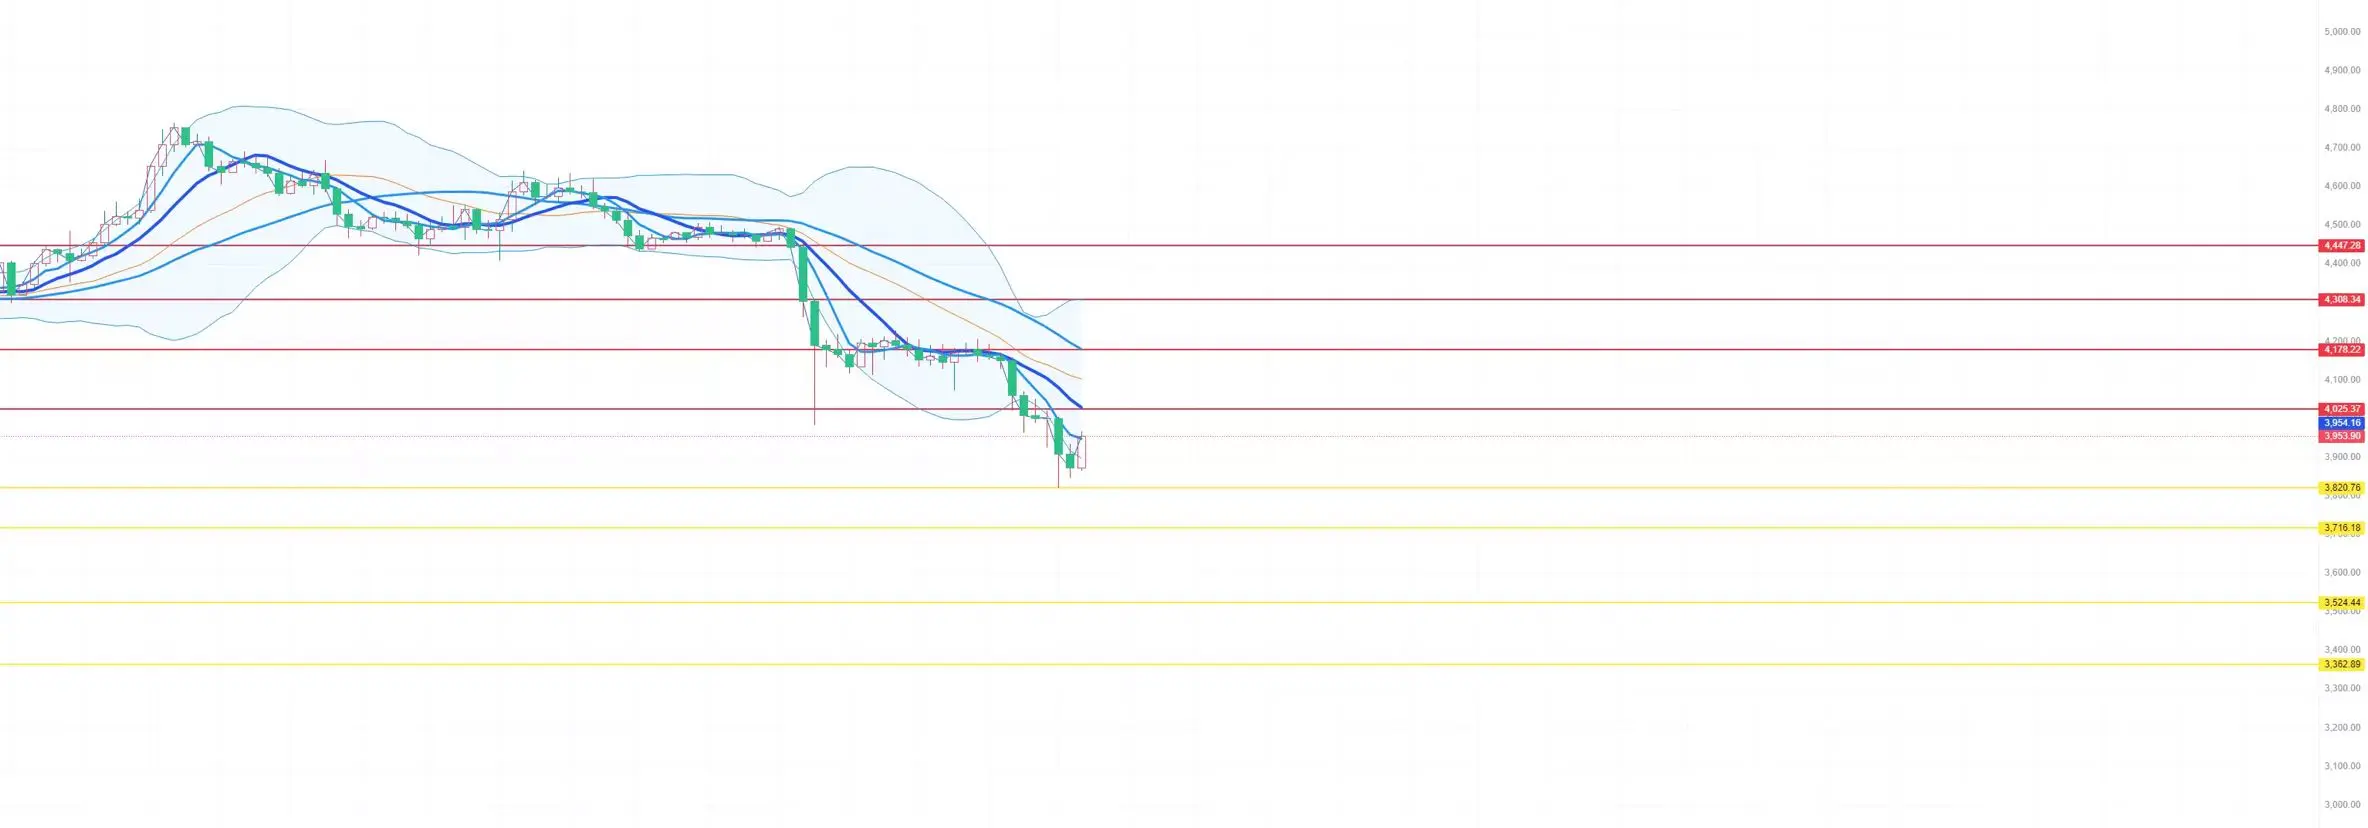
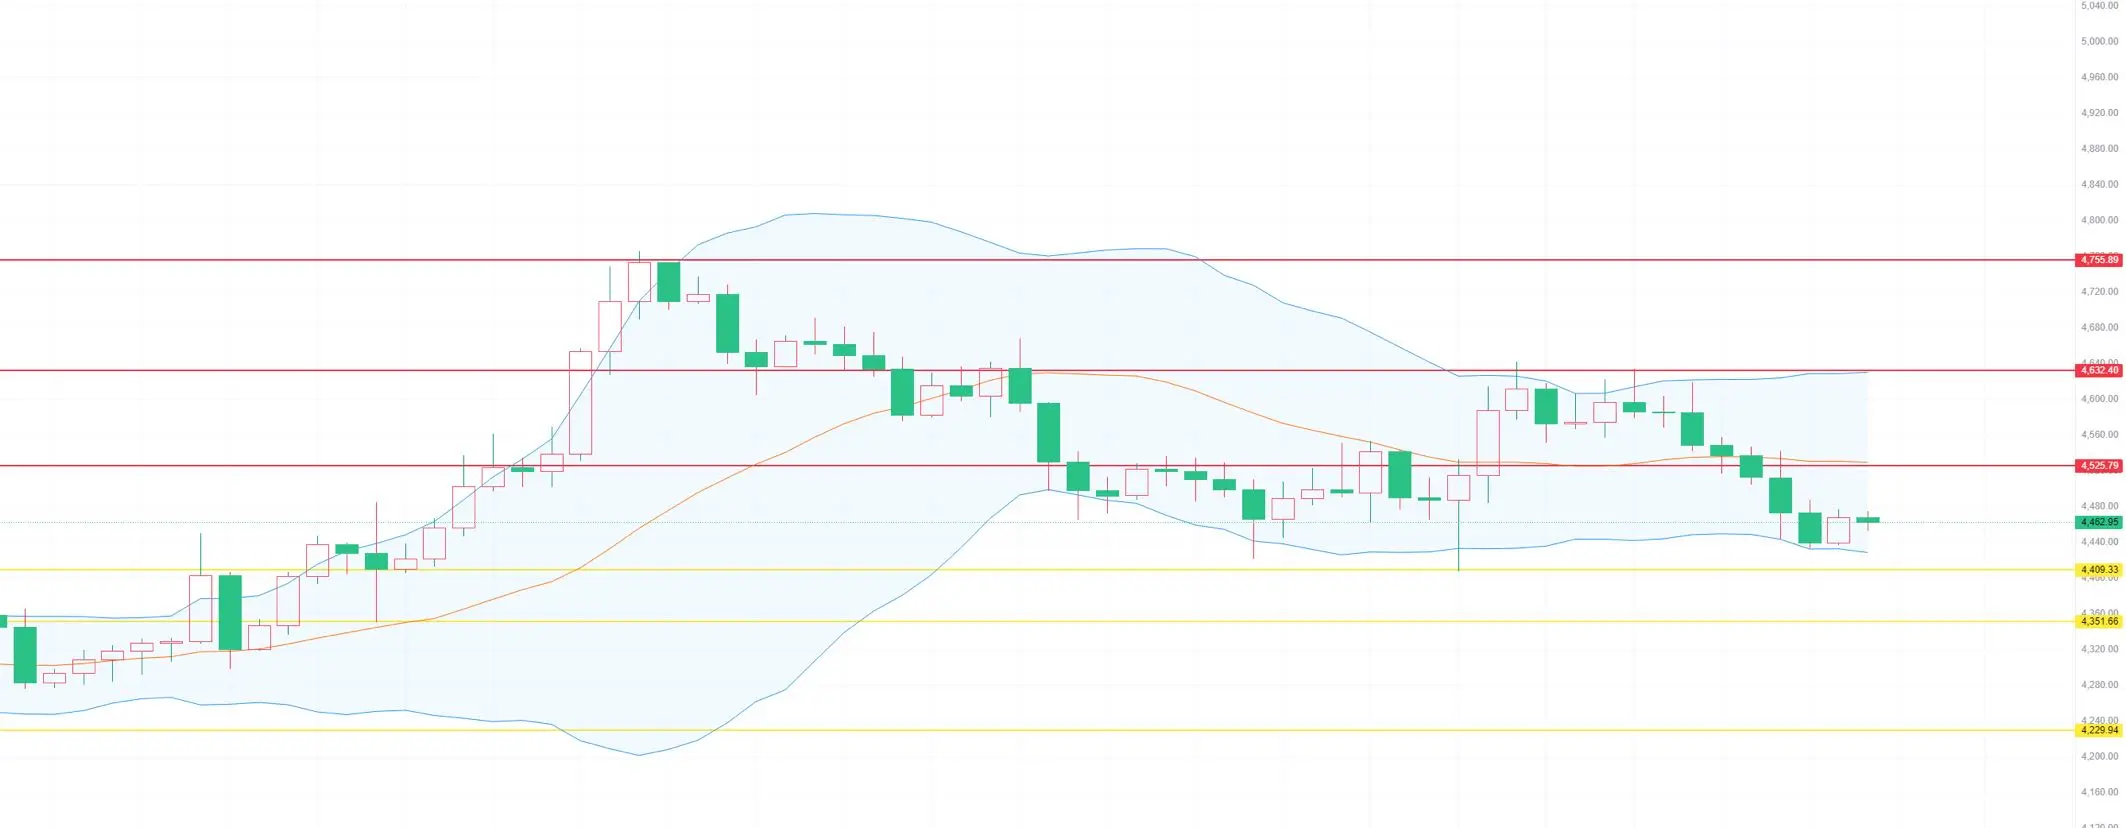
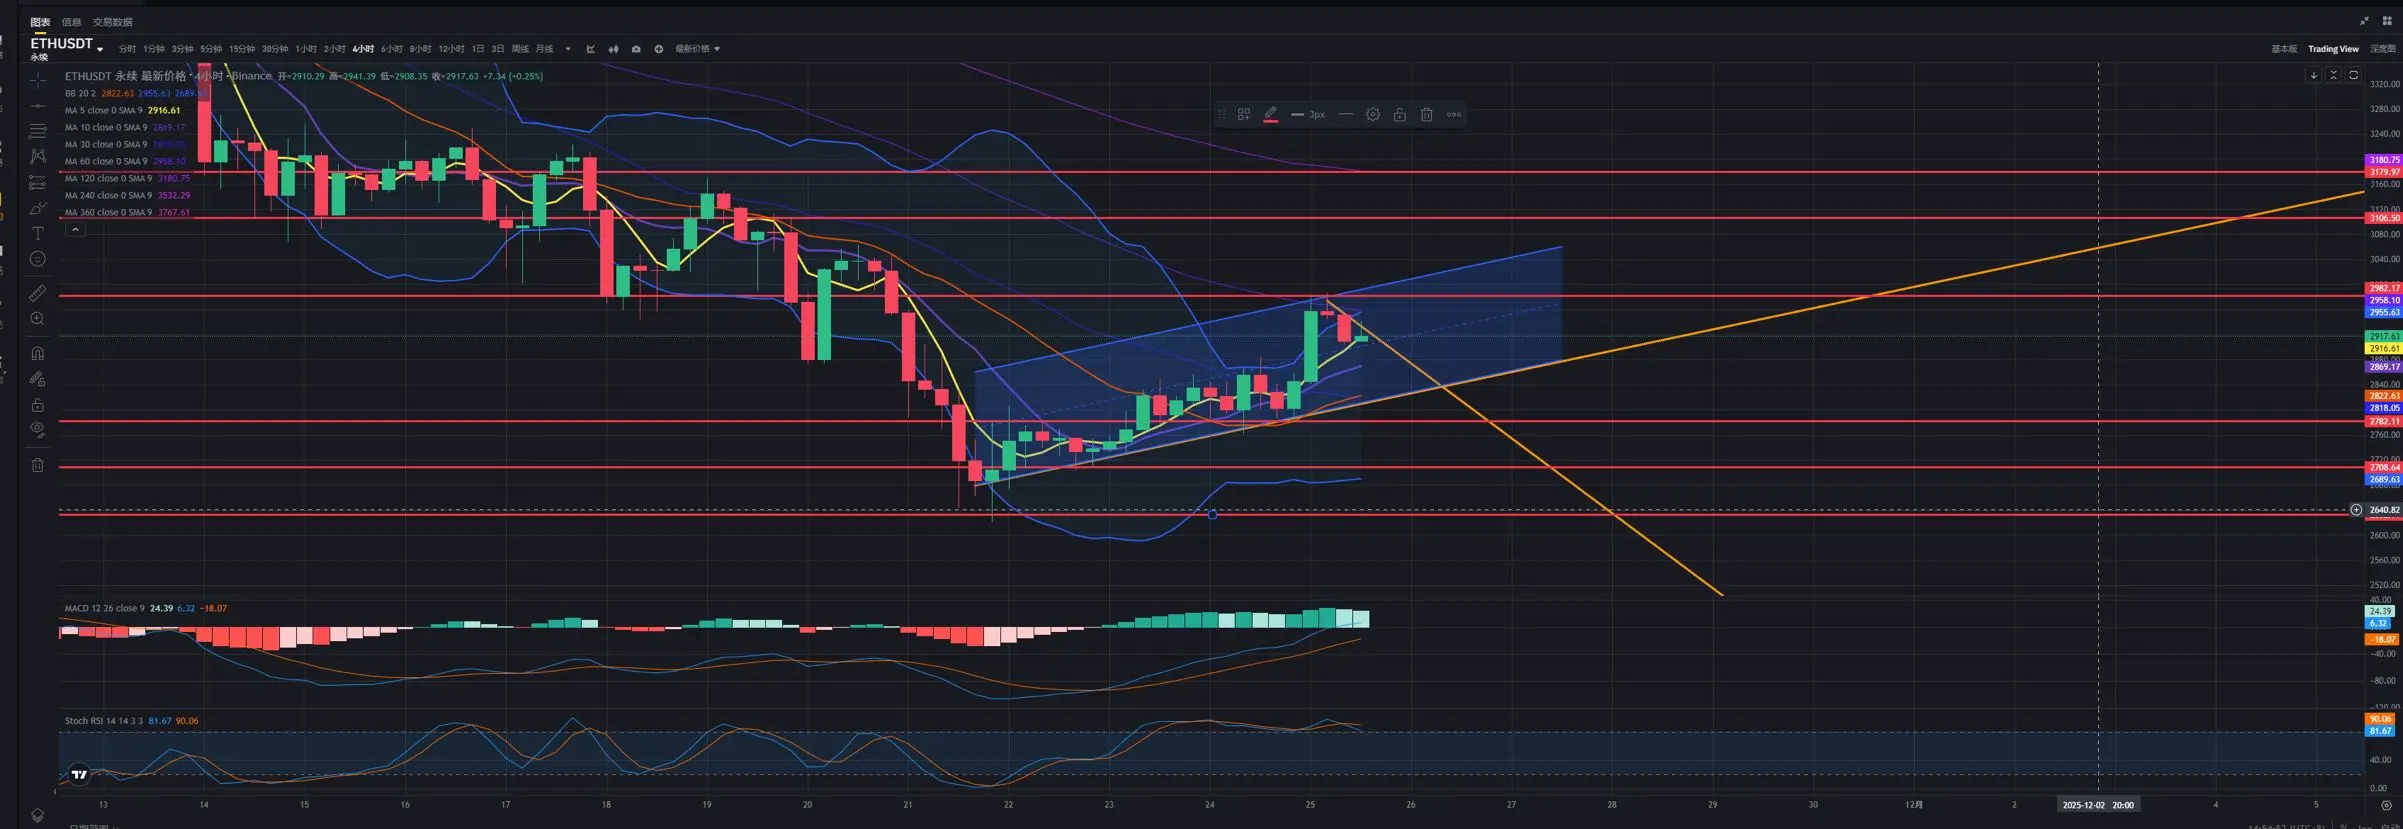
Based on the 4-hour chart, the Bollinger Bands are currently trending upward with the three lines moving higher. The price is testing the upper band and pulling back, with the three lines corresponding to prices of 3490, 3371, and 3252.
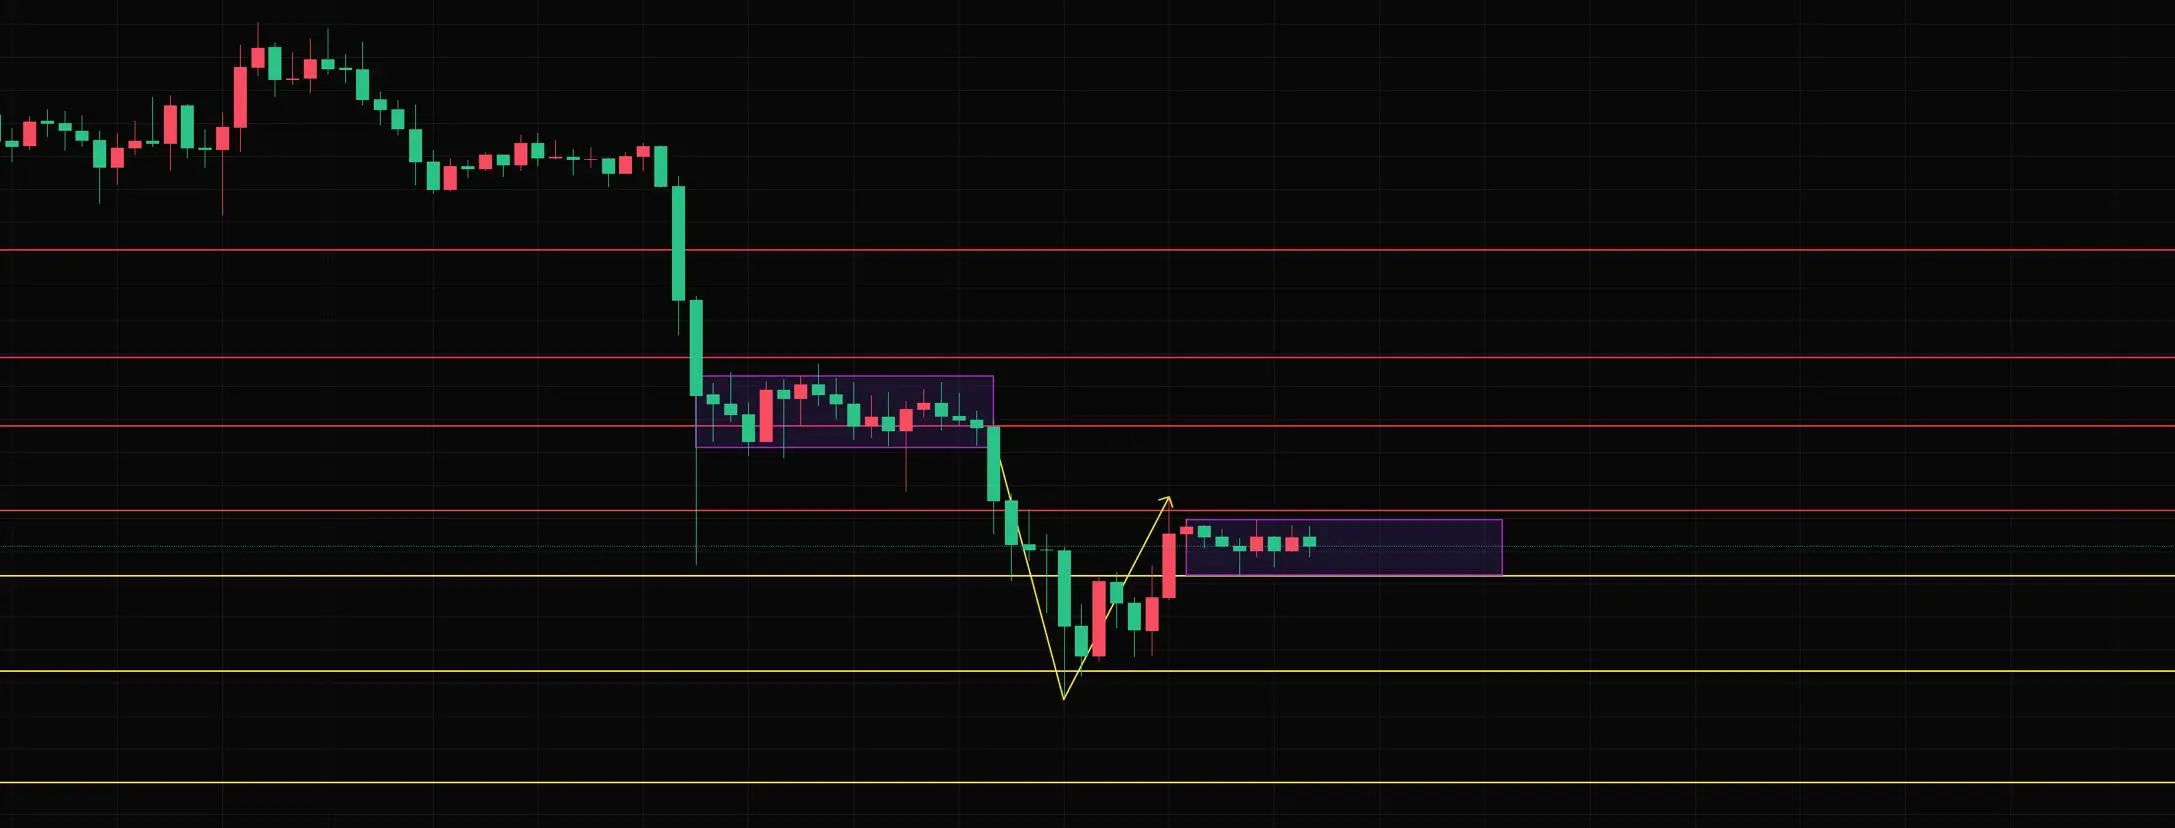
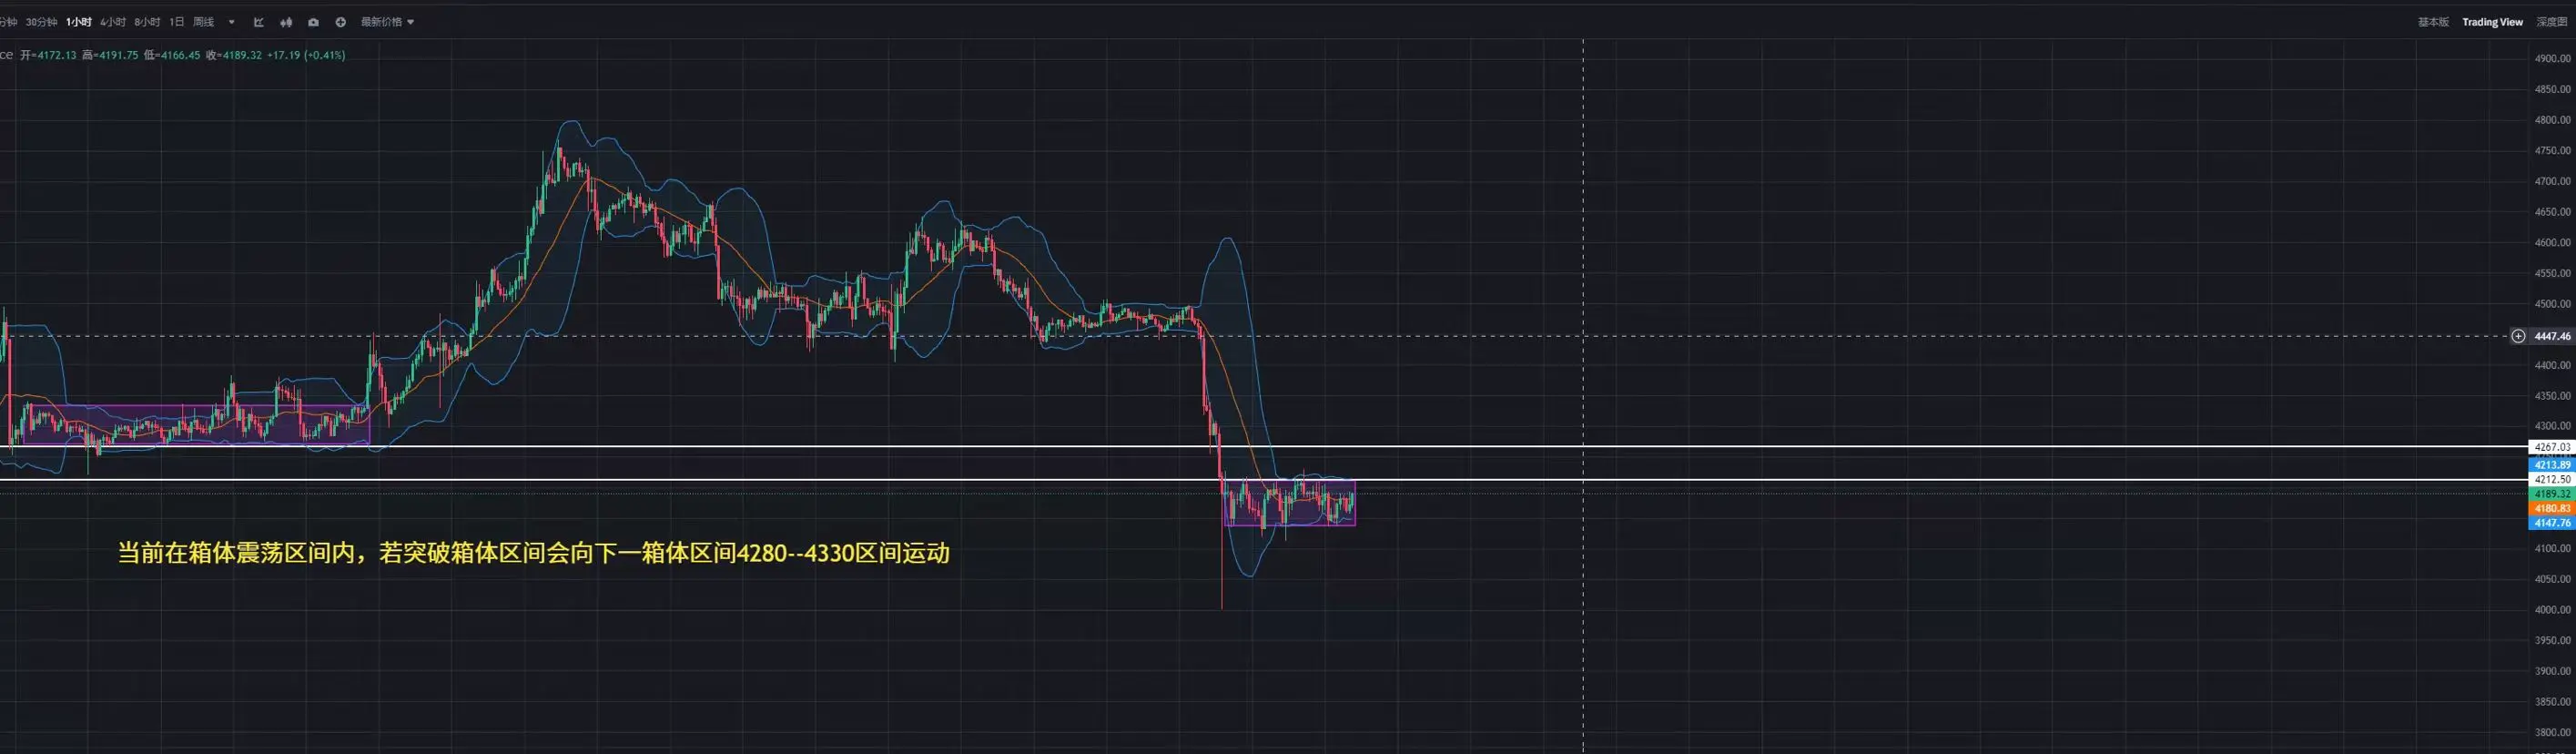
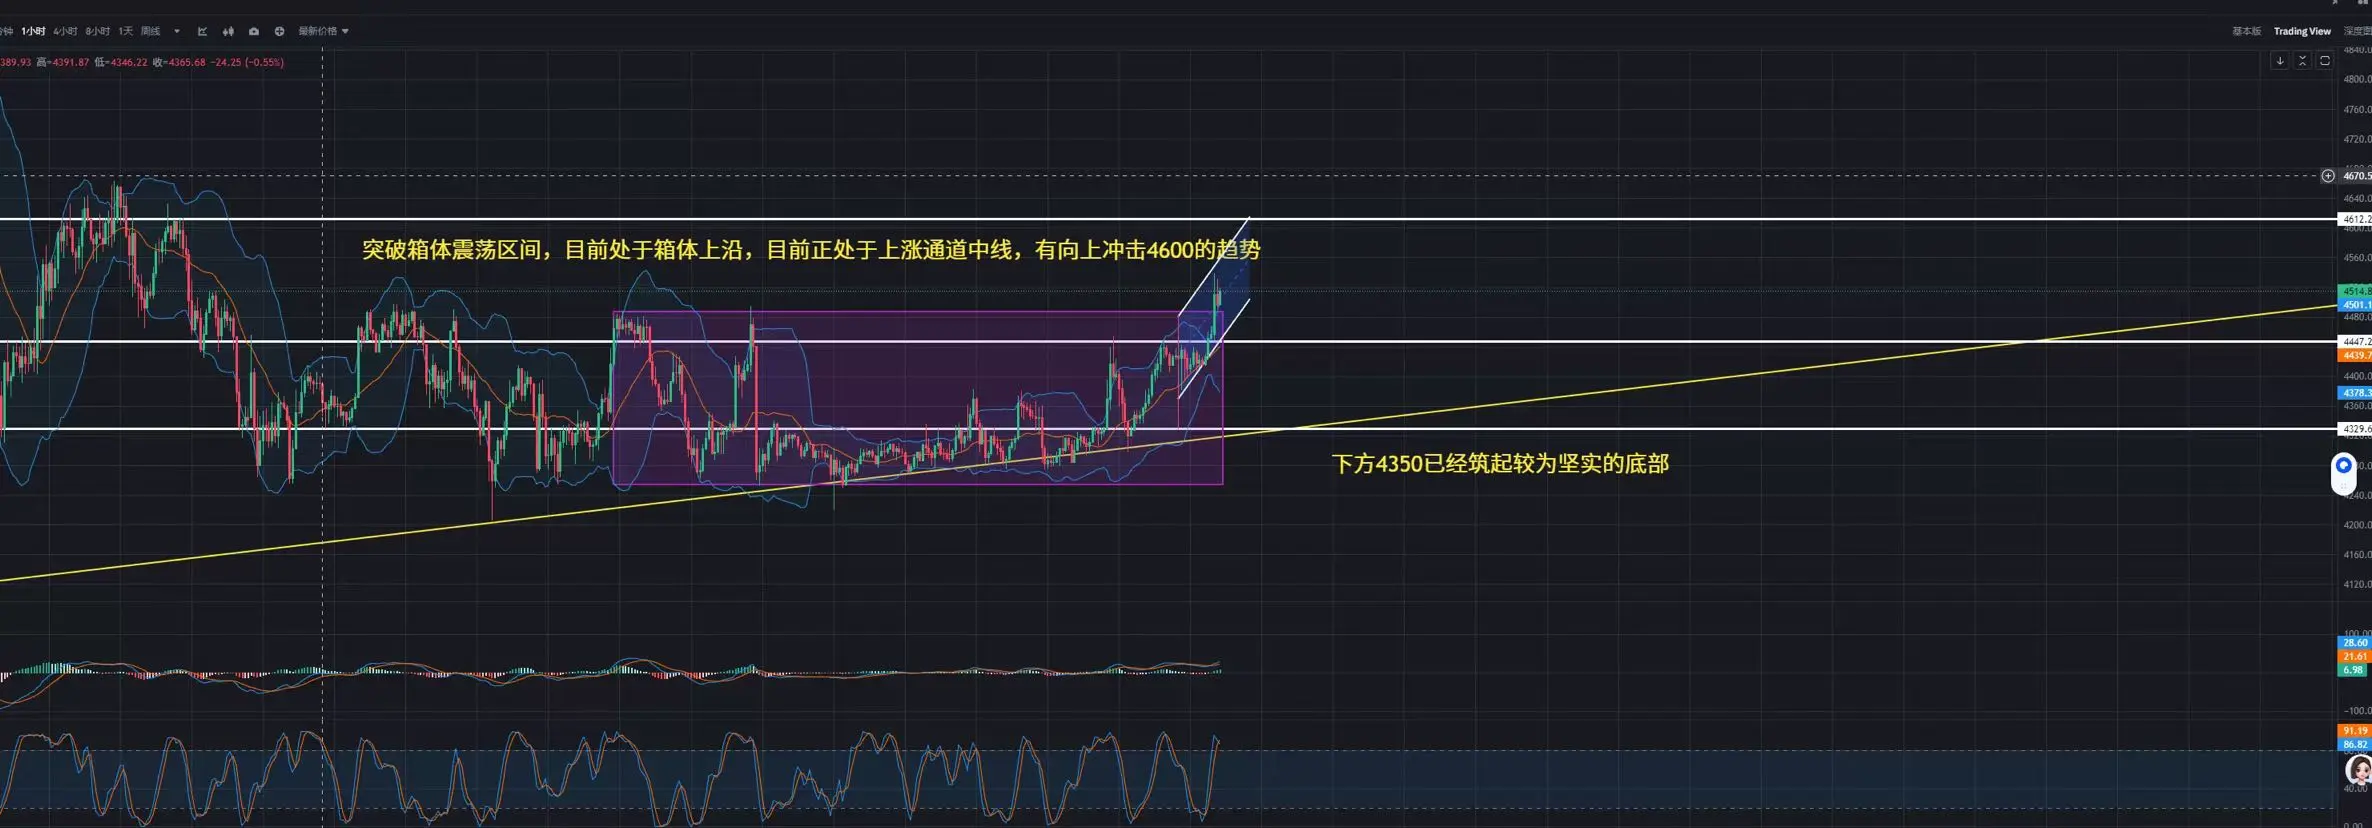
The short-term MA indicators on the 4-hour chart are rising, with MA5 about to cross above MA30. The price is currently trading between the MA30 moving average and the upper band. On the hourly chart, the short-term MAs MA5 and MA10 are crossing in a converging manner. If the price breaks through and stabilizes above MA5, a second upward movement is expected.
T
ETH-0,17%
View Original
  • Reward
  • Comment
  • Repost
  • Share
Based on the 4-hour chart, the Bollinger Bands are currently opening upward at the upper band, with the middle band trending higher. The three lines correspond to prices of 3482, 3362, and 3245.
The short-term MA indicators on the 4-hour chart are rising. The current price is between the MA30 and the upper band. If it can break through and stabilize above the MA30, it will attempt to test the upper Bollinger Band at 3482. The short-term MA5 on the hourly chart is moving roughly sideways. If the MA5 turns downward and crosses below the MA10, bullish sentiment will turn bearish. A pullback that
ETH-0,17%
View Original
  • Reward
  • Comment
  • Repost
  • Share
#ETH
Yesterday's review showed that the market was generally in a sideways consolidation, and it broke upwards to 4143 early this morning. Currently, it is undergoing a technical correction on the 4-hour chart. At present, Ethereum has fallen below 4000 and has attempted to rebound above 4000 multiple times but has not been able to hold above that level and has retreated. However, it has not broken below the support at 3800. Currently, the rebound momentum seems strong, and if it can stabilize above 4070, there is a trend for further upward rebound.
Technical Analysis
From the weekly pers
ETH-0,17%
View Original
post-image
  • Reward
  • Comment
  • Repost
  • Share
#ETH
Ethereum Review from Yesterday
Yesterday during the day, Ethereum showed a range-bound consolidation phase. In the morning, the market fluctuated within a very narrow range of 4000-4030. After a drop to 3970 in the afternoon, it pulled back up and oscillated around the range of 3980-4030. Due to the weekend and the US stock market being closed, there was not much volatility, and trading volume remained relatively stable. According to Coinglass data, if ETH drops below 3819 USD, the cumulative long liquidation strength on major CEXs will be 1.048 billion USD; conversely, if it breaks abov
ETH-0,17%
View Original
post-image
  • Reward
  • 1
  • Repost
  • Share
GateUser-4eade8a3vip:
Gate News Bot news, September 28, according to CoinMarketCap data, as of the time of writing, RFC (Retard Finder Coin) is currently priced at $0.01, having risen 84.52% within 24 hours, with a peak of $0.02 and a low of $0.01. The current market capitalization is approximately $14 million, an increase of $6.41 million from yesterday. Retard Finder Coin is a crypto assets project based on social media X (formerly Twitter), with 720,000 followers. The project adopts a fair issuance model, with a total supply of 1 billion RFC, of which 96% is used for public issuance and 4% is allocated to the developer's wallet. RFC emphasizes transparency and community-driven initiatives, with no pre-sales and no airdrops, aiming to create a fraud-free and rug pull-free crypto assets ecosystem.
#ETH
Ethereum
Yesterday's review showed that Ethereum was in a low-range consolidation state, testing the support level of 3880 multiple times without breaking it. It rebounded and reached a high point of 4066 in the early morning. Currently, it has pulled back but has not broken the integer level of 4000. If it can stabilize above 4000, there may be further upward potential. The current market sentiment is somewhat bullish but not strong, although there are large funds supporting the price. However, if market sentiment continues to decline, it may trigger panic selling, which could lead
ETH-0,17%
View Original
post-image
  • Reward
  • Comment
  • Repost
  • Share
#ETH
Ethereum review yesterday
Yesterday during the day, Ethereum showed a unilateral downward trend. After the market declined during the day, the rebound did not break through the middle track line, resulting in the lack of an effective rebound momentum. It wasn't until late at night that it continued to drop to the support level of 3820 before showing signs of a rebound. After all recent positive news has been exhausted, there are currently no new messages that could stimulate the market again, leading to a phenomenon of capital outflow and profit-taking, causing Ethereum to continue t
ETH-0,17%
View Original
post-image
  • Reward
  • Comment
  • Repost
  • Share
#ETH
Ethereum
Yesterday's review, the overall Ethereum was in a low-level horizontal oscillation and consolidation phase during the day, with the oscillation range between 4210 and 4150. It did not break through 4230 on the upside or fall below 4120 on the downside. The market sentiment is difficult to determine the direction, unable to successfully organize a large-scale rebound, and currently dominated by bears. At present, if the market stops falling, a short-term long operation can be carried out at the current position. If the upper pressure is too high, it may trigger another domina
ETH-0,17%
View Original
post-image
  • Reward
  • Comment
  • Repost
  • Share
#ETH
Ethereum
In yesterday's review, Ethereum experienced a cliff-like decline, dropping from a high of 4454 at 8 AM all the way down to the 4000 mark, a total drop of 445 points. It then rebounded from the bottom. From the market sentiment perspective, this did not cause panic selling; instead, it increased confidence in Ethereum's rise to 5000. Since rising above 4000 in early August, Ethereum has been oscillating in the area above 4000 for more than 40 days. This cliff-like drop, while not breaking below the 4000 bottom, has actually made Ethereum's bottom more solid. If Ethere
ETH-0,17%
View Original
post-image
  • Reward
  • Comment
  • Repost
  • Share
#ETH
Ethereum
Last week's review showed that Ethereum was still in a relatively strong bullish market from the weekly perspective, but there are clear signs of a downward movement. The MA5 has turned downward, with support levels at 4293 and the support zone around 4280. If the price breaks below this range, the strength will weaken, and a rebound signal may appear. The MACD indicator on the weekly chart shows that the fast line is about to cross below the slow line, but it is still in a bullish market above the zero axis. In terms of the daily chart, last week was generally a transition
ETH-0,17%
View Original
post-image
  • Reward
  • Comment
  • Repost
  • Share
#ETH
Ethereum review yesterday
Yesterday during the day, Ethereum overall showed an upward movement to the upper Bollinger Band, followed by a downward correction that broke below the middle band to test the support at the lower band. Throughout the day, the market was continuously controlled by bears, with prices continuing to decline and testing the support levels below. After the US stock market opened at 9:30 PM, in the context of the US stocks continuing to rise, the cryptocurrency market followed the downward trend, not participating in the upward movement. Currently, the market display
ETH-0,17%
View Original
post-image
  • Reward
  • Comment
  • Repost
  • Share
#ETH
Ethereum
In yesterday's review, Ethereum maintained an overall fluctuation in the range of 4620 to 4570, with a total fluctuation of no more than 100 points. Both buying and selling volumes in the market are gradually shrinking, and market sentiment is becoming increasingly cautious. Although the interest rate cut has been implemented, the previous price increase before the cut has already realized some of the positive space. If there are no significant positive developments in the near future, market sentiment will continue to be cautious, and the upward momentum will weaken with ea
ETH-0,17%
View Original
post-image
  • Reward
  • Comment
  • Repost
  • Share
#ETH
Ethereum
Yesterday's review showed that Ethereum was overall in a high-level sideways consolidation during the day, fluctuating around the 4460-4550 range. In the evening, influenced by the interest rate cut news, it dropped from the high point of 4530 by over a hundred points to 4410. Subsequently, influenced by Federal Reserve Chairman Powell's speech, it surged by 220 points during the night to 4630. Currently, it is in a high-level sideways consolidation phase. Ethereum's recent price trend shows a tendency to fluctuate upward, but there are signs of stagnation. The tradi
ETH-0,17%
View Original
post-image
  • Reward
  • Comment
  • Repost
  • Share
#ETH
Ethereum
Yesterday's review showed that Ethereum experienced a narrow range of fluctuations during the day, oscillating between 4530 and 4480 for the entire day. In the evening, it dropped to around 4430, then rebounded to 4520. The support below is relatively strong, and it is currently in a high-level consolidation phase. Overall, the momentum for the rebound is not strong, and it is expected that the current trend will be maintained over the next two days. The volatility throughout the day was about 110 points, and the oscillation phase is actually the simpler phase for making tra
ETH-0,17%
View Original
post-image
  • Reward
  • Comment
  • Repost
  • Share
#ETH
Technical Analysis
First, let's take a look at the daily chart. The current market is experiencing a technical pullback after breaking through the upper Bollinger Band. It is currently above the support level corresponding to MA5 at a price of 4605, with support mainly concentrated between 4450 and 4420. On the hourly chart, it is currently in a state of oscillating decline and is about to break through the lower Bollinger Band on the hourly chart, with the market oscillating downwards.
The MA moving average indicator is currently showing a transition from a bullish to a bearish arra
ETH-0,17%
View Original
post-image
  • Reward
  • Comment
  • Repost
  • Share
#ETH
Ethereum recap yesterday
Yesterday during the day, Ethereum exhibited a sideways trend at a high range, oscillating around the 4480 and 4550 range. Throughout the day, the bullish market was relatively strong, consistently staying above the M5 short-term moving average, forming a one-sided upward trend. In the early morning, the bulls suddenly exerted continuous force, leading to a strong rise, reaching a peak of 4750, with a four-hour increase of 220 points. However, recently, attention should be paid to the "interest rate cut" favorable news being realized in advance, causing a situati
ETH-0,17%
View Original
post-image
  • Reward
  • Comment
  • Repost
  • Share
#ETH
Ethereum
Yesterday's review of Ethereum showed that it was generally in a fluctuating upward trend during the day, rising from a low of 4330 in the morning to 4410 before moving sideways. Subsequently, evening data-driven news stimulated the market, leading to a fluctuation of 130 points. Recently, most news releases have maintained this fluctuation state, with positive news being realized with a delay. Currently, if next week's interest rate cut news is confirmed, there is a high probability of a top escape phenomenon.
Technical Analysis
The hourly Bollinger Bands are in an upwa
ETH-0,17%
View Original
post-image
  • Reward
  • Comment
  • Repost
  • Share
  • Pin

Trade Crypto Anywhere Anytime
qrCode
Scan to download Gate App
Community
  • 简体中文
  • English
  • Tiếng Việt
  • 繁體中文
  • Español
  • Русский
  • Français (Afrique)
  • Português (Portugal)
  • Bahasa Indonesia
  • 日本語
  • بالعربية
  • Українська
  • Português (Brasil)