1.5 Monday midday market analysis. The daily chart shows that Bitcoin is presenting a healthy upward structure with "higher highs and no lower lows," with the price steadily staying above multiple short-term moving averages. The moving average system is in a bullish alignment, providing solid support for the upward movement.
On the 4-hour chart, the MACD has a sustained bullish crossover with expanding red bars, indicating good continuation of bullish momentum.
However, as the price approaches resistance at higher levels, the RSI indicator shows a slight upward trend, suggest
On the 4-hour chart, the MACD has a sustained bullish crossover with expanding red bars, indicating good continuation of bullish momentum.
However, as the price approaches resistance at higher levels, the RSI indicator shows a slight upward trend, suggest
BTC1,42%
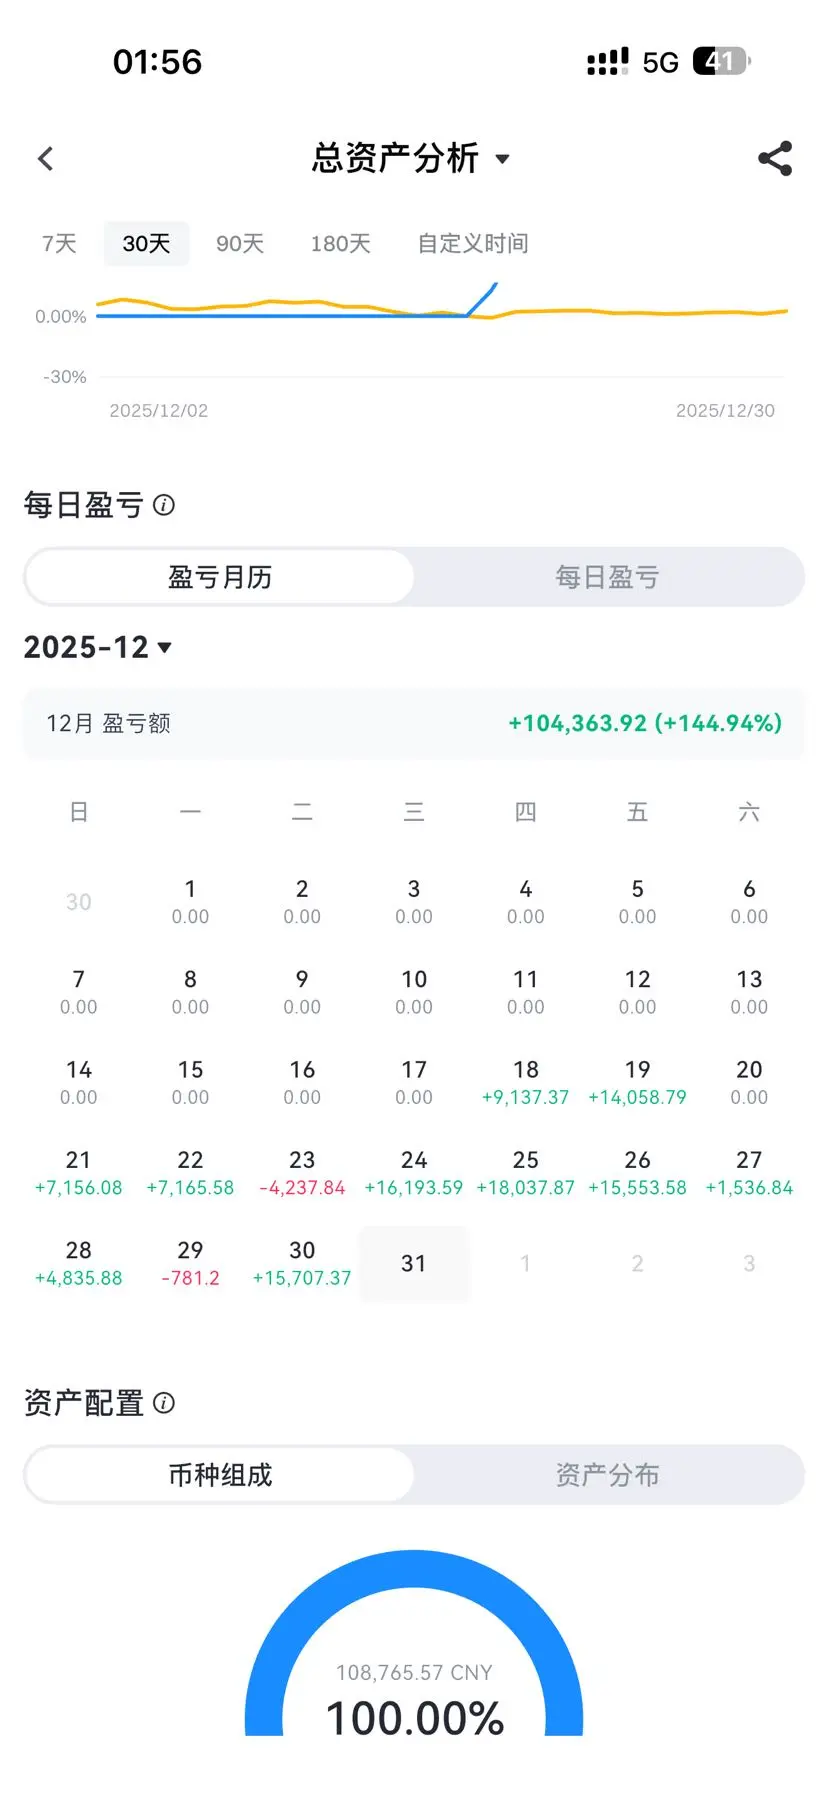
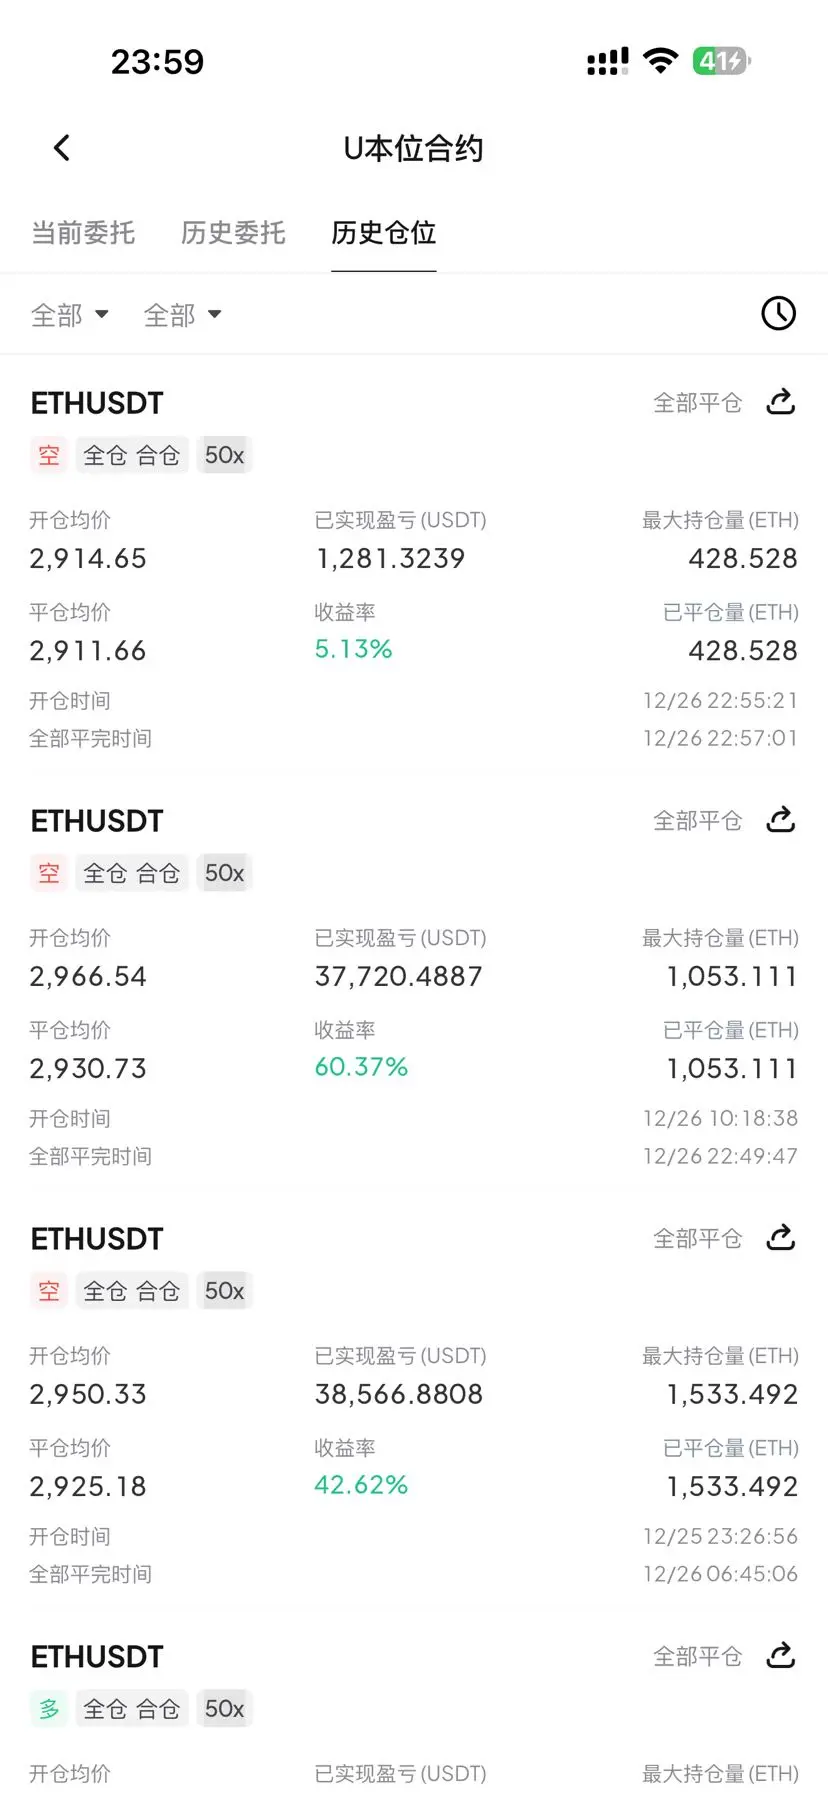
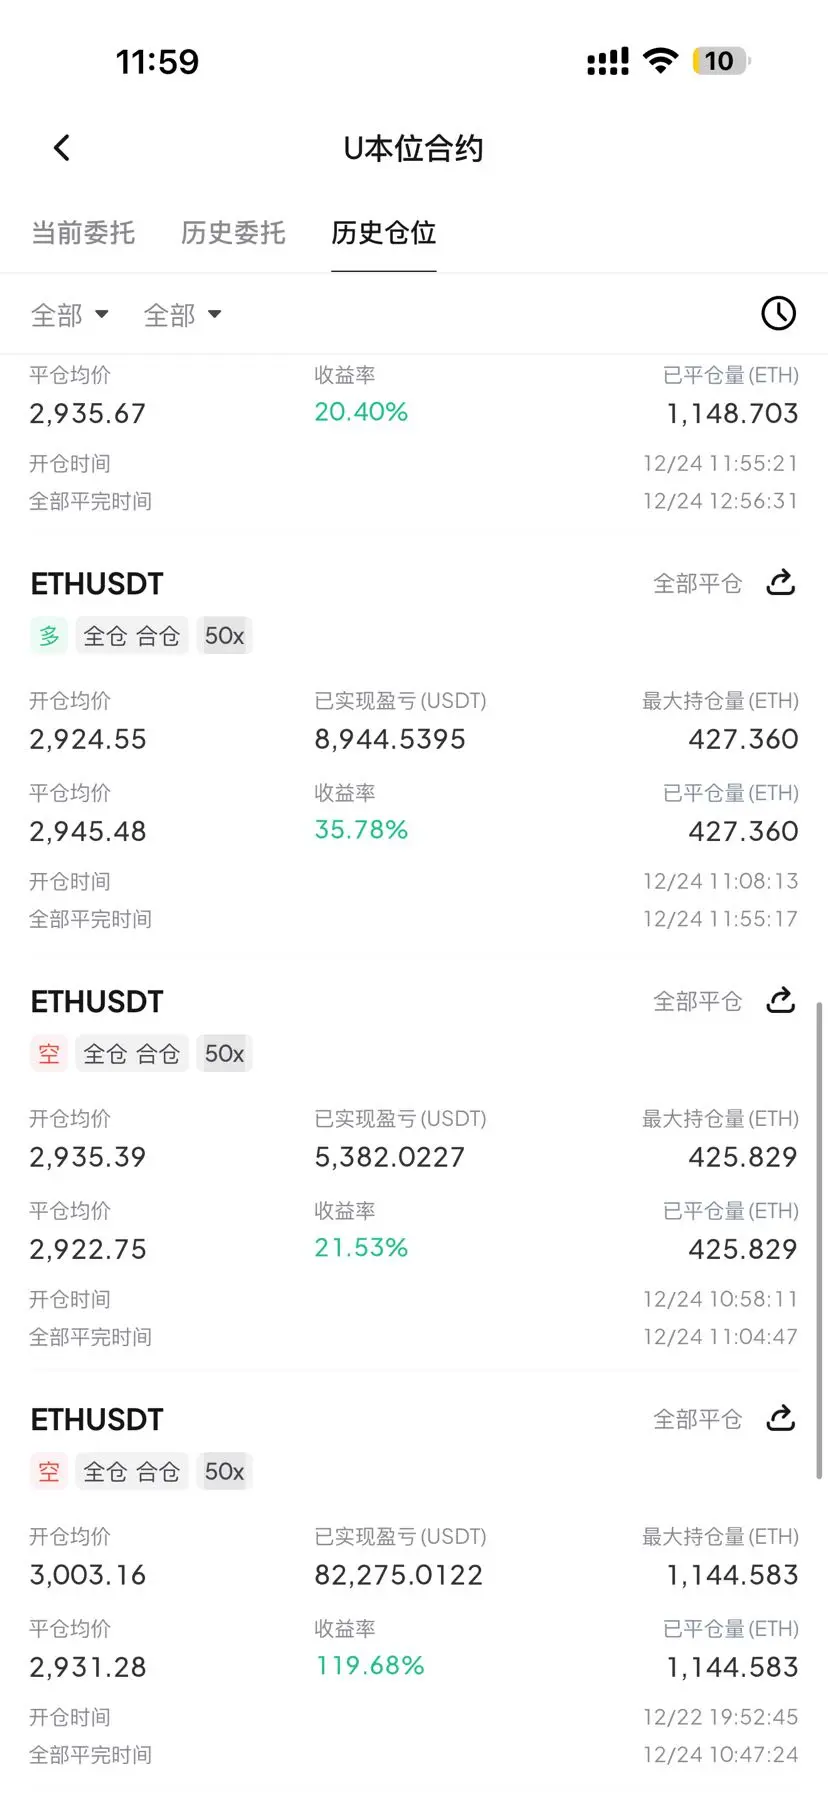
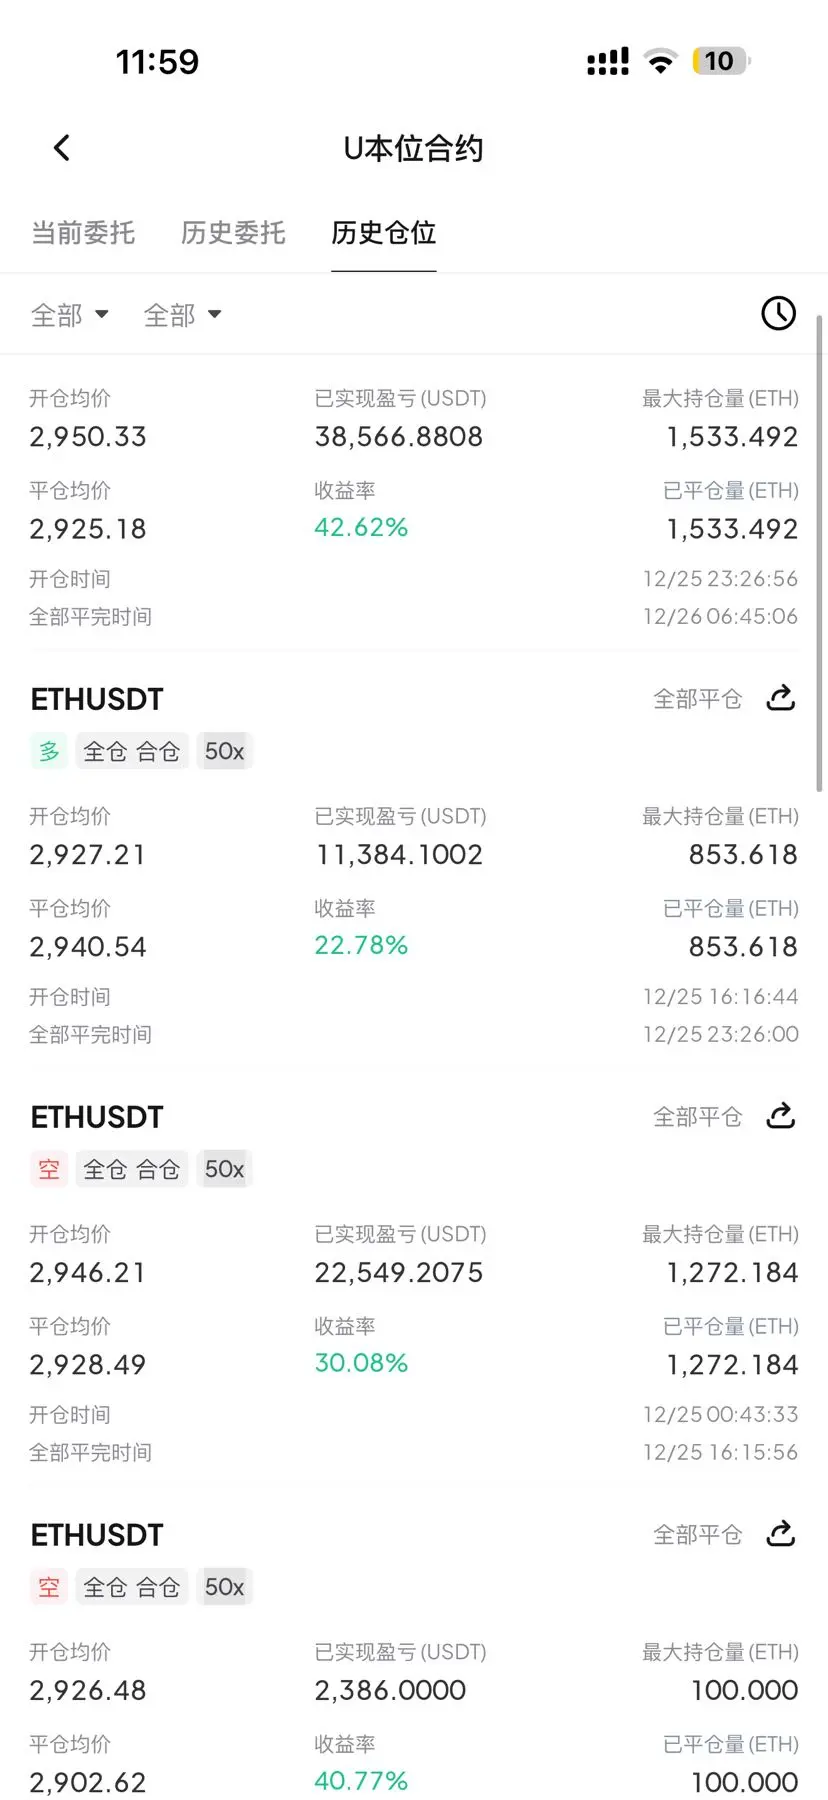
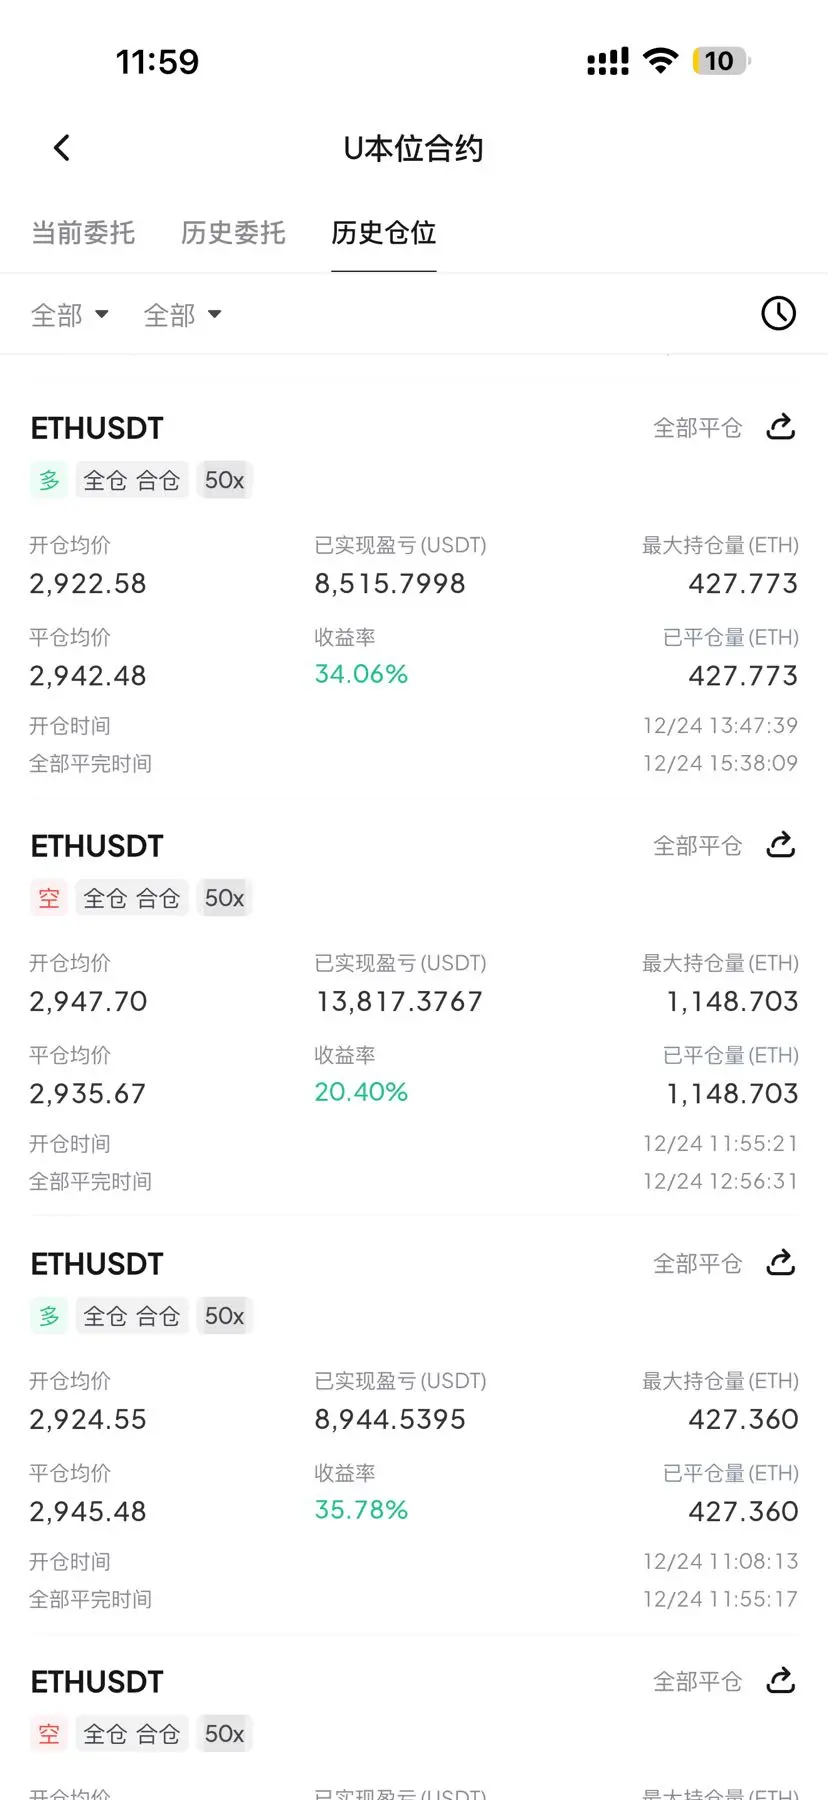
[The user has shared his/her trading data. Go to the App to view more.]