知行合一TV策略

vip
Age 0.1 Yıl
Peak Tier 0
No content yet
As of January 3, 2026, 13:00, BTC is currently trading at $89,000, with intra-day fluctuations mainly oscillating within the range of 87,500-90,000. The strategy is to buy low and sell high within this range, and to add positions upon key level breakthroughs.
Core Key Levels (USD)
- Support: 88,700 (EMA120), 87,500 (watershed between bulls and bears), 86,000 (strong support)
- Resistance: 90,000 (psychological barrier), 90,500 (previous high)
Technical Highlights
- Daily Chart: Three consecutive long upper shadows, heavy selling pressure around 90,000, MACD death cross, indicating a bias towar
BTC0,59%
View Original
post-image
  • Reward
  • Comment
  • Repost
  • Share
January 2nd SOL Technical Analysis (As of 12:00, current price approximately 126.2)
- Core judgment: Volatile with a slight bearish bias, double top + death cross resonance, insufficient volume, weak rebound
- Intraday range: 125.0-127.0; key resistance 127.0/127.5; key support 125.0/124.5
Key Patterns and Indicators
- 4-hour: Double top (126.9/126.8), MACD death cross, broke below EMA120, bearish dominance
- Daily chart: Two consecutive long upper shadows, heavy selling pressure near 127, MACD death cross, 7/30-day moving averages (126.1/125.8) will form a death cross
- Volume: No volume on r
SOL0,7%
View Original
post-image
  • Reward
  • Comment
  • Repost
  • Share
January 1st SOL Technical Analysis (As of 12:16, Price approximately 126.2 USD)
Core Judgment: Daily chart is slightly bearish + 4-hour consolidation + hourly weak bullish trend. During the holiday with low liquidity, focus on the 125.0–127.5 range for trading, with key levels at 127.0 and 125.0.
Key Price Levels (USD)
- Resistance: 127.0 (4-hour upper band) → 129.0 (psychological level + previous high) → 132.0 (medium-term resistance)
- Support: 125.0 (intraday weak support) → 123.5 (24H low) → 121.0 (medium-term moving average) → 118.8 (strong support)
Indicators and Patterns
- Daily: Facing
SOL0,7%
View Original
post-image
  • Reward
  • 6
  • Repost
  • Share
AkabaneRyuukouvip:
2026 Go Go Go 👊
View More
As of 14:00 on December 31, 2025, SOL is experiencing short-term weak fluctuations with an unclear direction; the core range is $122–125. Before the annual line closes, trading will mainly be within the range and cautious, with strict position control.
Core Market (as of 14:00)
- Price: approximately $123.5, a slight 0.4% decline in 24H, with reduced volume and oscillation, liquidity is low at year-end
- Main trend: Daily chart is suppressed by EMA30, with a bearish moving average alignment, MACD shows a death cross, bearish dominance
- Rhythm: 4-hour MACD bearish bars are shortening, no golde
SOL0,7%
View Original
post-image
  • Reward
  • 4
  • Repost
  • Share
HaveYouEverDealtWithLizards?vip:
New Year Wealth Explosion 🤑
View More
Summary of Conclusions: On December 30, SOL is experiencing short-term oscillation with a slight bearish bias, mainly focusing on rebound highs and support lows; key levels: 127.5 (break above turns bullish), 122.0 (break below turns bearish).
1. Core Price Levels (12/30 13:40, current price ≈124.5)
• Resistance: 126.0 (50EMA), 127.5 (100EMA/upper boundary of range), 130.0 (daily structure), 133.5 (200-day moving average)
• Support: 123.0 (lower boundary of range), 122.0 (strong support), 120.0 (key platform), 117.0 (previous low)
2. Technical Indicators (4h+1h)
• 4h: Price below EMA30/100, RS
SOL0,7%
View Original
post-image
  • Reward
  • 6
  • Repost
  • Share
赵赵翻仓无数倍vip:
1
View More
As of 2025-12-29 12:00 (UTC+8), SOL is currently trading around $128.5, with a slight intraday increase and low trading volume. The market shows a short-term weak rebound and a medium-term bearish pattern, awaiting a clear direction.
Key Indicator Overview
• Daily Chart: Price below the 20/50/100-day moving averages, with a bearish moving average alignment; MACD shows a death cross, indicating weak momentum; RSI around 46 (neutral to bearish); Bollinger Bands are narrowing, with low volatility.
• 4-Hour Chart: Short-term oversold rebound, MACD shows a golden cross at low levels, with bullish m
SOL0,7%
View Original
post-image
  • Reward
  • 2
  • 1
  • Share
GateUser-98ca4d8fvip:
Follow the host to enjoy some meat, let's go 💪 and get it started
View More
December 28th SOL Core Conclusion: Narrow fluctuation between $122.5 and $125.5, short-term bias slightly bearish, no strong trend, mainly trading within high risk-reward ratio zones. Total position strictly controlled at ≤30%, beware of low liquidity spikes and false breakouts over the weekend.
1. Key Price Levels (4H/Daily chart, as of 12:00 on December 28th)
• Support: 122.5 (4H strong support, tested multiple times), 121 (psychological/volume cluster), 120 (stop-loss level), 118 (strong support)
• Resistance: 124.8-125.5 (20-day moving average/rebound high), 127 (Fibonacci 61.8% retracemen
SOL0,7%
View Original
post-image
  • Reward
  • 1
  • Repost
  • Share
Hermann11vip:
Yes
As of December 27, 2025, 10:00 (UTC+8), SOL is quoted at approximately $123.3. The short-term movement is narrow-range and slightly weak, with a core range of $121-$126. Due to low holiday liquidity, the direction remains uncertain.
Key Views
• Trend: Hovering near the lower boundary of the 4H descending channel, with price under pressure below the 20-day moving average ( $130.2 ). ADX<25 indicates no strong trend, with -DI slightly stronger than +DI.
• Pattern: 4H shows a converging triangle, caution for a downward breakout; the weekly mid-term trend is bearish.
• Sentiment: Fear and Greed In
SOL0,7%
View Original
post-image
  • Reward
  • Comment
  • 1
  • Share
December 26th SOL Technical Analysis (11:00, China Time)
• Price Snapshot: approximately $123.3 USD, narrow fluctuations, low trading volume; volatility risk increases due to the expiration of Deribit approximately $28.5 billion BTC/ETH options.
• Key Levels: Resistance at 125.0-126.0, 128.0; Support at 122.0, 120.0; break below targets 118.0 (daily Bollinger Bands lower band).
• Patterns and Indicators: Daily EMA20/50 resistance; 4-hour downtrend channel (bearish); RSI≈42 neutral to weak; MACD bearish dominance; OBV declining; bullish momentum insufficient.
Actionable Strategies
• Short-term
SOL0,7%
View Original
post-image
  • Reward
  • 7
  • Repost
  • Share
Hermann11vip:
DYOR 🤓
View More
December 25, 2025 SOL Christmas Technical Analysis (12:00, UTC+8)
• Current Price: around 123.2. During the Christmas holiday, liquidity is extremely low, with BTC/ETH moving in a narrow range. Contract deleveraging and concentrated chips increase the risk of sharp price movements.
• Core Judgment: Daily chart shows a slight bearish oscillation; 4H/2H lack clear direction. Focus on range-bound buying low and selling high, with total positions ≤30%. Switch to trend strategies only after a volume breakout.
🎯 Key Price Levels (USD, layered precision)
• Support: 122.0 (intraday strong support) →
SOL0,7%
View Original
post-image
  • Reward
  • Comment
  • Repost
  • Share
As of December 24th, 13:30, the current price of SOL is approximately 122.5 USD, the daily chart shows a weak oscillation dominated by short positions, with low liquidity during the Christmas holiday. The strategy focuses on high short positions, supplemented by low long positions, Light Position + strict stop loss.
Key price level
• Support: 120 (intraday) → 117 (4H) → 115 (strong support on daily chart) → 110 (extreme defense)
• Resistance: 125 (psychological) → 128-130 (20-day SMA) → 133 (midline of daily chart)
Indicator Overview
• daily chart: RSI 40.1 (neutral to weak), MACD negative zon
SOL0,7%
View Original
post-image
  • Reward
  • Comment
  • Repost
  • Share
As of 2025-12-23 10:15#现货黄金再创新高 , BTC is currently reported at 87920 USD, with a 24h fluctuation between 87350-88580 USD, short-term bearish, waiting for a breakout.
Key Price Levels (Support/Resistance)
• Support: 87400 USD (24h low + short-term fluctuation lower edge) → If it breaks, look at 86000 USD (daily key support)
• Resistance: 88600 USD (24h high + 4h ago high) → A breakthrough looks toward 89500 USD (daily MA10)
• Boundary: 88000 USD, stabilize with a bullish bias, lose support with a bearish bias
Multi-Period Indicator Overview
• Daily: RSI≈39 (weak), MACD death cross continues, gr
BTC0,59%
View Original
post-image
  • Reward
  • 1
  • 1
  • Share
GateUser-3030c9aavip:
😀
As of 2025-12-22 16:00 (UTC+8), SOL is currently priced at 125.10 USD, with a 24h fluctuation of 123.64-126.42 USD, showing weak oscillation. In the short-term, a rebound is expected but needs to break through for confirmation.
1. Key Price Levels (Support/Resistance)
• First support: 123.5 USD (24h low + recent fluctuation lower edge), if broken, look for second support at 120.0 USD (daily MA30)
• First resistance: 126.5 USD (24h high + previous high on hourly chart), breaking upwards looks at second resistance 129.0 USD (daily MA10)
• Key boundary: 125.0 USD, stabilizing bullish, losing grou
SOL0,7%
View Original
post-image
  • Reward
  • Comment
  • Repost
  • Share
As of 2025-12-20 13:00 (UTC+8), the current BTC price is approximately 87,200 USDT. The short-term trend is leaning towards a rebound correction, but the daily chart remains in a weak pattern, with bulls and bears focusing on key support and resistance levels.
Core Technical Aspects
• Daily Chart: Bearish arrangement, MACD death cross, green bars not shrinking; RSI≈36, entering oversold territory, selling pressure may ease but the trend remains unchanged.
• Hourly Chart: RSI has exited oversold (≈54), MACD green bars are shrinking, a golden cross is expected, indicating short-term rebound mome
BTC0,59%
View Original
post-image
  • Reward
  • Comment
  • Repost
  • Share
As of 11:50 on December 18 (UTC+8), SOL is approximately $127.8. The daily chart is dominated by a bearish trend, with weak rebounds during the 4-hour oversold condition. Overall, the market is oscillating weakly, linked to BTC, mainly shorting on rebounds and lightly trying long positions at low levels.
Core Price Levels and Key Multi-Period Support/Resistance
• Daily: Support at 123/121 (strong support); Resistance at 131/135-137 (strong resistance)
• 4-Hour: Support at 126/123; Resistance at 130-131/134.5
• 2-Hour: Support at 127; Resistance at 129-130. Bollinger Bands are converging, incre
SOL0,7%
View Original
post-image
post-image
  • Reward
  • Comment
  • Repost
  • Share
In December 15, 2025, ETH overall shows a weak oscillation trend, but there is a certain rebound demand. The key levels and operational reference points under different cycles are as follows. The content is for reference only and does not constitute investment advice:
1. Key Resistance Levels: The intraday core resistance focuses on $3130 - $3158, with further resistance at $3170; if broken, attention can be given to the $3200 - $3250 range, and longer-term resistance can be noted at $3310 - $3317. Among them, $3130 is a key resistance to watch closely during the day, and $3170 is a clearly de
ETH-0,25%
View Original
post-image
  • Reward
  • Comment
  • Repost
  • Share
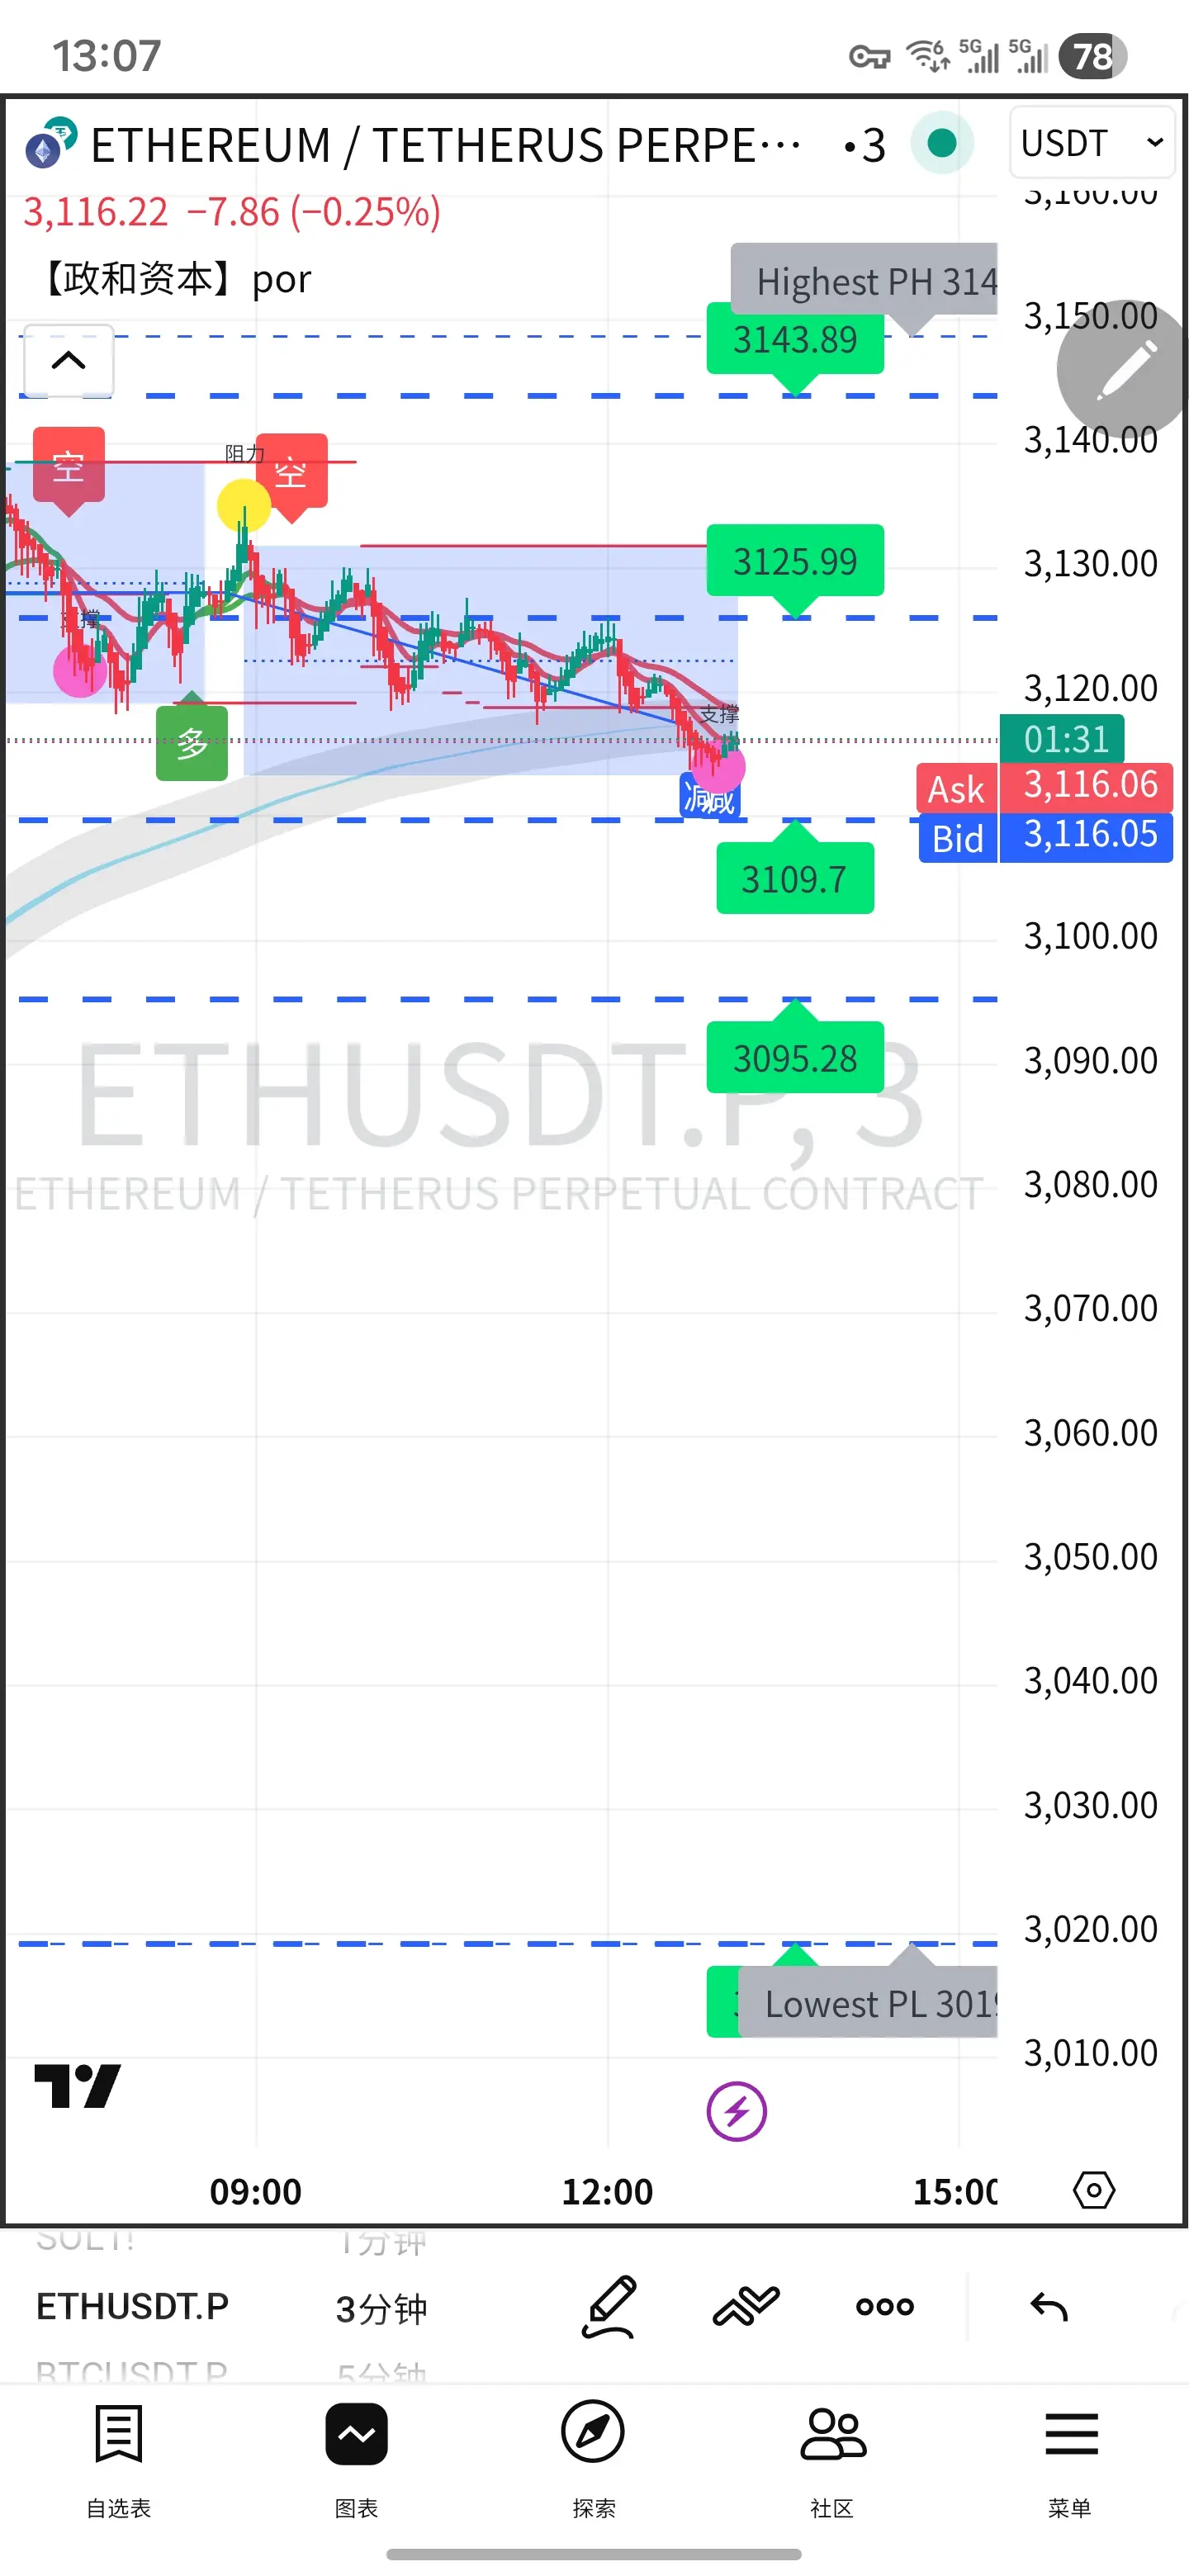
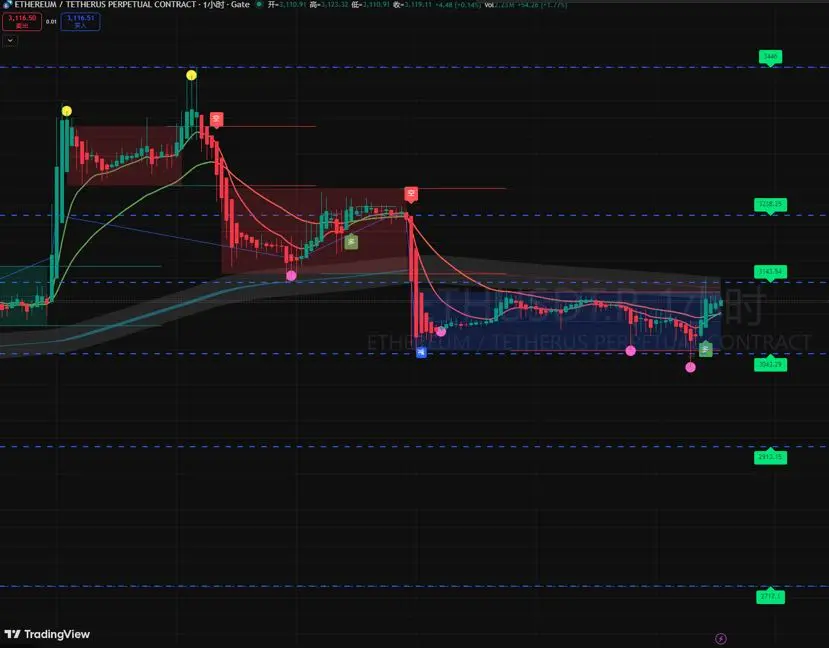
12th Long Strategy: Prioritize entering around the key support zone of 3150 - 3170. If the price pulls back to the strong support level of 3100 - 3120 and does not break below, add to your long positions. Take profit first at 3200 - 3230. If the price breaks through 3250 and stabilizes, extend to 3280; set stop-loss at 3080 to avoid larger losses from breaking below key support.
Short Strategy: Lightly open short positions on a rebound to the 3280 - 3300 range. If the price surges near 3350 and encounters resistance, consider adding to the short positions gradually. Take profit targets at 3200
ETH-0,25%
View Original
  • Reward
  • Comment
  • Repost
  • Share
  • Pin

Trade Crypto Anywhere Anytime
qrCode
Scan to download Gate App
Community
  • 简体中文
  • English
  • Tiếng Việt
  • 繁體中文
  • Español
  • Русский
  • Français (Afrique)
  • Português (Portugal)
  • Bahasa Indonesia
  • 日本語
  • بالعربية
  • Українська
  • Português (Brasil)