Trade
Trading Type
Spot
Trade crypto freely
Pre-Market
Trade new tokens before they are officially listed
Margin
Magnify your profit with leverage
Convert & Block Trading
0 Fees
Trade any size with no fees and no slippage
Alpha
Points
Get promising tokens in streamlined on-chain trading
Leveraged Tokens
Get exposure to leveraged positions simply
Futures
Futures
Hundreds of contracts settled in USDT or BTC
Options
HOT
Trade European-style vanilla options
Unified Account
Maximize your capital efficiency
Demo Trading
Futures Kickoff
Get prepared for your futures trading
Futures Events
Participate in events to win generous rewards
Demo Trading
Use virtual funds to experience risk-free trading
Earn
Launch
CandyDrop
Collect candies to earn airdrops
Launchpool
Quick staking, earn potential new tokens
HODLer Airdrop
Hold GT and get massive airdrops for free
Launchpad
Be early to the next big token project
Alpha Points
NEW
Trade on-chain assets and enjoy airdrop rewards!
Futures Points
NEW
Earn futures points and claim airdrop rewards
Investment
Simple Earn
Earn interests with idle tokens
Auto-Invest
Auto-invest on a regular basis
Dual Investment
Buy low and sell high to take profits from price fluctuations
Soft Staking
Earn rewards with flexible staking
Crypto Loan
0 Fees
Pledge one crypto to borrow another
Lending Center
One-stop lending hub
VIP Wealth Hub
Customized wealth management empowers your assets growth
Private Wealth Management
Customized asset management to grow your digital assets
Quant Fund
Top asset management team helps you profit without hassle
Staking
Stake cryptos to earn in PoS products
Smart Leverage
NEW
No forced liquidation before maturity, worry-free leveraged gains
GUSD Minting
Use USDT/USDC to mint GUSD for treasury-level yields
More
Promotions
Activity Center
Join activities and win big cash prizes and exclusive merch
Referral
20 USDT
Earn 40% commission or up to 500 USDT rewards
Announcements
Announcements of new listings, activities, upgrades, etc
Gate Blog
Crypto industry articles
VIP Services
Huge fee discounts
Proof of Reserves
Gate promises 100% proof of reserves
HuXijin
No content yet
HuXijin
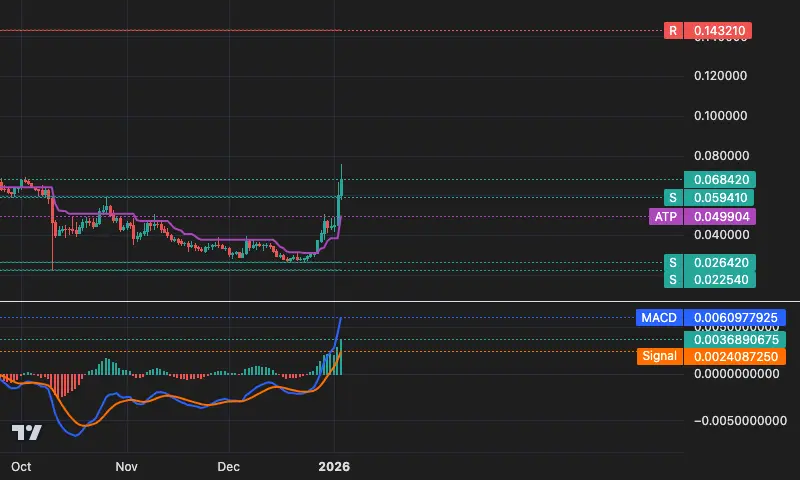
$BULLA
Crazy🔥! Since the trend initiation point, the price has surged over 66%! The current price is 0.06842, firmly above the dynamic trailing stop loss line at 0.0499, with a gap of 27% between the two, indicating that the bullish momentum remains strong. Although it has retraced nearly 10% from the high, the MACD histogram has strongly turned positive and a bullish divergence has appeared, which is usually a sign of trend continuation💪. The key support has moved up to 0.0594. As long as it does not fall below this upward trend line, the bullish pattern remains solid. Stay steady!
View OriginalCrazy🔥! Since the trend initiation point, the price has surged over 66%! The current price is 0.06842, firmly above the dynamic trailing stop loss line at 0.0499, with a gap of 27% between the two, indicating that the bullish momentum remains strong. Although it has retraced nearly 10% from the high, the MACD histogram has strongly turned positive and a bullish divergence has appeared, which is usually a sign of trend continuation💪. The key support has moved up to 0.0594. As long as it does not fall below this upward trend line, the bullish pattern remains solid. Stay steady!
- Reward
- like
- Comment
- Repost
- Share
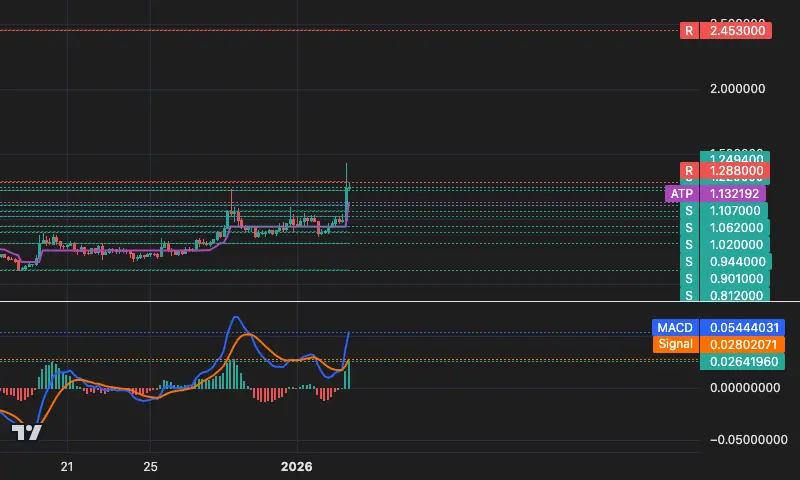
$EVAA The bull market is still raging! 🚀
Starting from 0.835, the increase has nearly reached 50%. The current price of 1.2494 firmly stays above the trailing stop-loss line at 1.1322, and the pattern remains unchanged!
The MACD momentum bars have significantly strengthened, soaring 278% over the past 5 days, indicating a fierce bullish attack 💪.
However, be cautious! The MACD shows a strong divergence signal, and the price has approached the upper resistance at 1.2880, which may lead to short-term pullback pressure. The current trend is defined as a continuation of the bullish trend, but
EVAA24,68%
- Reward
- like
- Comment
- Repost
- Share
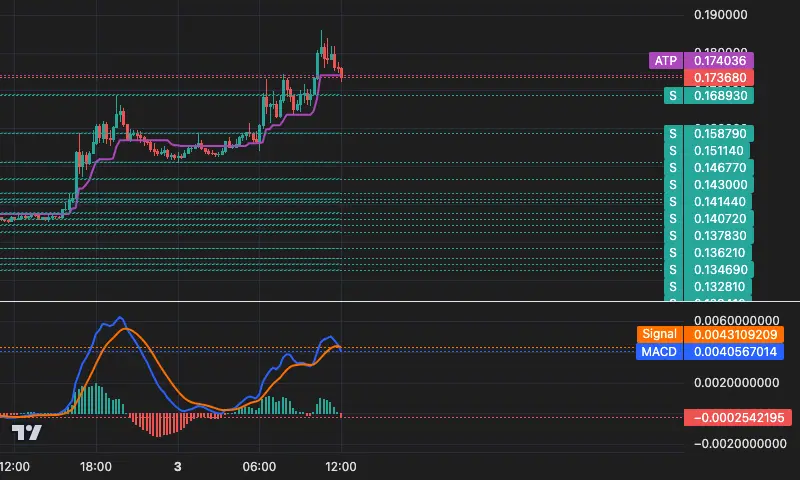
$SAPIEN Alert! 🚨15-minute chart, current price 0.17368 has broken below the key trailing stop-loss line at 0.17404, a difference of only 0.2%! 😱 Since the upward move started, it has gained over 9%, but the MACD has already shown a death cross, indicating a significant increase in bearish momentum. The price is testing the trendline support; if it cannot quickly recover, beware of a short-term upward trend stalling or even reversing! Support below is at 0.16893.
SAPIEN3,19%
- Reward
- like
- Comment
- Repost
- Share
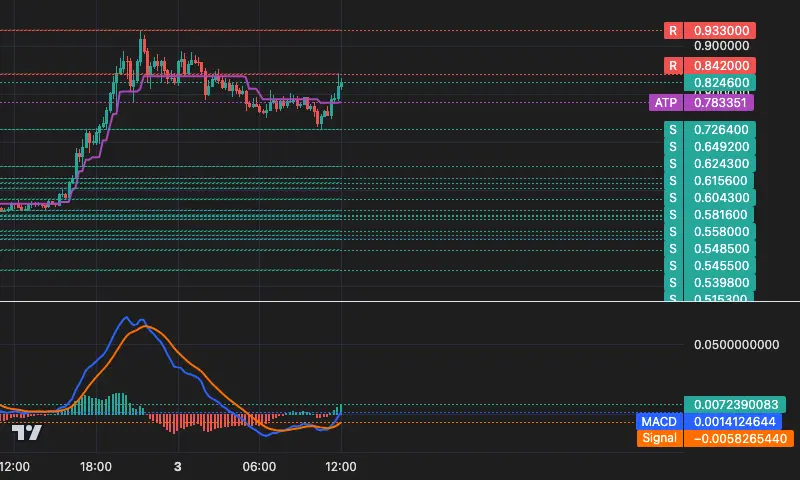
$PIEVERSE
The current price is 0.8246, exactly back to the starting point of this 15-minute upward wave🚦
The price is still trading above the trailing stop line at 0.7834, but MACD shows strong divergence, indicating that upward momentum may be weakening📉
The nearest resistance above is at 0.8420. The price is hovering around the starting point, and combined with indicator divergence, the market is in a "trend stagnation" phase, so be alert to potential reversals⏳
PIEVERSE-10,62%
- Reward
- like
- Comment
- Repost
- Share
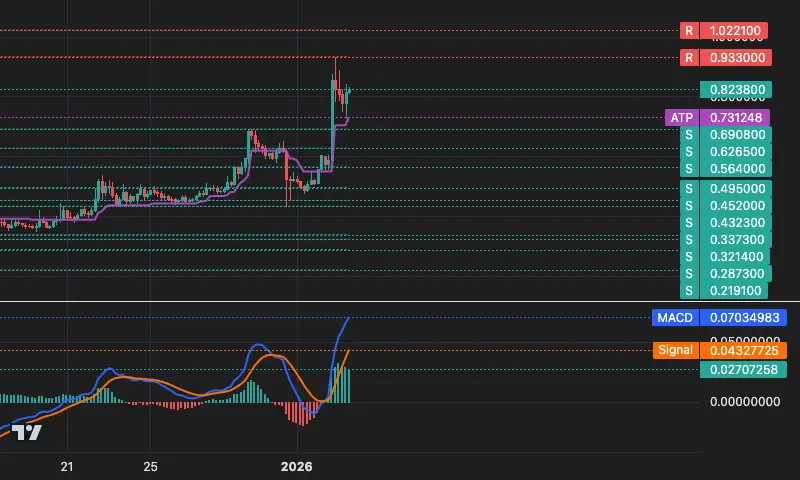
$PIEVERSE The 4H chart currently reports 0.8238, with the price repeatedly testing below the rising point of 0.8241, showing signs of fatigue 😐. Although still holding above the dynamic trailing stop line at 0.7312, it has retraced over 11% from the previous high of 0.9330.
While the MACD remains positive, the momentum bars have significantly contracted, indicating weakening upward momentum. The resistance at 0.9330 (previous high) is close above, and the key support below is the trend line at 0.7312.
Currently in the **trend stagnation** phase within a bullish trend, a strong candlestick is
PIEVERSE-10,62%
- Reward
- like
- Comment
- Repost
- Share
$BTC 1D cycle suspected of staging a textbook-level bear trap! 🚨
The price violently rebounded 73% after the ankle cut, now firmly above the trailing stop line, and significantly broke through the trend initiation point. Although MACD is below the zero line, its nearly 400% surge over the past ten days forms a strong bullish divergence with the price, indicating a fatal crack in the bearish trend!
Key current point: Can the price stabilize and break through the 0.2671 resistance? If successful, this "false breakout" will be declared a failure, and a trend reversal is imminent. Otherwise, it
BTC0,11%
- Reward
- like
- Comment
- Repost
- Share
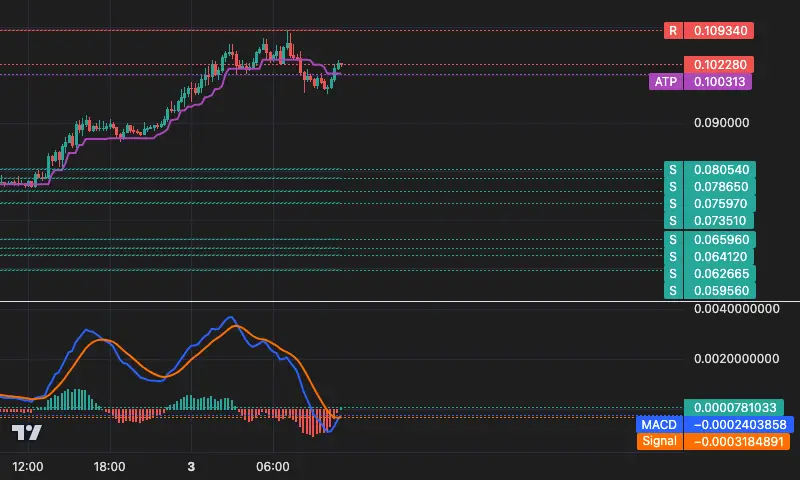
$USELESS 15m cycle current price 0.10228, rebounded 6.12%🔥 from the low of the downtrend at 0.09638. But the price is still below the key resistance at 0.10304 (trend starting point stop-loss reference), and after the rebound, the MACD golden cross momentum has significantly weakened📉. Currently above the trailing stop line at 0.10031, but the gap is less than ATR, indicating obvious upward pressure. Market condition: suspected trend reversal, beware of resistance and pullback near 0.10304.
USELESS12,94%
- Reward
- like
- Comment
- Repost
- Share
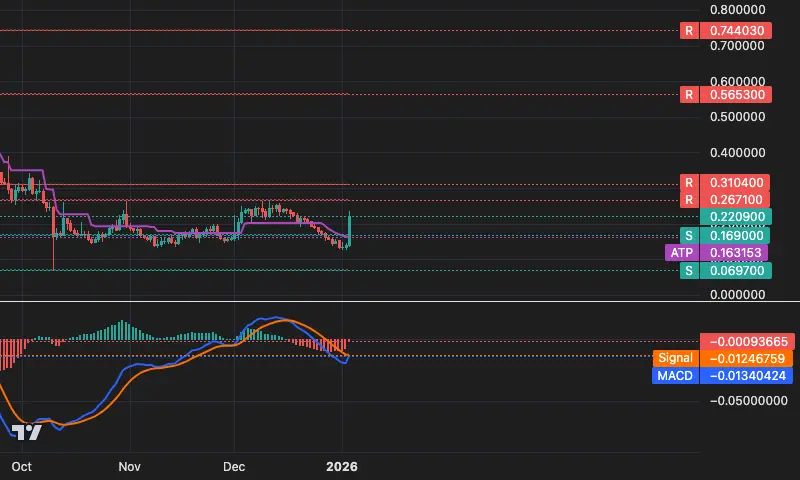
$PIEVERSE Breathing room in a bearish trend?😮💨
Current price is 0.7646, still below the trend initiation price of 0.8295, indicating the bearish pattern remains unchanged. But please note: 1) The price has rebounded above the latest trailing stop-loss line of 0.7564; 2) The MACD has just formed a golden cross, suggesting short-term momentum may fluctuate.
Key resistance is at 0.9330, with support seen at 0.5554. The current price is very close to the trend line, with only a 1.07% margin, making it very fragile. If it breaks below 0.7564, the downward trend could accelerate!🚨
(Compared to
PIEVERSE-10,62%

- Reward
- like
- Comment
- Repost
- Share
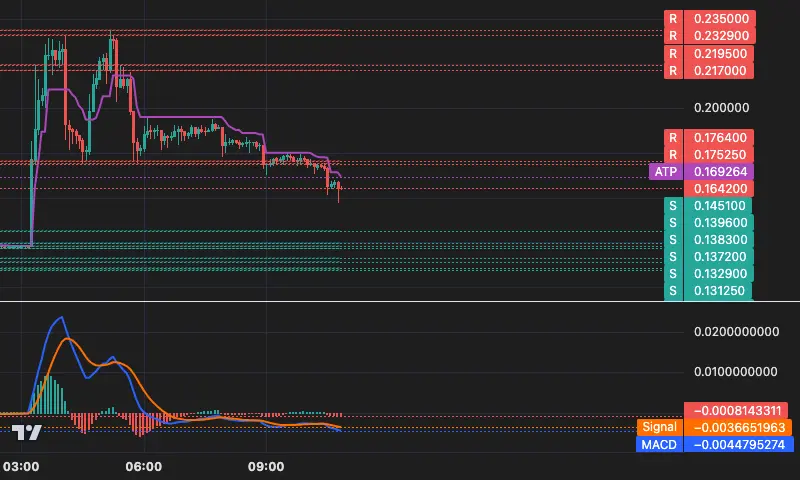
$B The bears are still in control! 😤
Since turning into a downtrend from 0.1851, the price has plummeted over 11%, with 61 candlesticks pressed to the ground and rubbing against each other. Currently, the 0.1642 price remains firmly suppressed below the dynamic resistance line at 0.1693, indicating a clear continuation of the bearish trend.
Although the MACD has shown slight recovery, it still operates below the zero line, merely a breather in the downtrend. The tracking line at 0.1693 above is the first key resistance; if the price cannot break back above it, any rebound is a selling opport
B52,49%
- Reward
- like
- Comment
- Repost
- Share
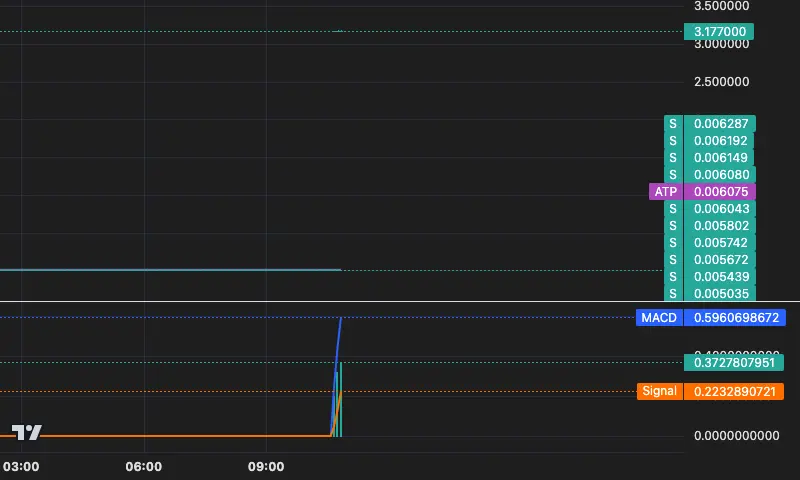
$FLUID After a crazy 520-fold surge, the bullish trend remains strong and unshaken! 🚀
Starting from 0.006, the current price remains firmly above 3.177, with an epic increase of 52,233.34%! The current price is well above the dynamic support (trailing stop line), with a gap far exceeding 3 times ATR, indicating extremely strong upward momentum.
MACD continues to form a golden cross, with the histogram significantly positive, and momentum is simultaneously strengthening. Although there are strong divergence signals suggesting increased volatility, the overall trend remains a clear upward ral
FLUID10,05%
- Reward
- like
- Comment
- Repost
- Share
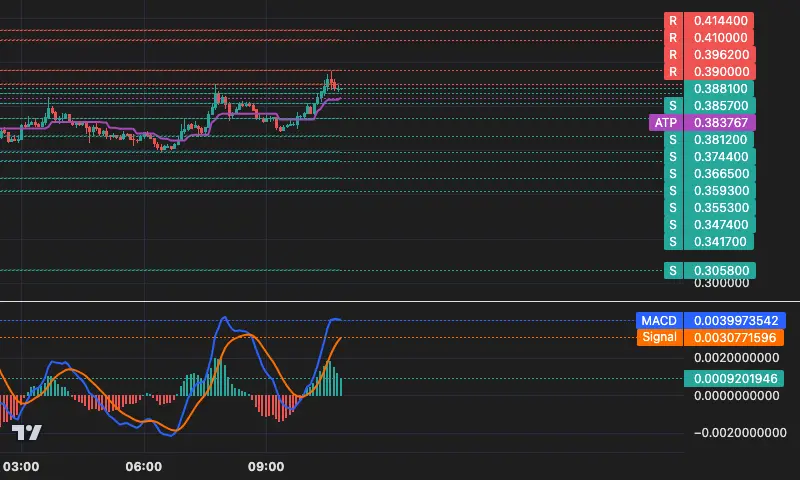
$CLO 5-minute chart, bulls are steadily in control! 🚀
The trend started from 0.3839, and the stepped trailing stop-loss line has been strongly moved up from 0.3776 to 0.3838, forming a solid dynamic support. The current price is 0.3881, operating above the line, confirming a bullish pattern.
MACD double lines are rising, with the momentum histogram significantly expanding, indicating strong buying power! Currently, attention should be paid to the resistance at 0.3900. If broken, there is potential to challenge the previous high around 0.3960 again.
Market status: Bullish trend continues. St
View Original
- Reward
- like
- Comment
- Repost
- Share
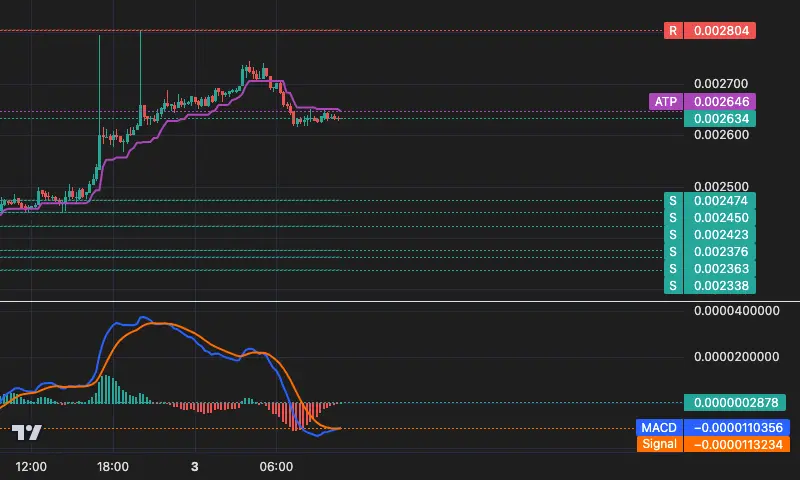
$CKB 15-Minute Chart Alert! 🚨
The bearish trend has continued for 16 candles. The current price of 0.002634 remains suppressed below the downtrend line (0.002646), and the situation is severe! ⚡️
Although the MACD shows a "golden cross," the dual lines and momentum bars have significantly weakened in recent days, indicating a lack of rebound strength and more of a continuation of the decline. The price is rubbing against the trend line, with a distance of less than 1 ATR. Beware of a trend reversal!
Key support is at the dense support zone of 0.002338-0.002474 below. If the price breaks be
CKB3,53%
- Reward
- 1
- Comment
- Repost
- Share
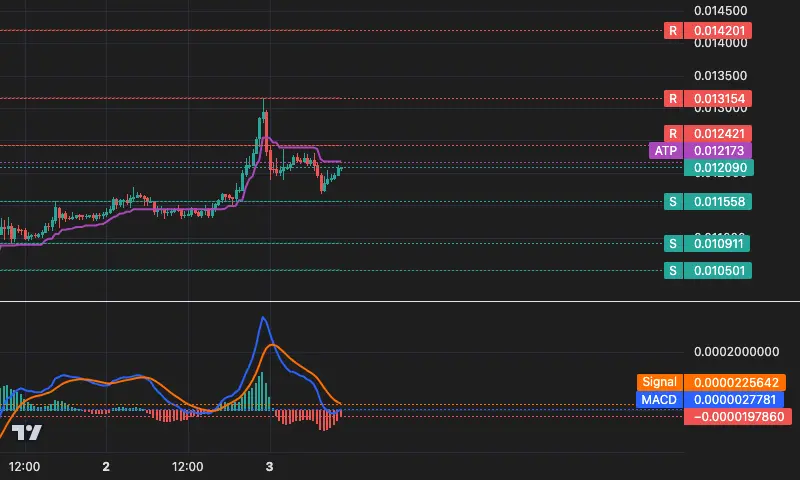
$BOB 30-minute chart: The bearish trend continues, and the price is struggling below a key resistance! 😤
Current price 0.01209, still below the downtrend tracking line at 0.01217 (which can be seen as dynamic resistance). The price rebounded but did not break through, indicating weak bullish momentum. Since entering the downtrend, the price has been hovering near the initiation price, with a gain of only 0.32%, showing a weak rebound.
The MACD double lines are below zero with a significantly negative histogram, indicating sustained bearish momentum. The price is pressing against the trendlin
BOB8,77%
- Reward
- like
- Comment
- Repost
- Share
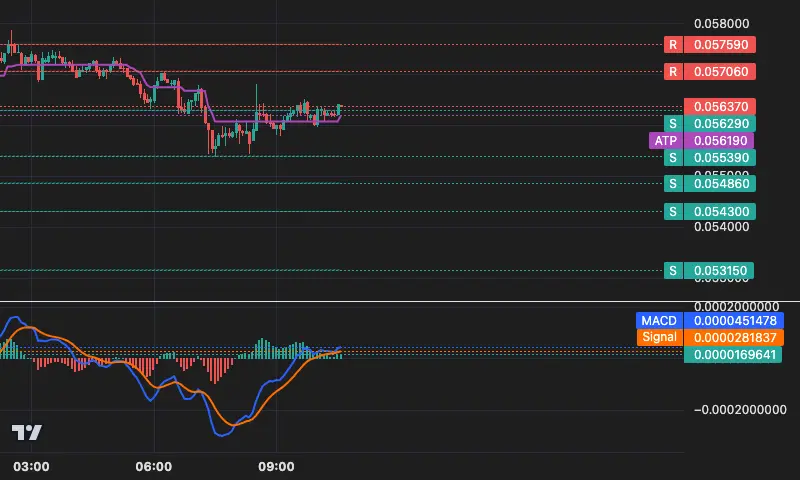
$PROMPT 5-minute chart just broke out! 📈
Current price is 0.05637, just above the stepwise dynamic support line (0.05619), indicating that the bullish trend may have already started.
The MACD double lines are crossing upward in a golden cross, and the momentum histogram has significantly increased, with strength soaring over 54% in the past 5 days! This is no small movement, indicating that the buying power is gathering strongly.
Currently, the price is tightly hugging the trend line with minimal pullback (<0.05%). Keep a close eye on the support zone at 0.05629-0.05607; holding steady coul
PROMPT6,18%
- Reward
- like
- Comment
- Repost
- Share
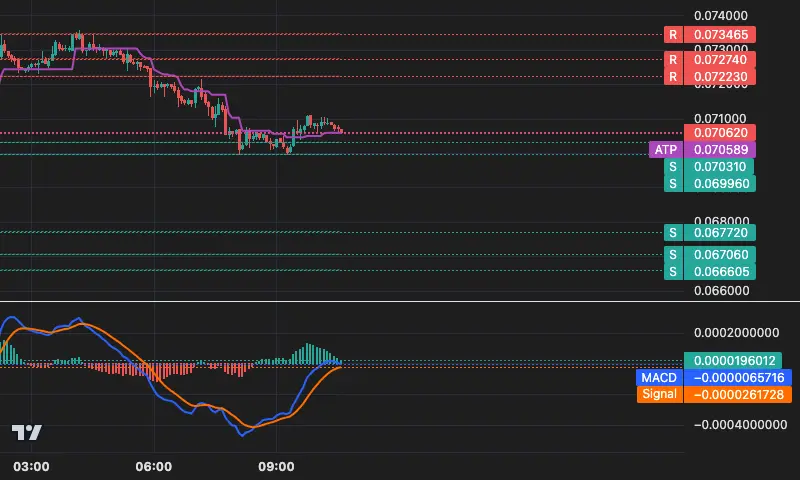
$IN 5m: Out of ammunition? 🔥
MACD bullish momentum has experienced a catastrophic plunge (down 157% over the past 5 days)! Although the indicator remains above the zero line, this warning should not be ignored.
The current price is 0.07062, awkwardly just above the trailing stop-loss line at 0.07059, still yielding a negative return compared to the entry price of 0.07107. This "uptrend" is unconvincing, more like a feeble rebound that has stalled.
Key levels: Strong support below at 0.07031; a break below this could significantly increase the risk of trend reversal. To regain bullish confi
IN3,07%
- Reward
- like
- Comment
- Repost
- Share
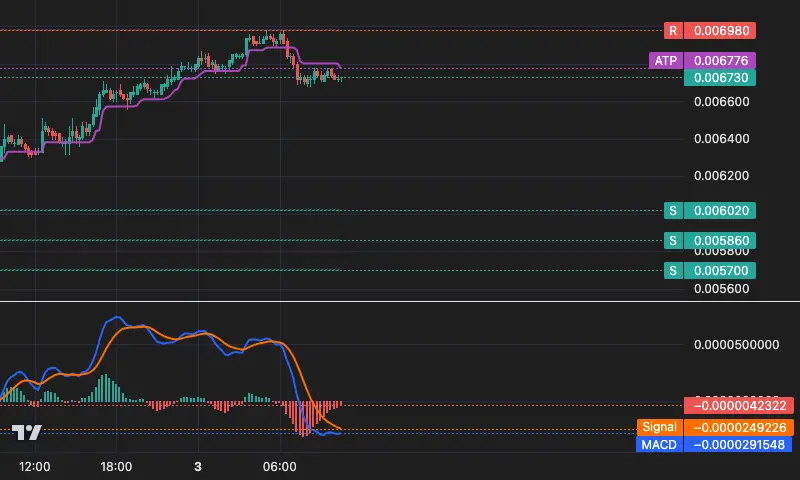
$GALA Boiling frogs in warm water, the bearish trend is still ongoing! 🚨
Since the downward trend started, the price has only rebounded weakly by 0.75%, not even reaching a decent ATR fluctuation. Currently at 0.00673, the price remains below the dynamic trailing stop line at 0.00678, firmly in a bearish suppression pattern.
The MACD double lines are below the zero axis, with the histogram showing significant negative values, indicating that the bearish momentum is still dominant. The nearest strong support below is at 0.00602, and the nearest resistance above is at 0.00698.
With this movem
GALA2,14%
- Reward
- like
- Comment
- Repost
- Share
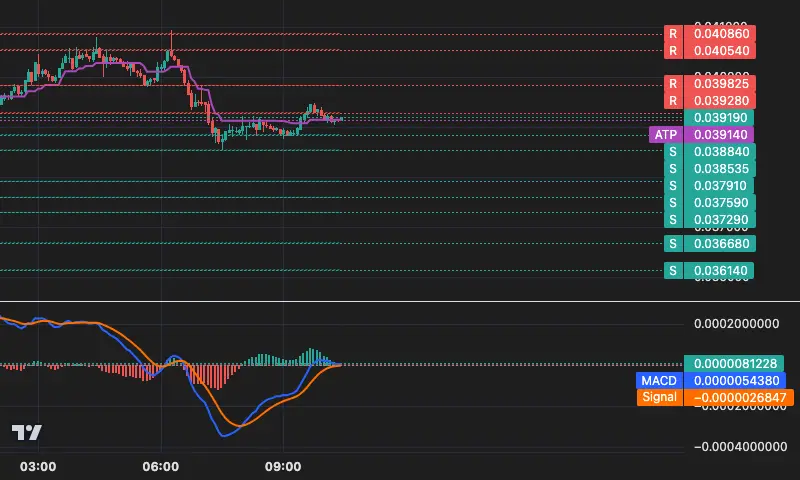
$DEEP
【Bullish Defense Line in Urgent Trouble?】📉
5-minute chart, the upward trend initiated by DEEP at 0.03945 is facing a severe test! The current price is 0.03919, still above the dynamic trailing stop-loss line at 0.03914, but it has broken below the entry price and retraced 0.71% from the high.
More importantly, the MACD momentum bars have decayed by over 73% in the past 5 days!📉 This indicates that the upward momentum is rapidly diminishing.
Currently at a critical point between bulls and bears. Holding above 0.03914 means the trend remains intact; once it falls below, beware of a sh
DEEP3,53%
- Reward
- like
- Comment
- Repost
- Share
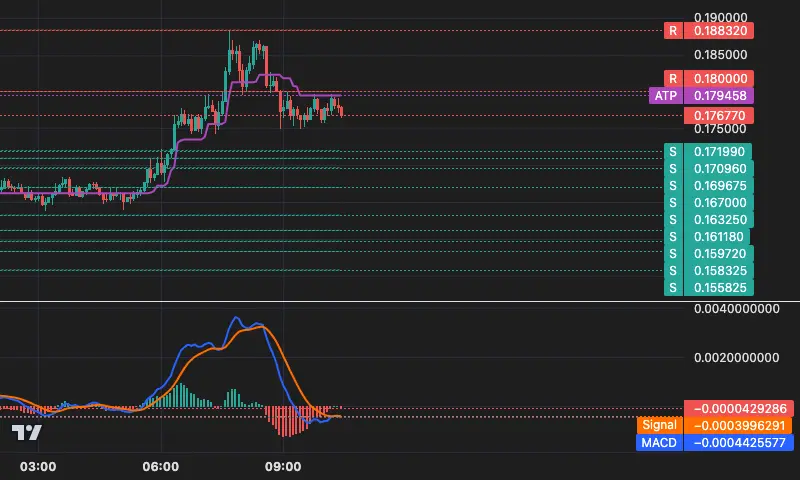
$LYN The bears are firmly in control! The 5-minute chart shows that after turning down from 0.17791, the price has been suppressed by the trailing stop at 0.17946, with no rebound strength. The MACD has formed a death cross at a high level and continues to weaken, indicating significant bearish momentum🔻.
Currently, the price is under pressure below the 0.17946 trendline, with strong resistance at 0.18000 above. The bearish trend continues, with key support around 0.17199. The bulls have not regained the trendline, making it difficult for a rally💪.
Currently, the price is under pressure below the 0.17946 trendline, with strong resistance at 0.18000 above. The bearish trend continues, with key support around 0.17199. The bulls have not regained the trendline, making it difficult for a rally💪.
View Original
- Reward
- like
- Comment
- Repost
- Share
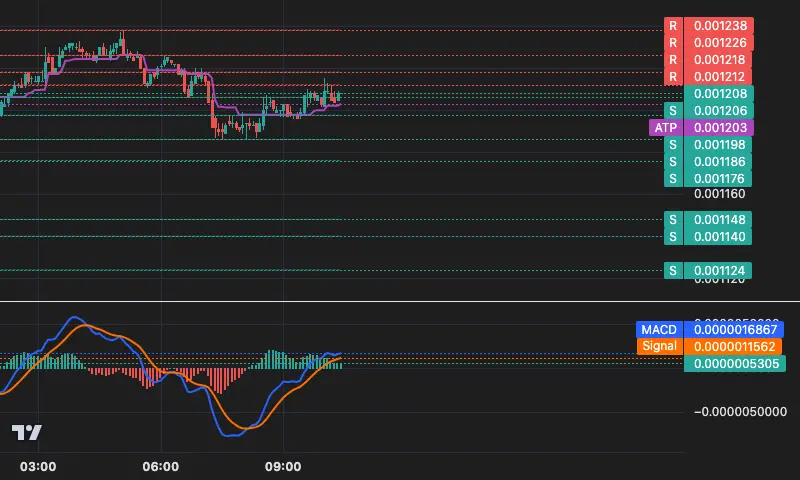
$DEGEN 📈 Consolidating at high levels, the bullish trend remains!
After reaching a new high of 0.001215 and then a slight pullback, the current price is 0.001208, still firmly above the key trailing stop-loss line (0.001203) 🛡️. The upward trend structure established by the past 8 K-lines has not been broken.
Although the MACD has recently dipped slightly by 1.74%, the histogram remains significantly positive, and there has been a 220% surge in the past 10 days, indicating that bullish momentum is still strong. The current price is close to the 0.001212 resistance; if a volume breakout oc
DEGEN3,98%
- Reward
- like
- Comment
- Repost
- Share
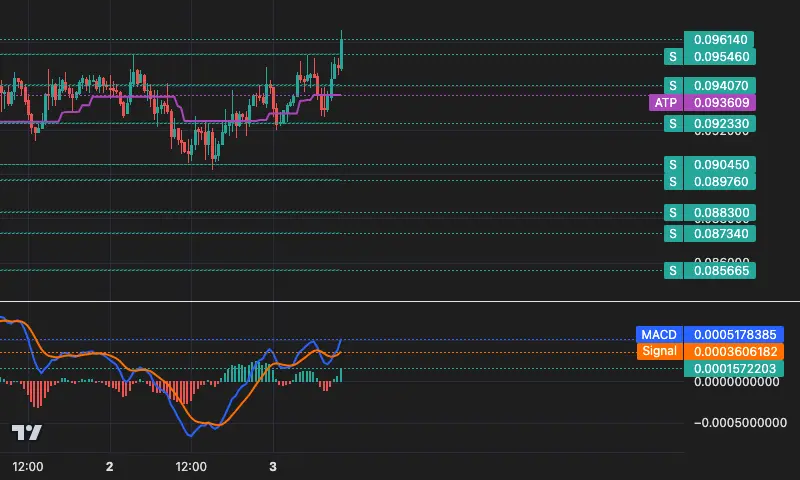
$C The rally started from 0.09351 and has already gained 2.81%📈! The 30-minute chart shows a stepwise upward trend line (currently at 0.09361) continuously providing dynamic support, and the price remains steadily above it.
The MACD double lines are crossing upward in a golden cross, with the momentum histogram expanding strongly by nearly 150%🚀, but a strong bearish divergence signal has appeared⚠️, so caution is needed for short-term pullback risk.
Currently, the bullish trend is still ongoing, but the upward space faces divergence tests. Keep a close eye on the trendline support; if it
C12,84%
- Reward
- like
- Comment
- Repost
- Share
Trending Topics
View More19.75K Popularity
58.19K Popularity
66.74K Popularity
101.99K Popularity
4.07K Popularity
Pin