$BTC Technical Analysis & Price Forecast
Bitcoin is currently retesting the resistance of a symmetric triangle. A successful breakout above this channel could push the price toward $98,000. At the time of writing, BTC is trading around $91,200.
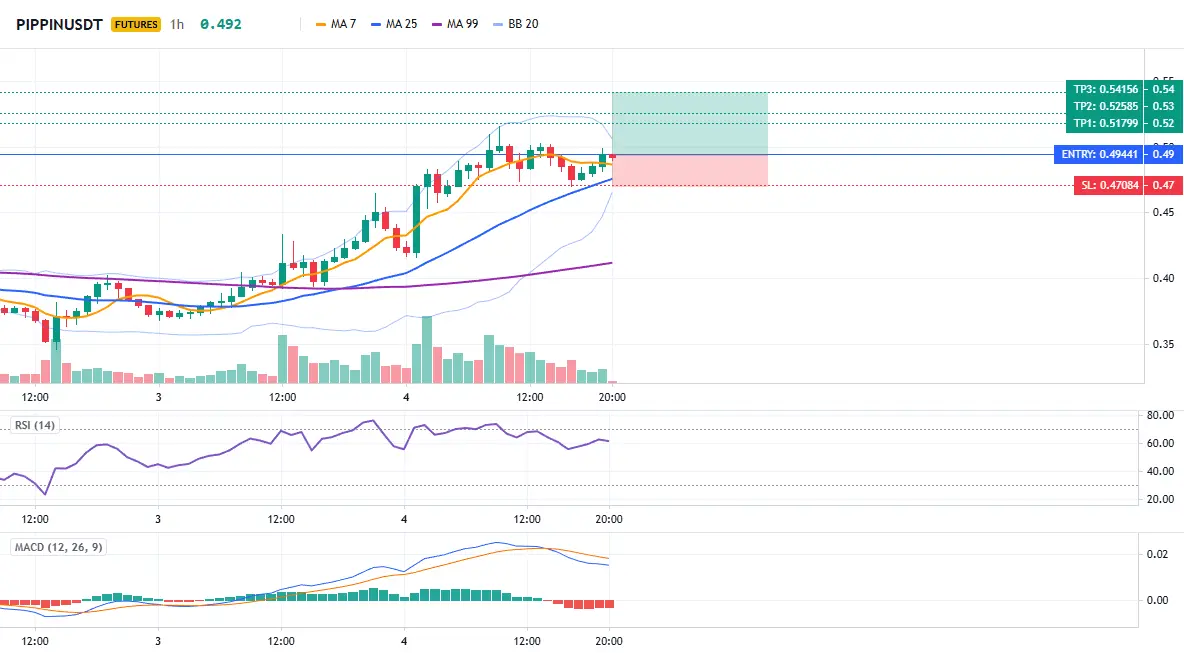
RSI (Relative Strength Index): 58 – above the neutral 50 level, signaling strong buying demand. Maintaining RSI above 50 will be key for sustaining bullish momentum.
MACD (Moving Average Convergence Divergence): The indicator shows rising demand with a bullish crossover and green histogram formation, supporting a continuation of the uptrend.
Risks: A re
Bitcoin is currently retesting the resistance of a symmetric triangle. A successful breakout above this channel could push the price toward $98,000. At the time of writing, BTC is trading around $91,200.
RSI (Relative Strength Index): 58 – above the neutral 50 level, signaling strong buying demand. Maintaining RSI above 50 will be key for sustaining bullish momentum.
MACD (Moving Average Convergence Divergence): The indicator shows rising demand with a bullish crossover and green histogram formation, supporting a continuation of the uptrend.
Risks: A re