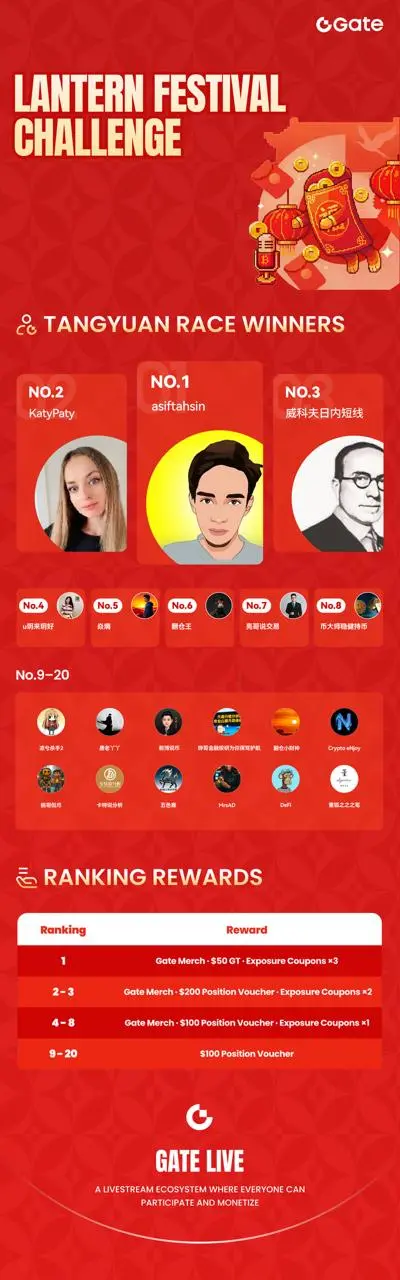
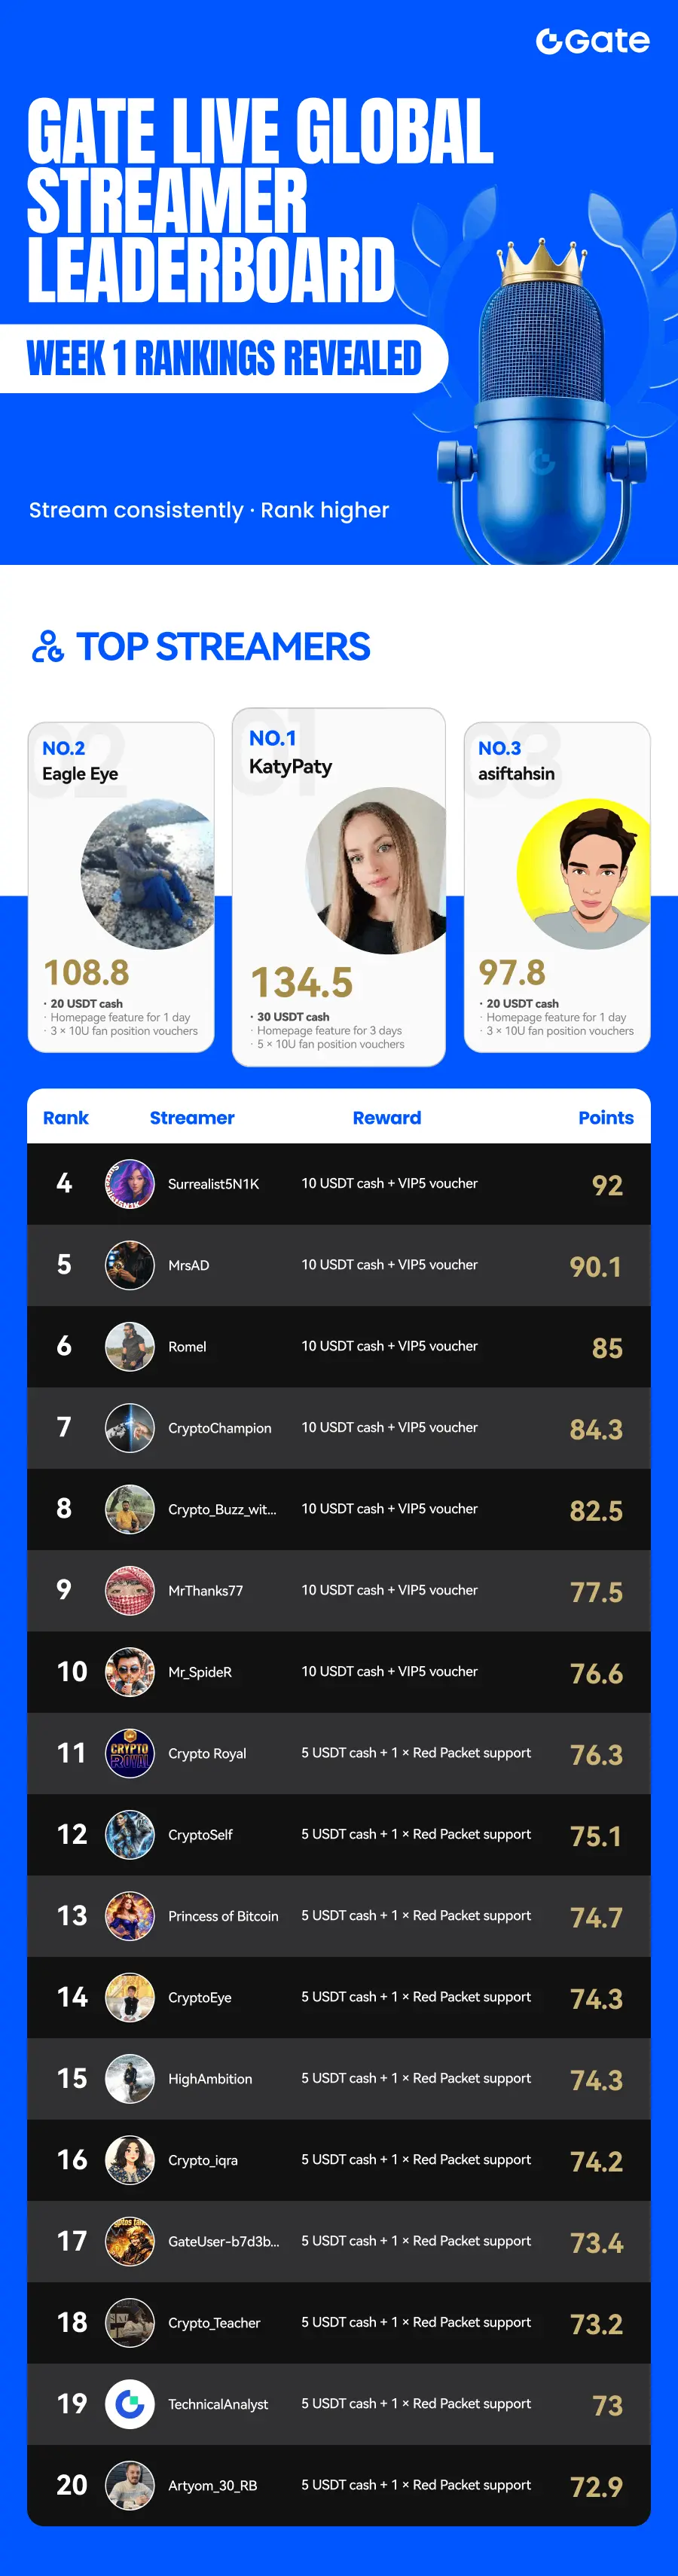
KatyPaty
vip
DeFi Analyst
Futures Trading Strategist
No content yet
Welcome to KatyPaty's livestream channel.
  • Reward
  • 1
  • Repost
  • Share
TiVuavip:
Jump into 🚀
Welcome to KatyPaty's livestream channel.
  • Reward
  • 1
  • Repost
  • Share
CryptoChampionvip:
Watching Closely 🔍
📊📈📉#DecemberMarketOutlook
Bitwise BITW Debuts on NYSE Arca: Structured Market Access and New Rules of the Game
The crypto industry has received an important institutional signal: the Bitwise 10 Crypto Index ETF (BITW), one of the world’s first cryptocurrency index products, which has provided qualified investors with access to a diversified portfolio since 2017, is now trading on the NYSE Arca exchange (NYSE). This marks a significant transition to a new status and a strategic shift for the fund.
Key Changes and New (ETP) Structure:
1. Transition to the open market: BITW is changing its fo
BTC-2.57%
ETH-3.4%
SOL-5.31%
XRP-3.22%
View Original
post-image
  • Reward
  • 21
  • Repost
  • Share
ExterminateCultivationAndDrivevip:
This post is truly inspiring, making me realize that leaving a "meaningful comment" on GateLive is not only about participation but also an excellent opportunity for learning and receiving feedback. I will follow your example by thinking more, asking more questions, and sharing analyses more actively, becoming a proactive member of the community! Congratulations on your award, I will take you as a role model and work towards this goal! Let's learn and grow together on GateLive!🚀
View More
📊📈📉HYPE/USDT: Testing key support. Is a reversal brewing after a deep correction?
The HYPE token is showing a classic technical pattern of an asset in a strong drawdown, but with signs of a possible bottoming out.
Key chart observations:
1. Pronounced downtrend: The price is in a long-term declining channel, consistently forming lower lows and lower highs. Current trading near the $28.978 level is testing a critical zone.
2. Indicator conflict: oversold vs. momentum:
· Oversold (Bullish signal): The RSI index (6) is deep in the oversold zone (~25.8), which often precedes a technical rebo
HYPE-4.63%
View Original
post-image
post-image
  • Reward
  • 14
  • Repost
  • Share
LittleGodOfWealthPlutusvip:
2025 Gogogogo
View More
ETH/USDT: Upward Momentum Ahead of the Fed Decision. Chart Analysis and Key Levels
Amid expectations for the key Fed decision, ETH is showing technically significant growth, breaking through local resistances and strengthening above a psychologically important level.
Key Chart Observations:
1. Clear Uptrend: Price is confidently trading above moving averages, making an impulsive move from the $3,090 (24h Low) area to current levels around $3,360.
2. Breakout and Consolidation: A significant event was the break above the resistance zone near $3,300. It is now being tested as new support. This i
ETH-3.4%
View Original
post-image
post-image
  • Reward
  • 12
  • Repost
  • Share
CryptoChampionvip:
HODL Tight 💪
View More
#FedRateCutPrediction
Final Fed Decision of 2025: Will the Rate Be Cut to 3.75%? Data Analysis:
Markets will be focused on December 10, 2025, at 22:00 MSK. The Federal Reserve will announce the results of its last rate meeting of the year. Current forecasts, based on aggregated data, indicate a high probability that the easing cycle will continue: the projected rate is 3.75% versus the previous value of 4.0%.
If the forecast comes true, this would mean a 25 basis point cut, continuing the trend shown in the chart (decline from 4.5%).
Context and Political Background: This decision is being ma
BTC-2.57%
View Original
post-image
post-image
  • Reward
  • 14
  • Repost
  • Share
RandomThePriceOfBitconvip:
The decline in Bitcoin's alleged volatility weakens the case for a year-end rally.
View More
BTC/USDT Analysis: Cautious Rebound or Bull Trap?
The current situation on the BTC chart (data at the time of screenshot) and Glassnode analysts' conclusions are surprisingly in sync, painting a picture of an uncertain recovery.
📊 Technical Picture (by the chart):
· Price: $90,256, which is below the key level at $92,000 and under the important Bollinger middle band (~$89,291). The price is balancing at the lower edge of the recent range.
· Indicators:
· BOLL: Price is between the middle band and the lower band (LB ~$84,614), indicating selling pressure.
· Volume (Vol): Declining volume (
BTC-2.57%
View Original
post-image
post-image
  • Reward
  • 15
  • Repost
  • Share
Repanzalvip:
Bull Run 🐂
View More
Welcome to KatyPaty's livestream channel.
  • Reward
  • 6
  • Repost
  • Share
ROCKSTAR33vip:
Ape In 🚀
View More
Welcome to KatyPaty's livestream channel.
  • Reward
  • 3
  • Repost
  • Share
SuiCraftvip:
Watching Closely 🔍
View More
Welcome to KatyPaty's livestream channel.
  • Reward
  • 4
  • Repost
  • Share
CryptoChampionvip:
HODL Tight 💪
View More
ℹ️🤔Weakening Bullish Momentum: BTC Tests Key Levels, Correction Risk Down to $87 000
On the daily BTC/USDT chart, momentum has been lost after the recent rally. The price is consolidating below the psychological mark at $94 000, and current levels and indicators are signaling a possible shift in the short-term trend.
Key chart observations:
1. Price and Structure: After reaching a high around $94 189.8, the asset faced selling pressure and pulled back to $92 303.4. Notably, local lows are getting lower, which may indicate weakening bulls.
2. Critical Support Level: The most significant zone i
BTC-2.57%
View Original
post-image
  • Reward
  • 27
  • Repost
  • Share
ROCKSTAR33vip:
Bull Run 🐂
View More
#ReboundTokenstoWatch
ETH: Is the Path to $3,300–3,600 Open? Analyzing Key Signals
ETH’s current momentum is catching attention: the price is confidently holding above $3,140, demonstrating a 5.30% increase over the past 24 hours. Let’s look at why a move toward the $3,300–3,600 range appears realistic.
Key data at the time of analysis:
· Price: $3,144.23
· Trend: Bullish (rise from the $2,977.02 low)
· Volume: Above average (145.50K ETH), confirming strong interest.
What does technical analysis say?
1. Break and hold above a key level: The price has consolidated above the psychological mark
ETH-3.4%
View Original
post-image
  • Reward
  • 22
  • Repost
  • Share
ROCKSTAR33vip:
Bull Run 🐂
View More
#LINKETFToLaunch
The statement by the president of The ETF Store regarding the potential launch of the first spot LINK ETF in the coming days represents a significant fundamental factor. ETFs, especially spot (physical), simplify access to the asset for institutional and retail investors, bypassing the complexities of direct storage and management of cryptocurrency. Historically, (in the case of BTC and ETH), such events have been powerful catalysts for growth, shaping long-term capital inflows.
2. Technical picture ( at the time of data )
The LINK/USDT chart, however, shows signs of weakness
BTC-2.57%
ETH-3.4%
View Original
post-image
  • Reward
  • 34
  • Repost
  • Share
CHAITHUvip:
thank you for the information
View More
Welcome to KatyPaty's livestream channel.
  • Reward
  • 4
  • Repost
  • Share
Ybaservip:
hello
View More
🌟Gate Live - HODLer Airdrop (NESS)
• Project link:
• Project info: • GateLive room link: • Register on
• Watch me on YT:
NESS-3.86%
post-image
  • Reward
  • 14
  • Repost
  • Share
UQueenvip:
1000x Vibes 🤑
View More
🫣😁📈📉📊 When your strategy says "no", but FOMO screams "LET'S GO!" 😂
Do you know what's funny in crypto? Sometimes the "funniest" moment is when you're no longer laughing, but quietly sitting and looking at the screen with the chart with the face of a philosopher. 🤔
Here is my story, not about giggles and laughs, but about liquidation. The biggest loss in my crypto life! I usually have a strategy-discipline: no new tokens when trading futures, only the tested ones: BTC, ETH. But that day… that day I really wanted to earn. And you know what, I actually earned! 🎉
I earned -606
BTC-2.57%
ETH-3.4%
View Original
post-image
post-image
post-image
  • Reward
  • 18
  • Repost
  • Share
AnnaCryptoWritervip:
Thank you for sharing. Everything will be fine!
View More
Welcome to KatyPaty's livestream channel.
  • Reward
  • 4
  • Repost
  • Share
UQueenvip:
HODL Tight 💪
View More
📊📉📈Analysis of DOGE/USDT: consolidation continues, but ETFs may become a catalyst.
At the moment, the DOGE/USDT pair is showing sideways movement in the range of $0.147-$0.150. Technical indicators are showing mixed signals:
• The price is trading below the Bollinger middle line ($0.154), which indicates short-term pressure.
•Trading volumes are below average values (MA5: 138M), indicating a lack of strong interest.
•MACD shows a weak positive momentum (DIFF > DEA), but both indicators are close to the zero line.
Potential catalyst: spot ETFs
Despite the modest performance of current ETF fl
DOGE-5.34%
View Original
post-image
post-image
  • Reward
  • 22
  • Repost
  • Share
AnnaCryptoWritervip:
Vryvaytes 🚀
View More
  • Trending TopicsView More
  • Pin
Trade Crypto Anywhere Anytime
qrCode
Scan to download Gate App
Community
  • 简体中文
  • English
  • Tiếng Việt
  • 繁體中文
  • Español
  • Русский
  • Français (Afrique)
  • Português (Portugal)
  • Bahasa Indonesia
  • 日本語
  • بالعربية
  • Українська
  • Português (Brasil)