Trade
Trading Type
Spot
Trade crypto freely
Alpha
Points
Get promising tokens in streamlined on-chain trading
Pre-Market
Trade new tokens before they are officially listed
Margin
Magnify your profit with leverage
Convert & Block Trading
0 Fees
Trade any size with no fees and no slippage
Leveraged Tokens
Get exposure to leveraged positions simply
Futures
Futures
Hundreds of contracts settled in USDT or BTC
Options
HOT
Trade European-style vanilla options
Unified Account
Maximize your capital efficiency
Demo Trading
Futures Kickoff
Get prepared for your futures trading
Futures Events
Participate in events to win generous rewards
Demo Trading
Use virtual funds to experience risk-free trading
Earn
Launch
CandyDrop
Collect candies to earn airdrops
Launchpool
Quick staking, earn potential new tokens
HODLer Airdrop
Hold GT and get massive airdrops for free
Launchpad
Be early to the next big token project
Alpha Points
NEW
Trade on-chain assets and enjoy airdrop rewards!
Futures Points
NEW
Earn futures points and claim airdrop rewards
Investment
Simple Earn
Earn interests with idle tokens
Auto-Invest
Auto-invest on a regular basis
Dual Investment
Buy low and sell high to take profits from price fluctuations
Soft Staking
Earn rewards with flexible staking
Crypto Loan
0 Fees
Pledge one crypto to borrow another
Lending Center
One-stop lending hub
VIP Wealth Hub
Customized wealth management empowers your assets growth
Private Wealth Management
Customized asset management to grow your digital assets
Quant Fund
Top asset management team helps you profit without hassle
Staking
Stake cryptos to earn in PoS products
BTC Staking
HOT
Stake BTC and earn 10% APR
GUSD Minting
Use USDT/USDC to mint GUSD for treasury-level yields
More
UnlimitedCryptoTrading
No content yet
UnlimitedCryptoTrading
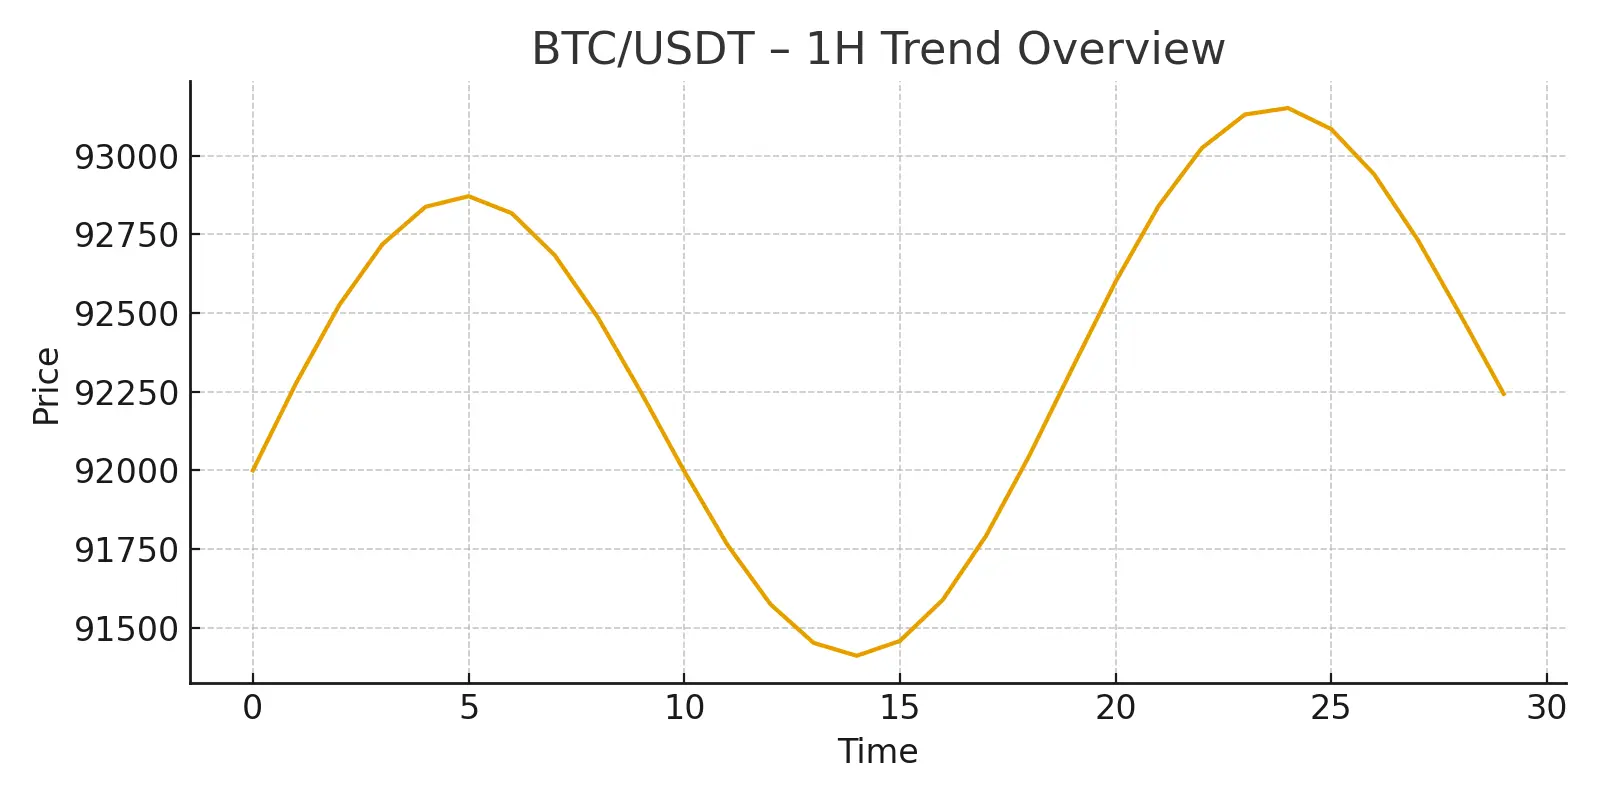
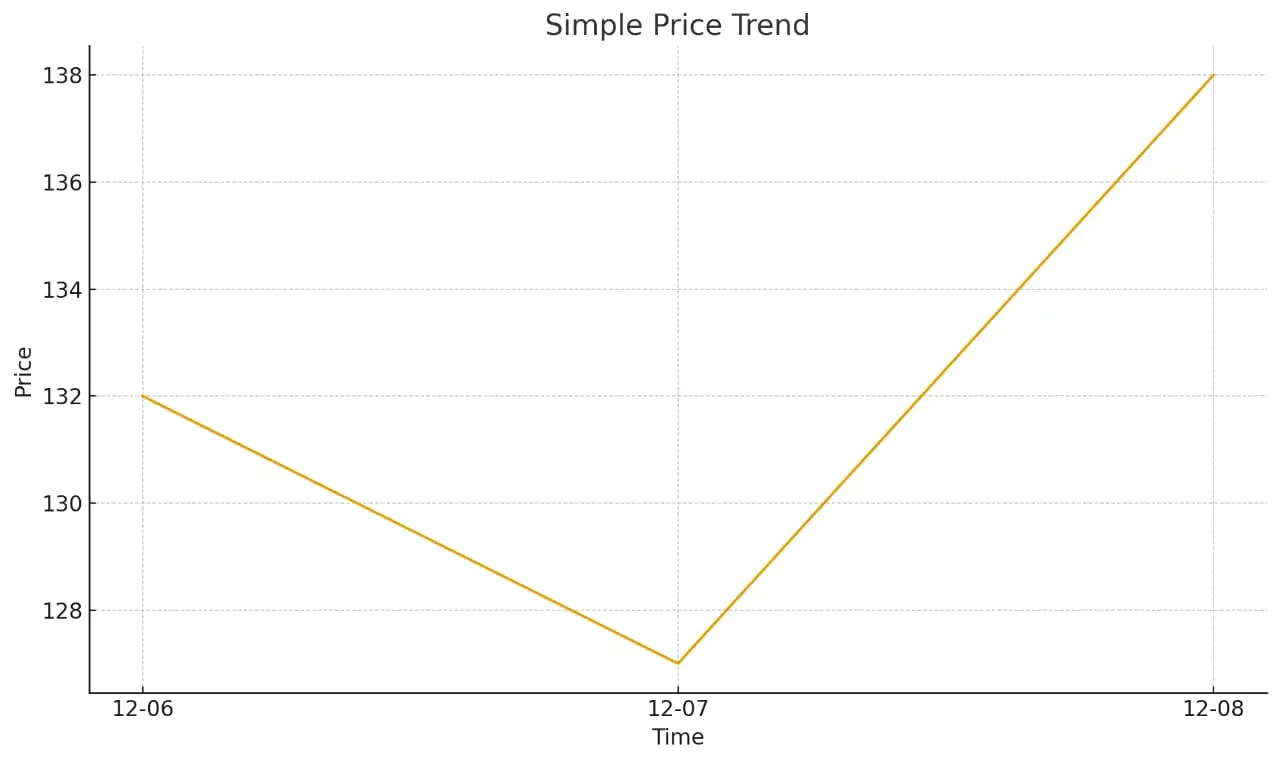
$BTC The market has been moving in a tight range after yesterday’s strong push, and price is now stabilizing around the mid-zone. Buyers are still showing interest, but momentum is slowing down compared to the earlier impulse move.
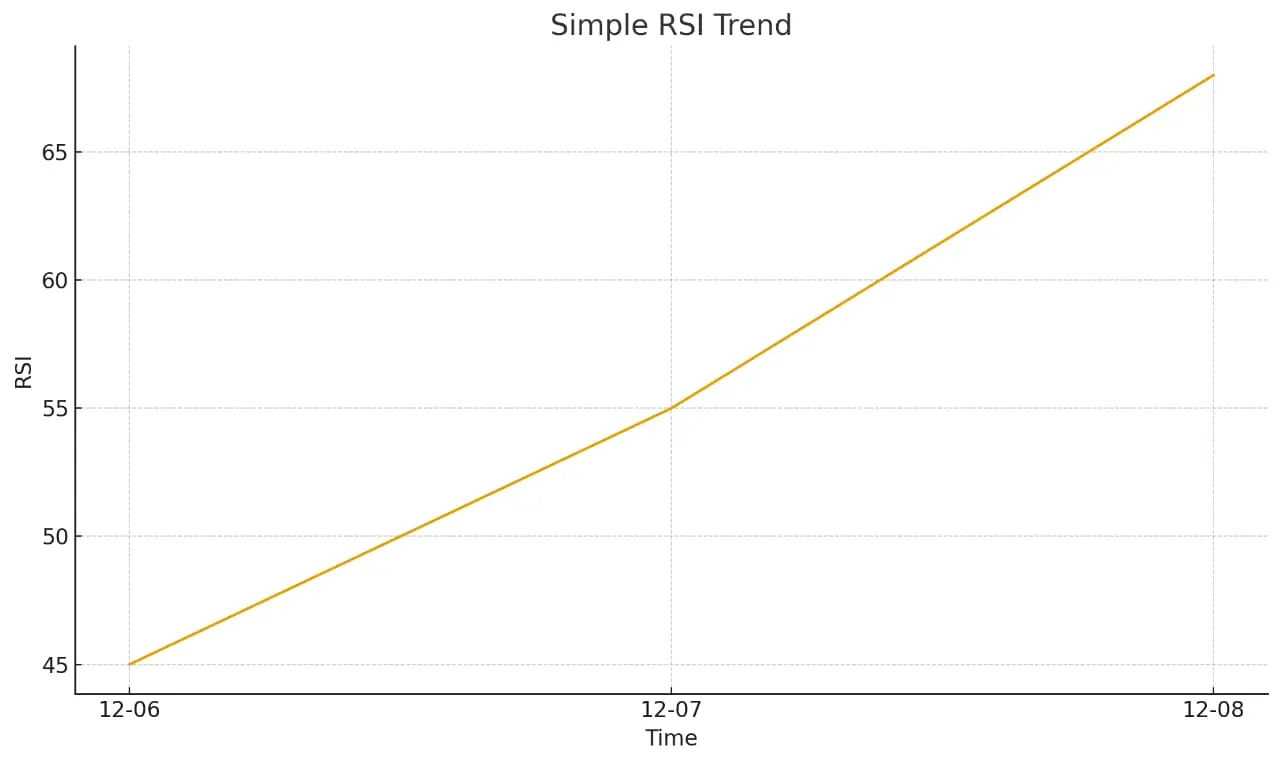
On the 1H chart, the candles are holding above the short-term moving averages, which suggests the trend hasn’t broken yet. At the same time, the indicators are showing mixed signals — RSI is hovering near the mid-50s level, showing neither overbought nor oversold, while MACD is cooling off after a bullish wave.
Future Outlook (Refined with multiple timeframes)
Sho
BTC1.65%
- Reward
- 1
- Comment
- Repost
- Share
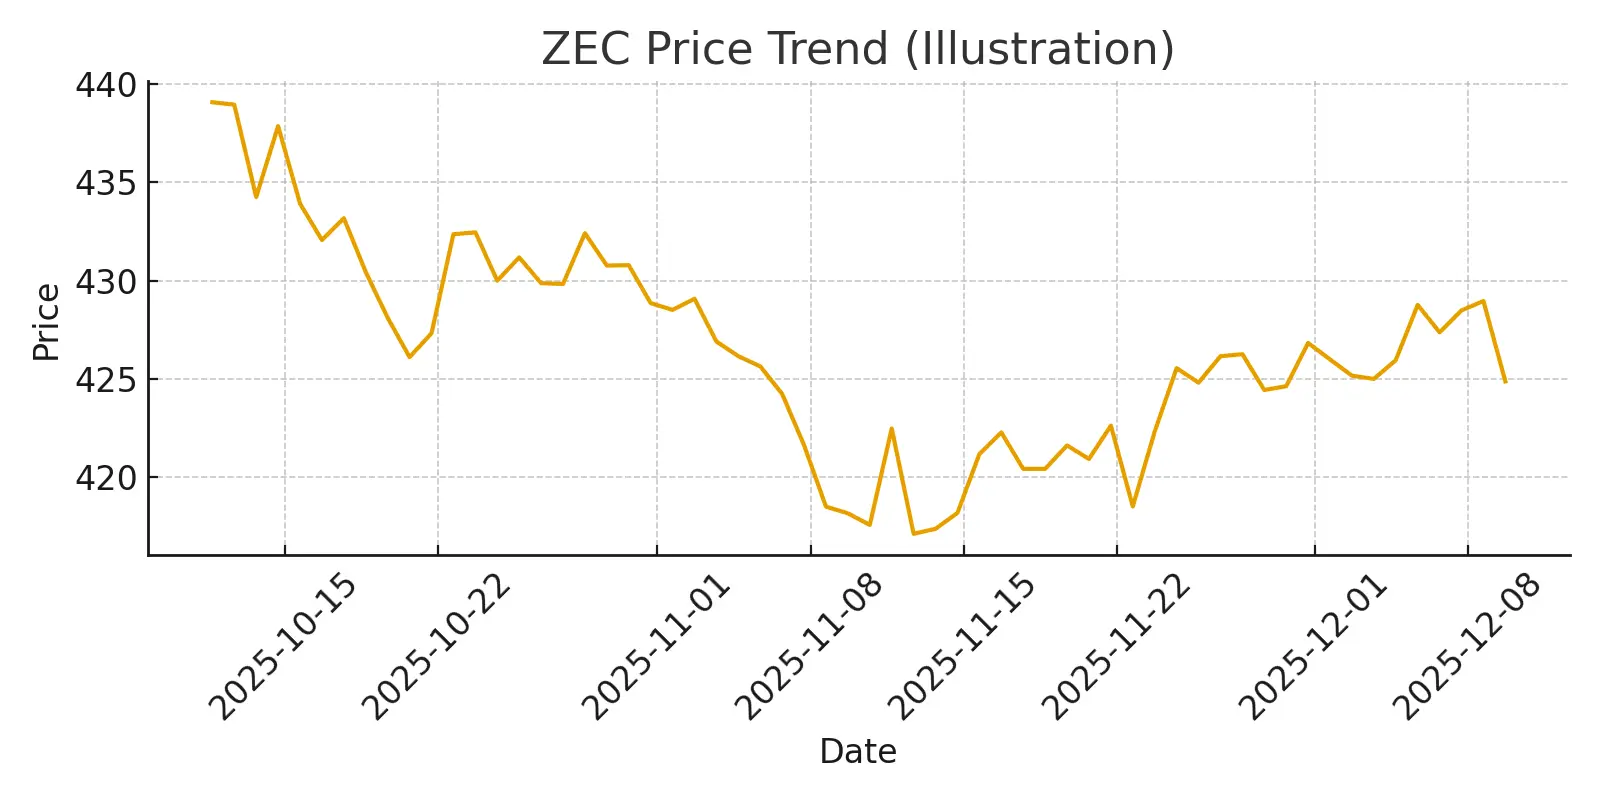
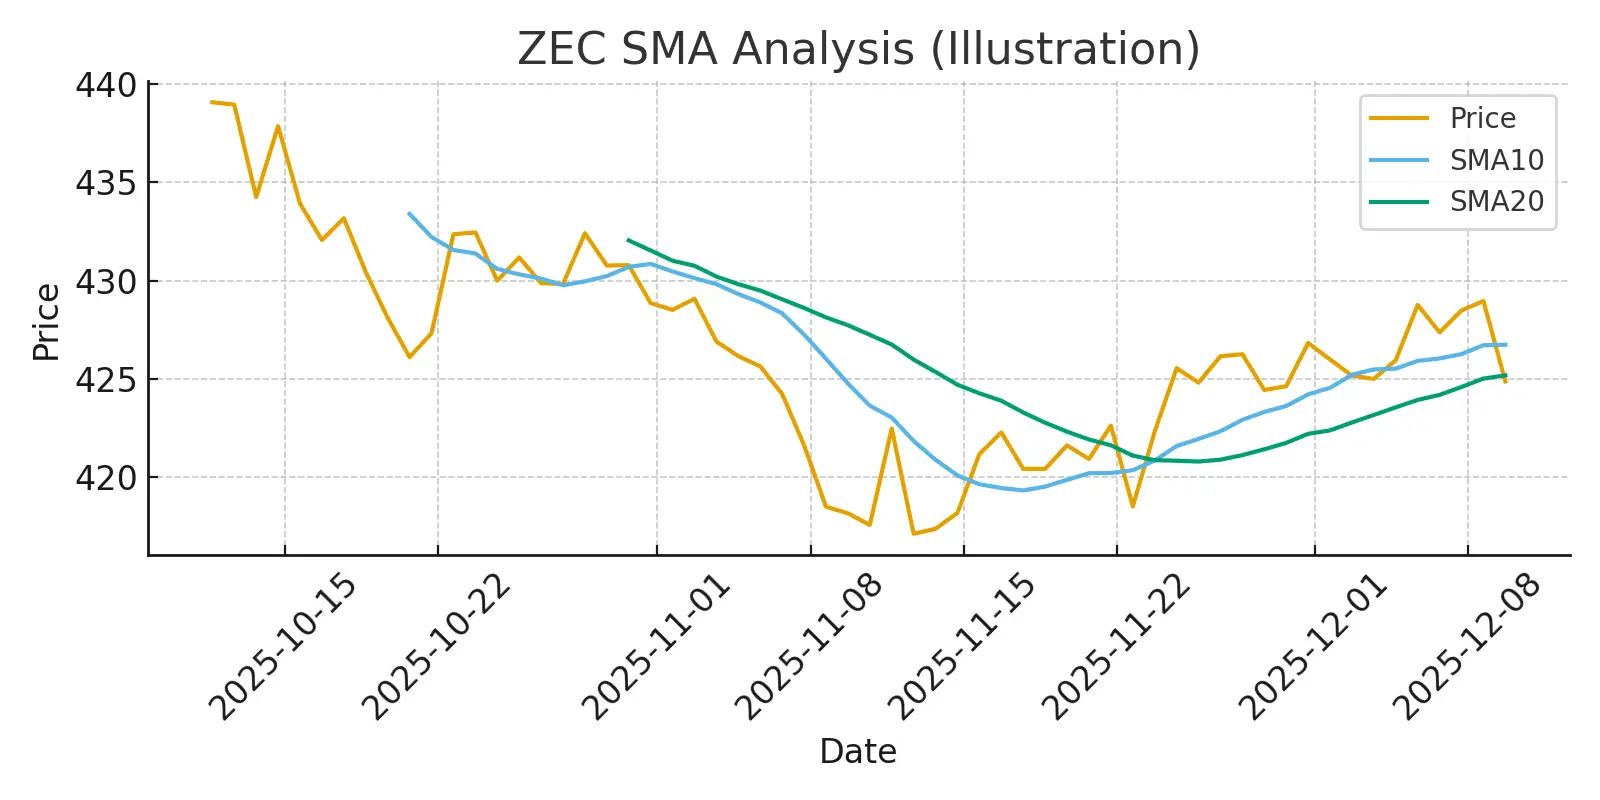
$ZEC ZEC Market Update & Quick Outlook (Personal View Only)
ZEC has been showing strong momentum lately, climbing back above the $440+ zone with solid candles and steady volume. The move from the recent dip looks healthy, and buyers are still active.
1H View:
The price is riding close to the upper Bollinger Band, which usually means strong momentum but also signals a possible short cooldown. MACD is still positive, and RSI is leaning toward the overbought zone — not a bad sign, just showing strength.
Short-Term Prediction (1H–4H):
If momentum holds, a push toward $450–$460 looks possible.
If
ZEC-0.27%
- Reward
- 1
- Comment
- Repost
- Share
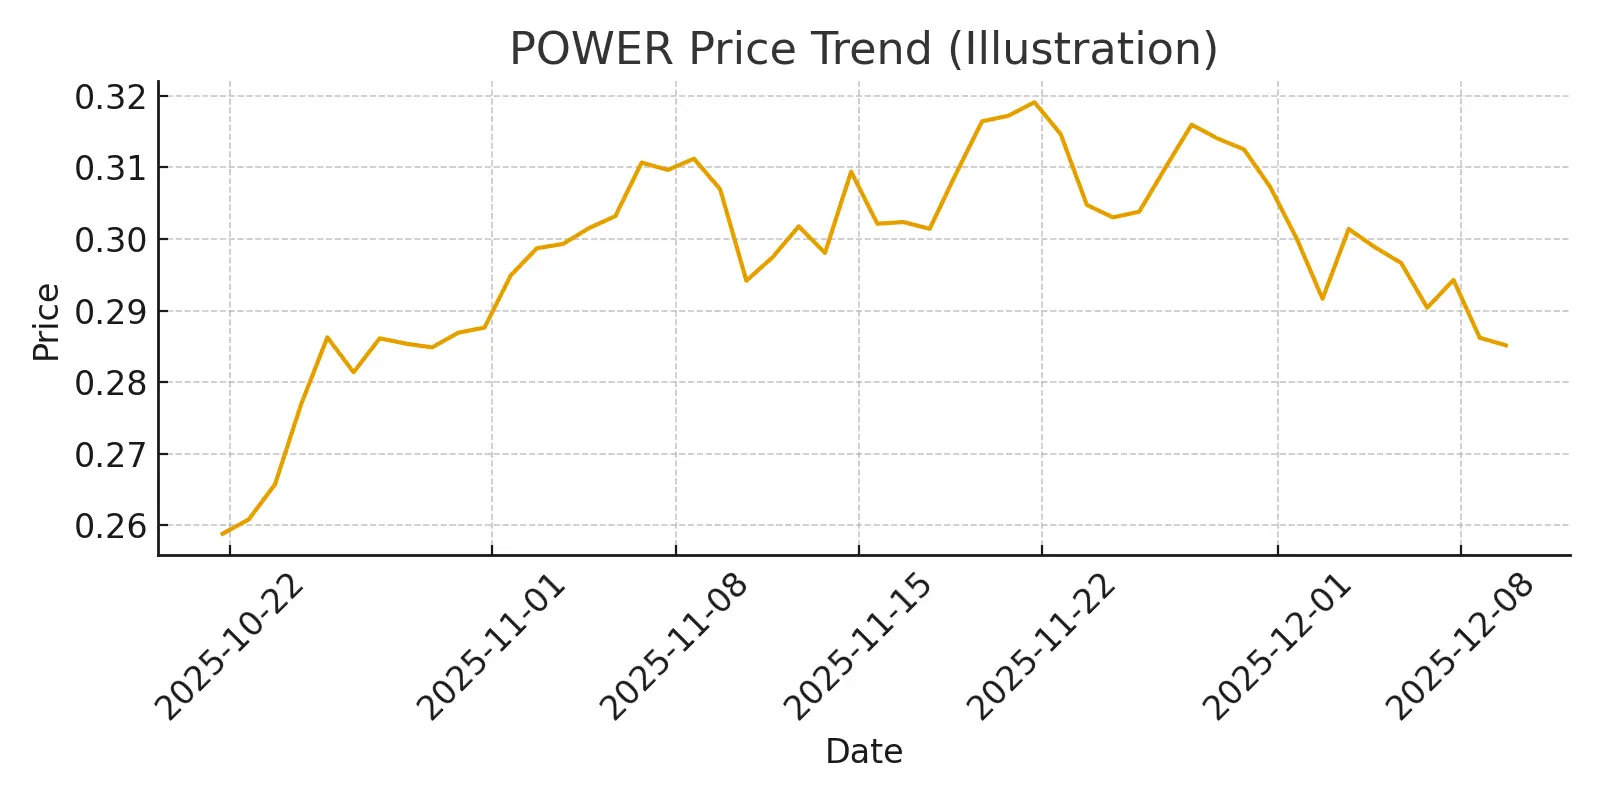
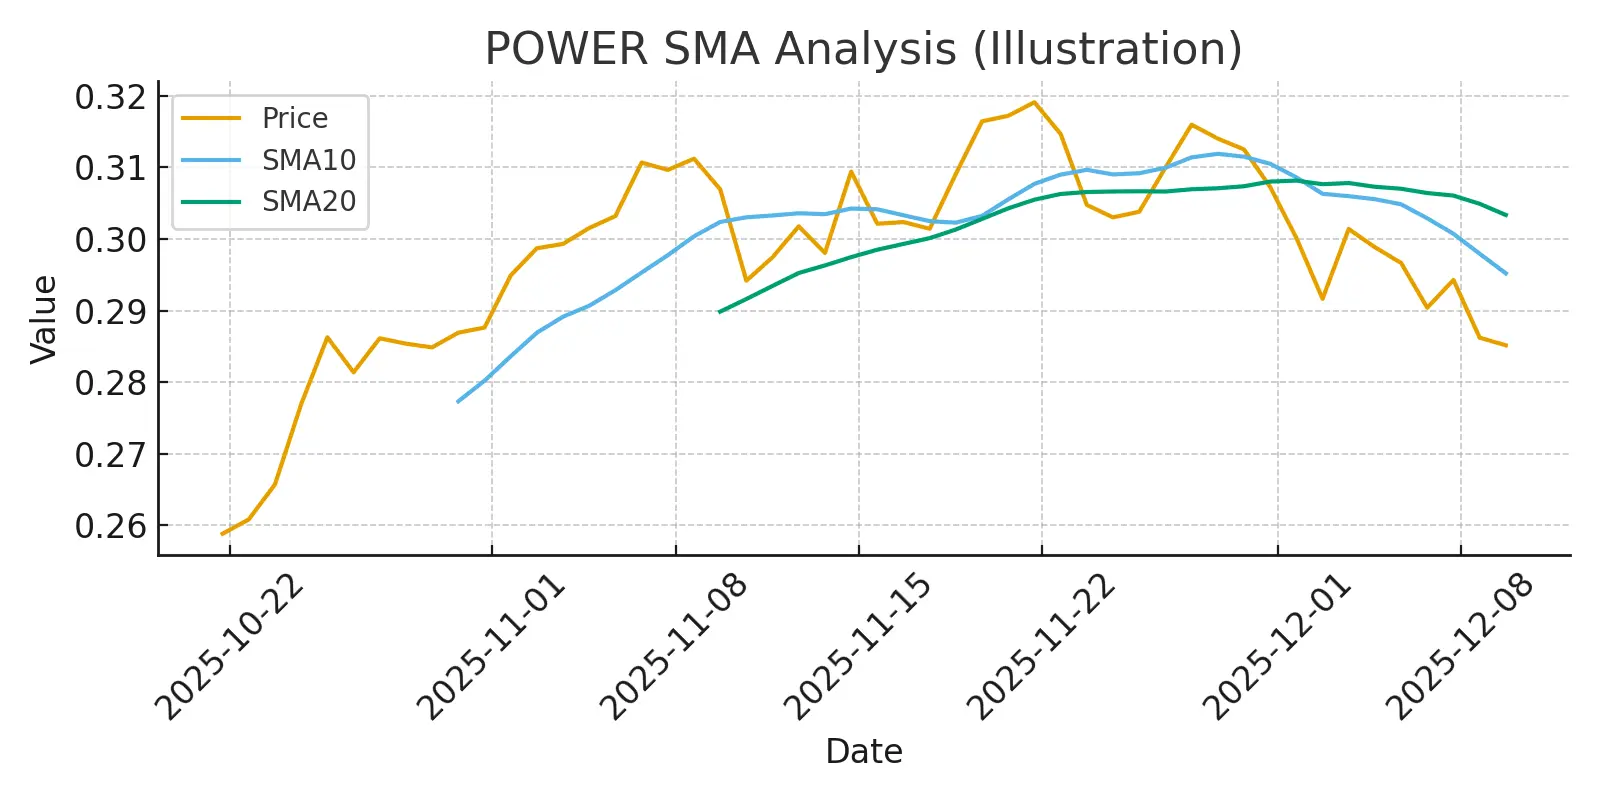
$POWER POWER Market Update & Short-Term Outlook (Personal View Only)
Not financial advice.
POWER has been pulling back after yesterday’s volatility, currently hovering around $0.24–$0.25. Volume is still healthy, and the chart shows the market cooling down after a strong push earlier.
1H Trend:
Price is sitting near the mid-range of the Bollinger Bands, showing consolidation. Indicators like MACD and RSI are flattening out — usually a sign the market is waiting for its next move.
Short-Term Prediction (1H–4H):
If buyers step in around this zone, a bounce toward $0.27–$0.29 is possible.
If th
- Reward
- like
- 2
- Repost
- Share
Sonkanalp:
HODL Tight 💪View More
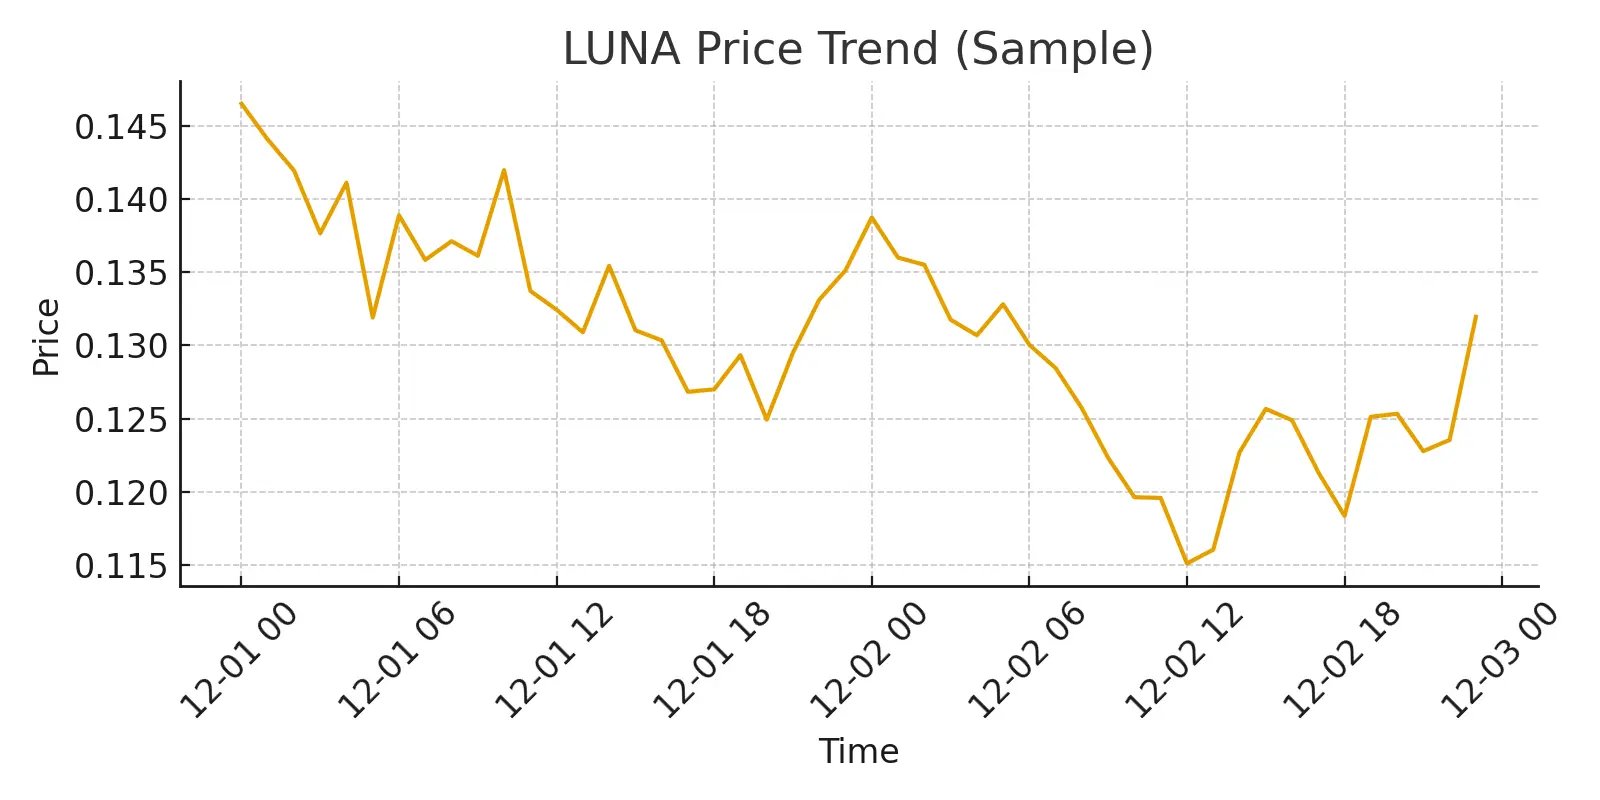
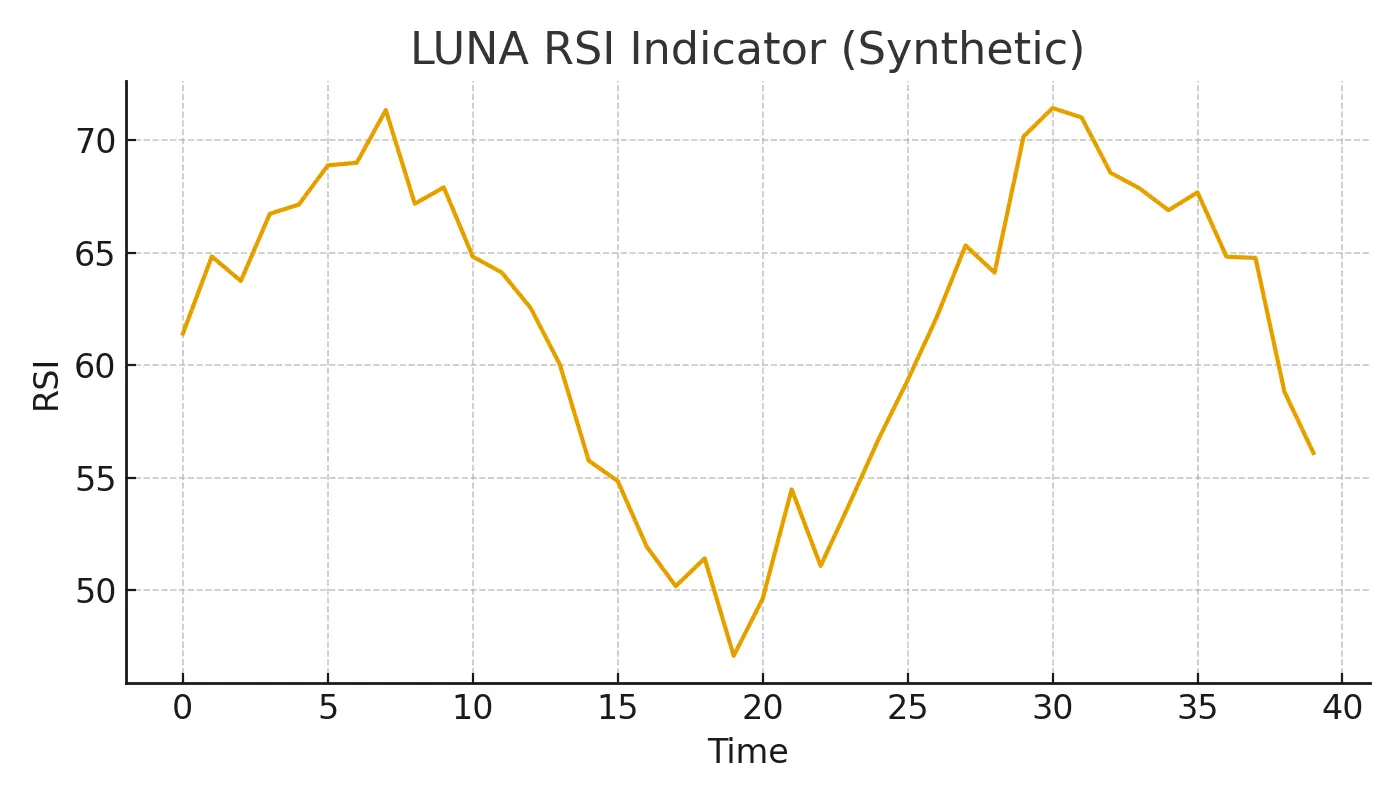
$LUNA LUNA has shown strong momentum lately, with the chart clearly breaking above recent resistance levels. Buyers stepped in aggressively, pushing the price into a short-term uptrend. Moving averages also turned upward, confirming fresh strength in the market.
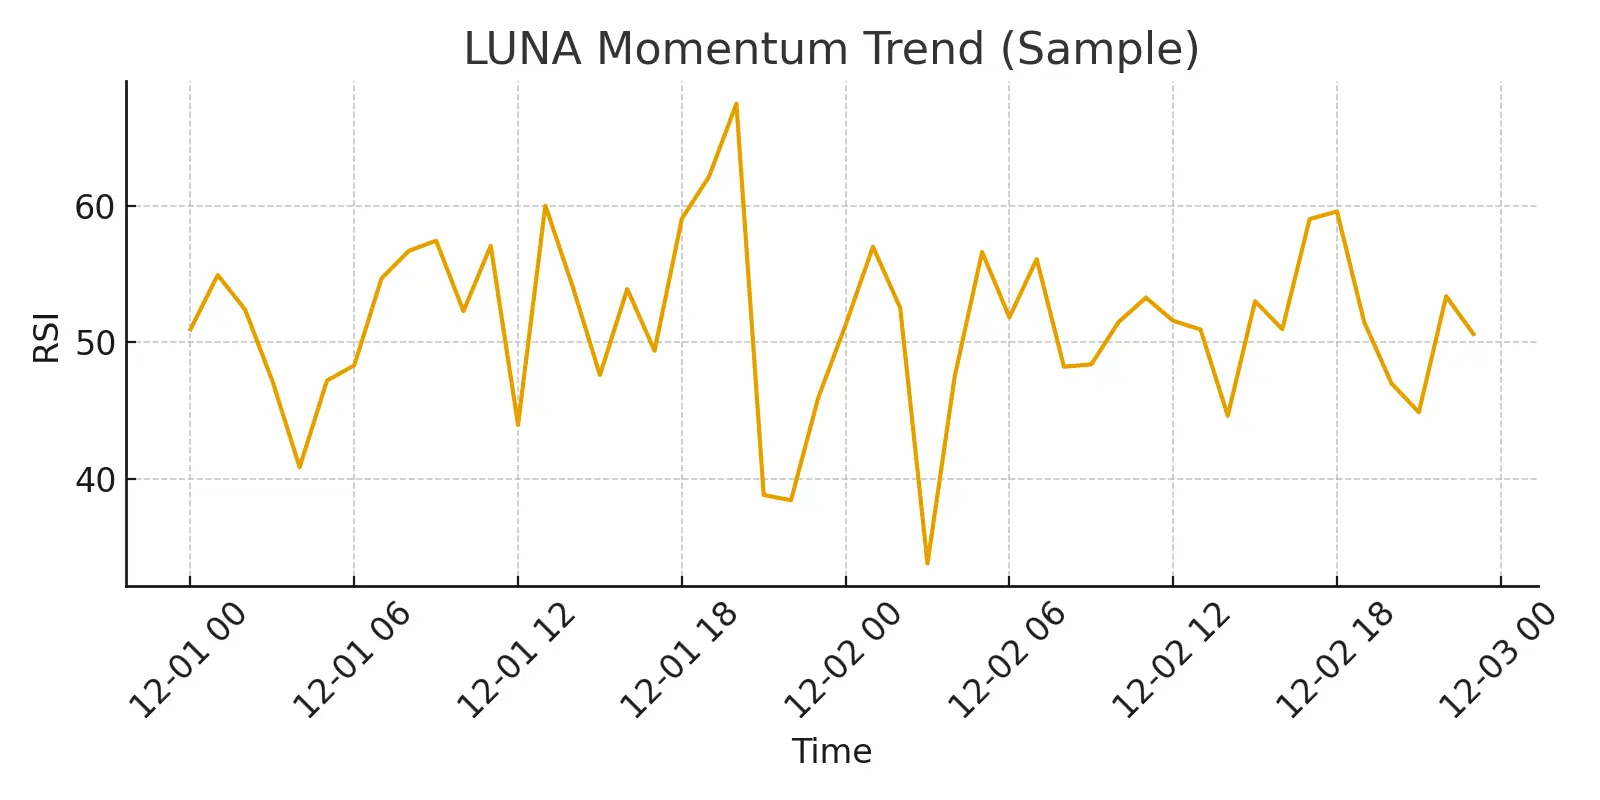
Momentum indicators like RSI and MACD are showing positive movement, suggesting buyers are still active but may take short pauses along the way. The market structure now looks healthier compared to the previous pullback.
🔮 Future Prediction (Quick & Simple)
1️⃣ Trendline Approach
The higher-low pattern points to a continued upward t
LUNA30.57%
- Reward
- like
- 3
- Repost
- Share
GateUser-956b7f78 :
:
Just go for it 💪View More
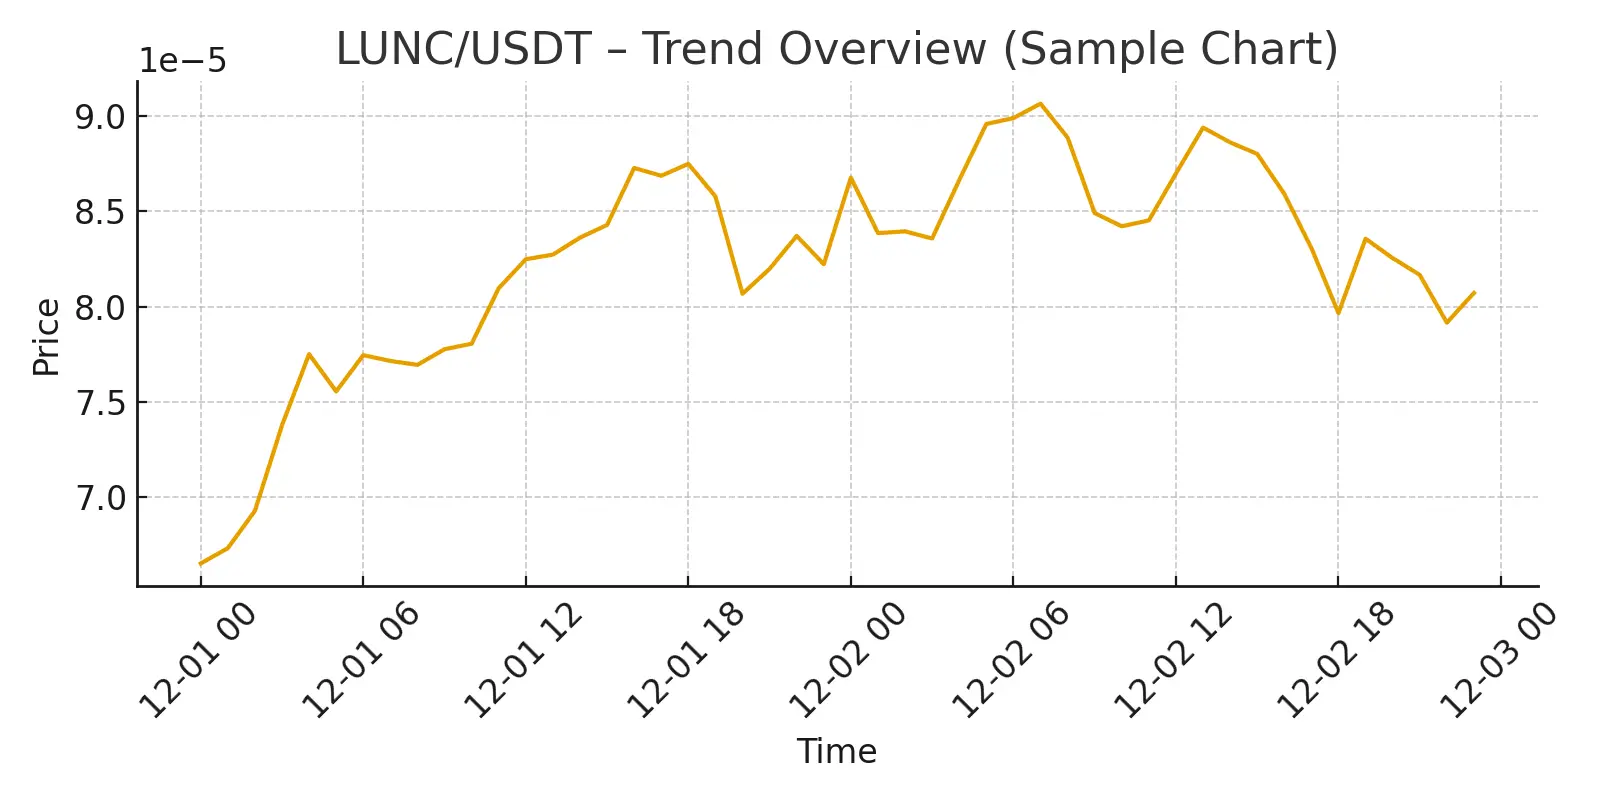
$LUNC LUNC Market Snapshot – Fresh Momentum Showing Up
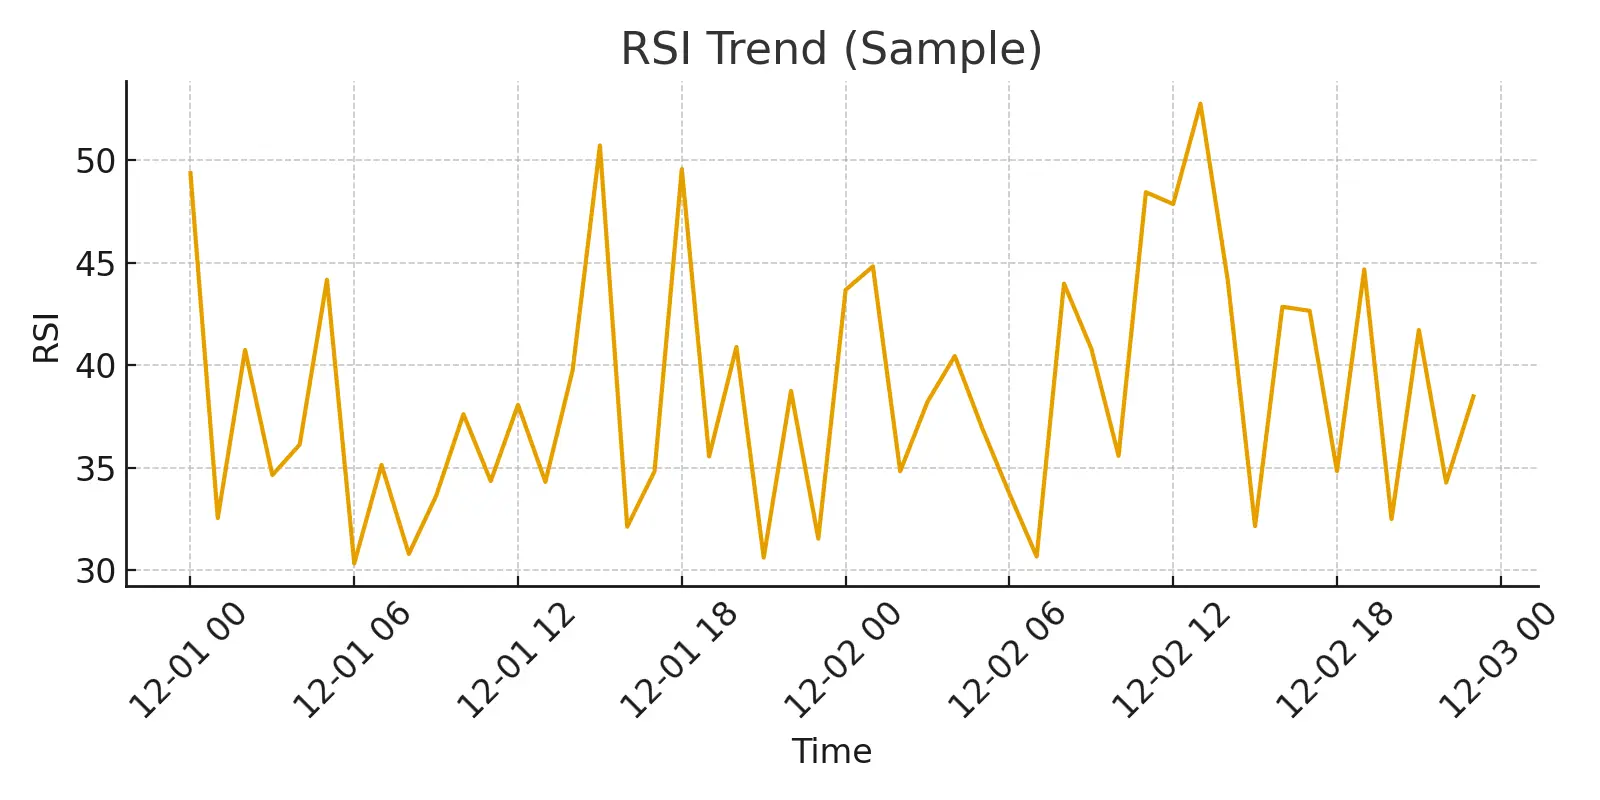
The chart shows that LUNC has been pushing upward with steady strength. After a long consolidation, buyers stepped back in and pushed the price above short-term moving averages. Momentum indicators like RSI are sitting in the higher zone, showing strong interest but also warning that the market might cool down a bit before another move.
On the lower timeframe, the trend looks clean with higher lows forming, which usually signals growing bullish pressure. If the price can hold above recent support levels, the market may continue its upwar
LUNC1.04%
- Reward
- like
- Comment
- Repost
- Share
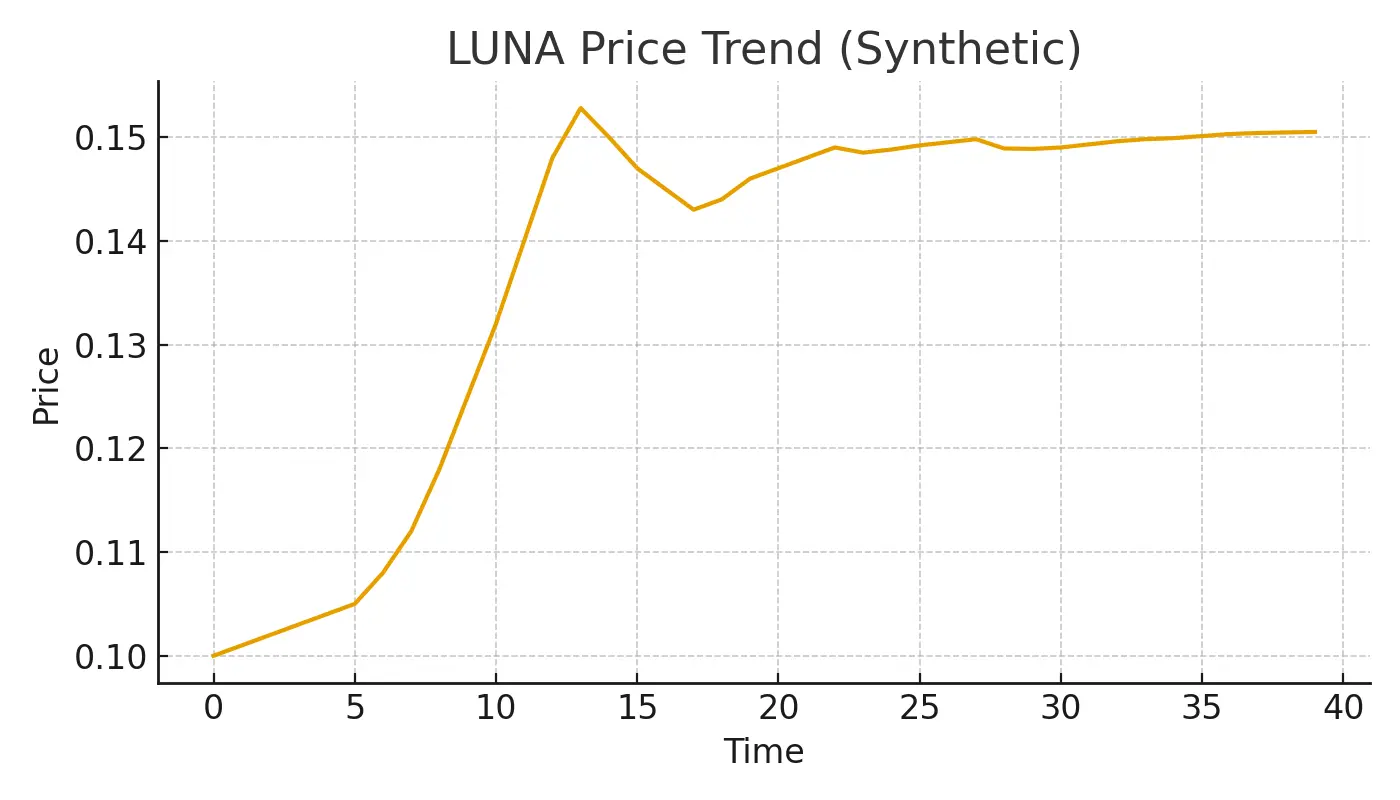
$LUNA 📊 LUNA/USDT — Quick Market Check & Short Future Outlook
LUNA just made a strong move from the 0.098 zone and pushed all the way up toward 0.1528 before cooling slightly. Price is still holding above the EMA lines, which shows buyers are active even after the pullback.
🔍 What the chart is showing
Momentum indicators like RSI and KDJ are still in a strong zone.
MACD is positive, which usually supports continuation moves.
Bollinger Bands are widening — a sign of increased volatility and trend strength.
🔮 Future Prediction (Personal Opinion Only)
If LUNA stays above the short-term EMAs,
LUNA30.57%
- Reward
- 1
- Comment
- Repost
- Share
$STABLE 📊 STABLE/USDT — Quick Market Look & Simple Future Outlook
The chart just showed a clean bounce from the 0.01525 support zone, and price is now climbing back toward the short-term moving averages. Momentum indicators are turning positive, showing early signs of recovery after the heavy dip.
🔍 What I’m Seeing
RSI is lifting from oversold, suggesting buyers are slowly returning.
MACD histogram flipping positive, showing momentum shifting upward.
Price holding above the lower band gives a short-term bullish tone.
🔮 Future Prediction (Opinion Only)
If the current momentum continues, pr
STABLE17.43%
- Reward
- 1
- Comment
- Repost
- Share
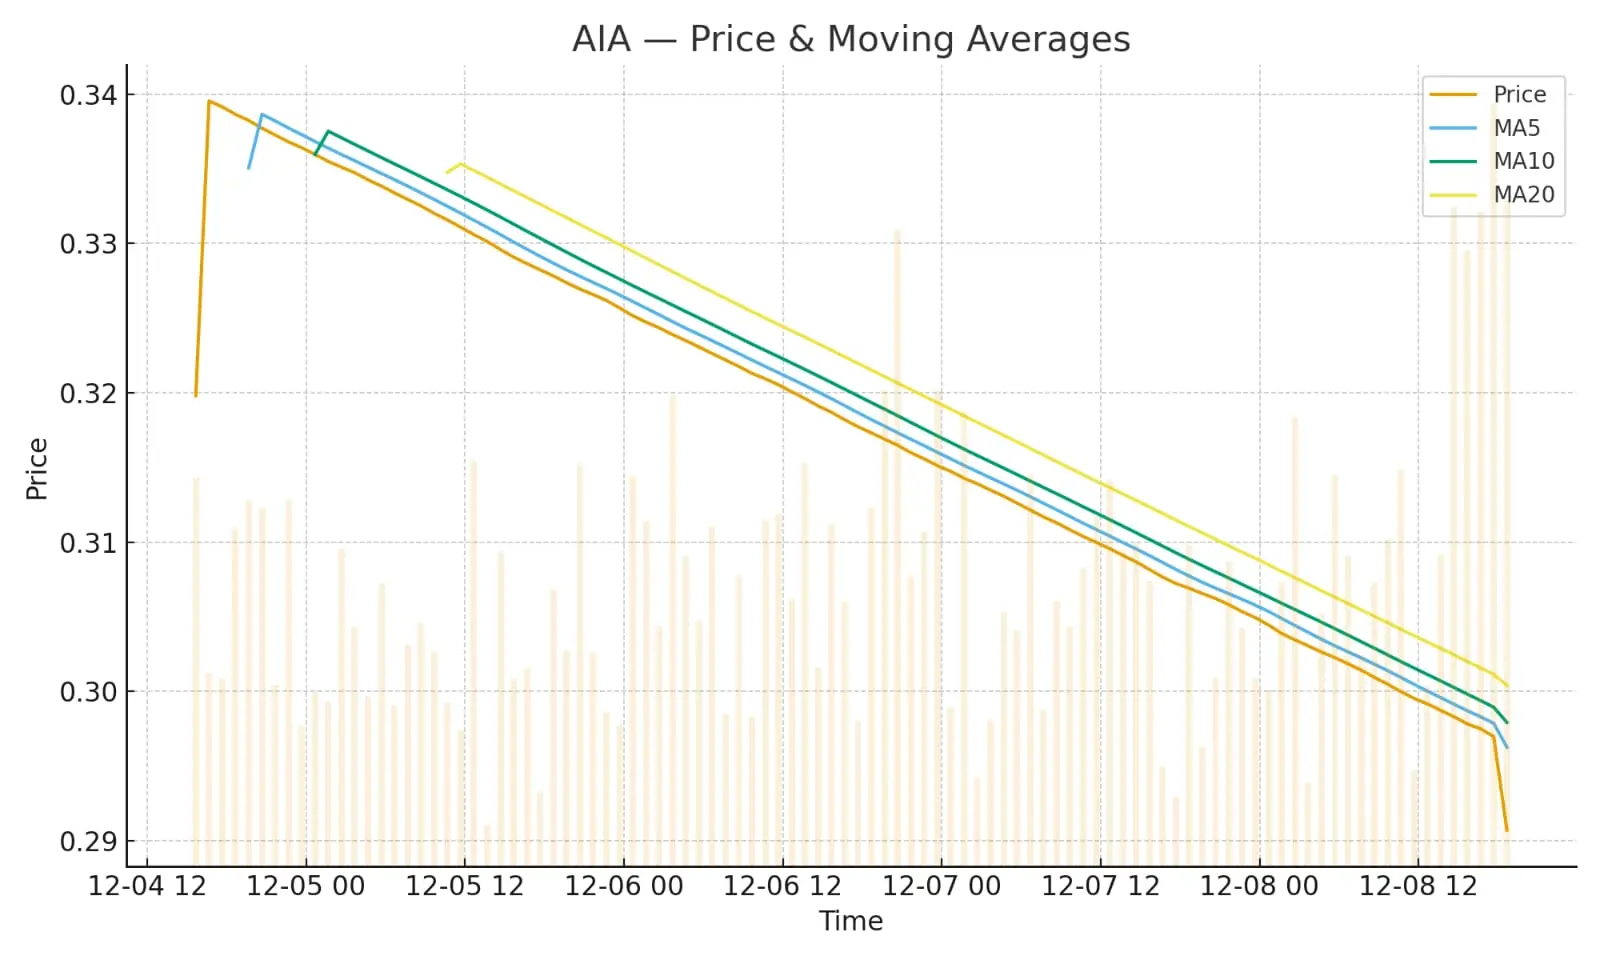
$AIA AIA Market Update (1H)
Price is around 0.296 after a slow and steady drop. The trend has been leaning bearish, but the move looks like it’s losing momentum.
What I’m seeing:
Price staying below MA5 / MA10 / MA20 → downtrend still active.
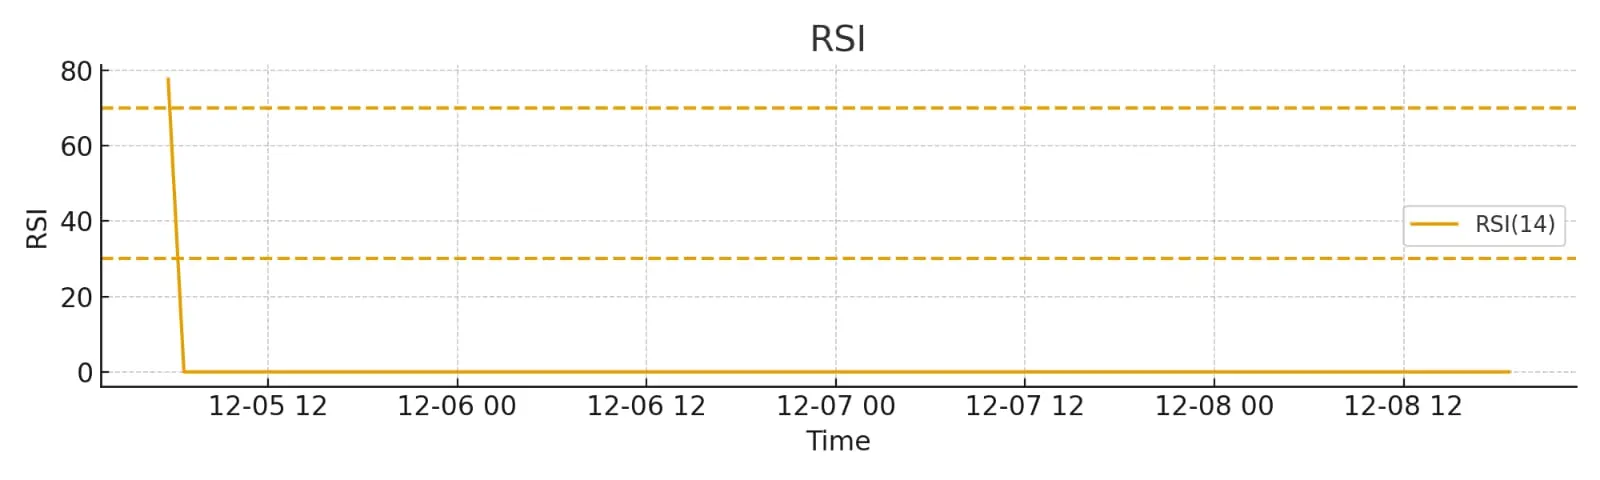
RSI is sitting low → market is close to “oversold” levels.
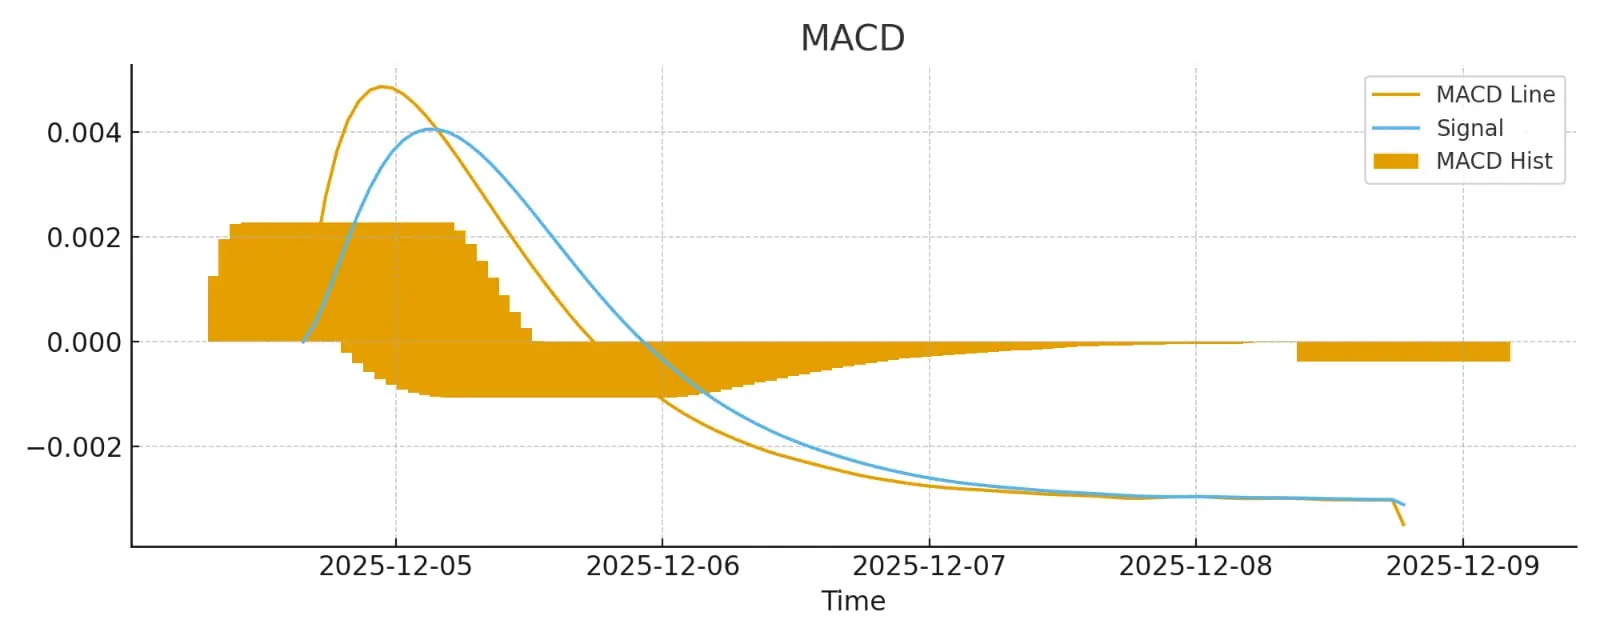
MACD is flattening out → selling pressure may be cooling.
Volume spikes appear mainly on dips → signs of shakeouts.
Short-term idea (hours):
Price may try to hold the 0.29 zone. If buyers step in, we could see a small bounce toward 0.305–0.31.
Mid-term idea (days):
Trend shifts only if price clo
Price is around 0.296 after a slow and steady drop. The trend has been leaning bearish, but the move looks like it’s losing momentum.
What I’m seeing:
Price staying below MA5 / MA10 / MA20 → downtrend still active.
RSI is sitting low → market is close to “oversold” levels.
MACD is flattening out → selling pressure may be cooling.
Volume spikes appear mainly on dips → signs of shakeouts.
Short-term idea (hours):
Price may try to hold the 0.29 zone. If buyers step in, we could see a small bounce toward 0.305–0.31.
Mid-term idea (days):
Trend shifts only if price clo
AIA-2.11%
- Reward
- 2
- 1
- Repost
- Share
GatCrybto:
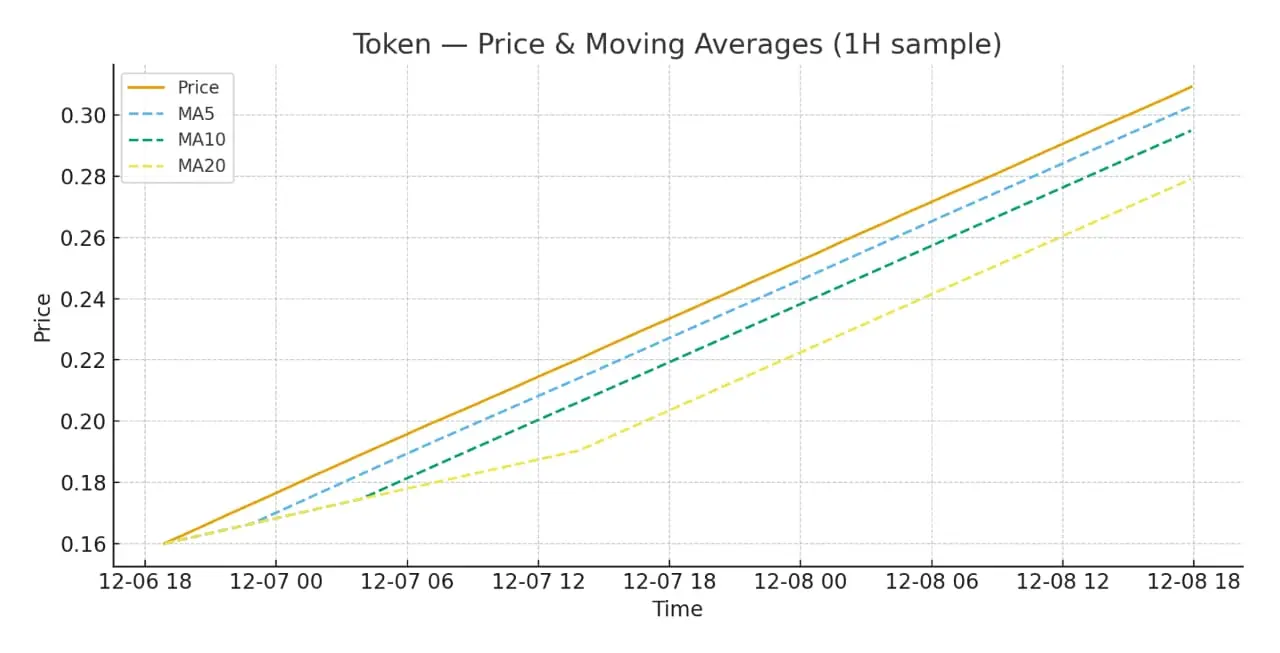
Bullish market at its peak 🐂$POWER Price jumped from recent lows and is riding strong momentum — hit local high ~0.31 after bouncing from ~0.16. Short-term picture (1H): moving averages are stacked bullish (MA5 > MA10 > MA20) and volume is rising — momentum looks strong, but RSI-like readings suggest the market is overbought, so a quick pullback to ~0.24–0.26 is possible before continuation.
Targets if bullish hold: 0.34–0.36. Support to watch: 0.24, then 0.19.
This is my view, not financial advice.
Targets if bullish hold: 0.34–0.36. Support to watch: 0.24, then 0.19.
This is my view, not financial advice.

- Reward
- 3
- Comment
- Repost
- Share
$SOL Market Update & Personal Opinion
The chart shows a strong recovery after yesterday’s dip, with price pushing back above the recent support zone. Buyers stepped in aggressively around the 127 area, and momentum indicators like RSI and MACD are turning upward, suggesting improving strength.
On the short-term (1H), momentum looks bullish as long as price stays above recent pullback levels.
On the mid-term (4H), the trend is trying to shift from consolidation into a slow uptrend.
On the simple long-term view, holding above higher lows keeps the structure healthy.
Personal future outlook (no
SOL3.07%
- Reward
- 3
- Comment
- Repost
- Share
$MOODENG MOODENG/USDT — Market Update & Short-Term Outlook
MOODENG is cooling down after yesterday’s huge wick. Price is currently moving around 0.094–0.095, and the chart is showing signs of stabilization after the volatility spike.
Current Market View
The price is holding above the recent bottom and slowly compressing inside a tight range.
RSI is sitting around the mid-zone, meaning the market is neither overbought nor oversold.
MACD remains flat, showing low momentum, but the histogram is slowly shrinking — a sign that buyers might be preparing to step in.
Trend Check (Multi-Timeframe Loo
MOODENG-5.35%


- Reward
- 2
- Comment
- Repost
- Share
$POWER POWER Market Update
POWER had a big spike recently, then cooled off and moved into a more stable range. Price is now trying to hold above the short moving averages, which is a good sign that sellers are slowing down.
On the short timeframe, momentum looks slightly better. If the price keeps closing above the fast MA/EMA levels, it may try another push toward the recent resistance zone. But if it slips back under the moving averages, we could see another dip toward support.
MACD is flattening out — not fully bullish yet, but it’s showing early signs of a possible reversal if buyers sta


- Reward
- like
- 1
- Repost
- Share
WhaleProtocolOfficial:
Go full throttle 🚀$ASTER Quick market note on this token:
Price pulled back from recent highs and found a low, then started a modest recovery. Short-term momentum is improving — if price holds above the short moving averages and the middle Bollinger band, we’re likely to test local resistance. MACD on the hourly shows an early bullish cross, but I’d want to see confirmation on higher timeframes before calling a trend change.
Short view: watch the MA cluster and the Bollinger midline — hold = higher, fail = revisit support.
Medium view: wait for higher-timeframe confirmation and rising volume.
(Not financial a
ASTER1.16%


- Reward
- 1
- Comment
- Repost
- Share
$FHE FHE Market Update (1H View)
FHE just came off a huge breakout after a long flat range. The move pushed price from the low zone straight into a sharp rally, followed by a quick pullback as traders took profit. Even after the drop, the chart still shows strong volatility and interest.
On the short-term timeframe, the candles are pulling back toward the moving averages. If the price stabilizes above the mid-range, FHE could attempt another push. If it drops under the recent support zone, it may spend more time cooling down.
Looking at higher timeframes, the structure is still early-stage a
FHE15.21%


- Reward
- like
- Comment
- Repost
- Share
$ETH Market View: ETH (1H Analysis)
ETH is holding strength after recovering from recent dips, trading around the 3.1k zone and slowly building momentum again. The short-term trend is slightly bullish — fast MAs are curling upward, price is riding above short EMAs, and volatility is moderate. RSI levels are in a healthy mid-range, showing room for continuation if buyers stay active.
Short-term outlook (1H):
If momentum continues, price may attempt a move toward the recent reaction zone around 3.16–3.20k. Losing support near 3.02–3.05k would weaken this setup and shift the tone back to range-
ETH5.98%


- Reward
- like
- Comment
- Repost
- Share
$SOL SOL is finding its feet after a cool-down — current price ~134.8. Short-term momentum looks mildly bullish: fast MAs have crossed back toward price and RSI sits in neutral-to-slightly-strong territory (not overheated).
Short-term (1h): expect a retest of ~137–139 if momentum holds; a failure below ~128 would shift momentum back to the downside.
Swing (daily): consolidation between ~125–150 — break of either side sets the next leg.
Playbook: for quick trades wait for clean retest of moving averages + rising volume; for swings keep stops below the recent support and trim into strength. No
SOL3.07%


- Reward
- like
- Comment
- Repost
- Share
$COMMON Price popped hard — quick note: saw a big spike to ~0.011 before a fast pullback to ~0.0059.
Short take: this looks like an exhaustion spike — short-term consolidation likely between 0.0045–0.0070 as traders digest the move.
If momentum returns and volume stays high, a re-test of the spike area (~0.009–0.012) is possible in the next 1–3 weeks. If not, price may drift back toward the prior range.
Models I ran: SMA/EMA behavior, a short linear trend, exponential smoothing, and a simple momentum continuation — they give different short-term scenarios, so watch volume and VWAP-like suppo
COMMON-7.27%


- Reward
- 1
- Comment
- Repost
- Share
📊 BTC Market Update & Simple Future Outlook
BTC just showed a clean push upward after a long consolidation phase. Buyers stepped back in around the lower range, and momentum indicators like MACD, RSI, and KDJ are finally aligning in the same direction — showing early strength, not overhype.
Short-Term View (1H–4H):
The chart structure suggests a steady recovery. If BTC holds above the local support area, momentum can continue gradually. No major breakout signs yet — but the shift in trend looks healthier than the previous dip.
Mid-Term View (1D):
Volatility is still active, but the overall cu
BTC1.65%


- Reward
- like
- Comment
- Repost
- Share
📌 $MOODENG Market Analysis & Short-Term Outlook
The token just had a massive spike, shooting up sharply before cooling down into a tighter range. After the big wick, the price is stabilizing above the earlier support zone, which is a good sign that buyers are still active.
🔍 Current Trend
Price is holding around a new short-term base.
MACD is recovering from the downside momentum, showing early signs of a possible reversal.
RSI is in a neutral-to-bullish zone, meaning the market still has room to move.
📈 Future Prediction (Simple View)
If the token can hold above its current support and
MOODENG-5.35%
- Reward
- 3
- 2
- Repost
- Share
BeautifulDay:
Watching Closely 🔍View More
$ASTER Market Update – ASTER
The token has been moving inside a clear downtrend on the 1H chart, but the latest candles show some early signs of recovery. Buyers stepped in near the 0.88–0.90 area, which is holding as a short-term support.
RSI is climbing from the oversold zone, and MACD is gradually turning upward. This usually signals that momentum is trying to shift. If the price can stay above 0.95 and break the 0.98–1.00 zone, we may see a slow trend reversal on shorter timeframes.
From a broader view, the trend is still weak, so any recovery needs confirmation.
I refined the outlook us
ASTER1.16%
- Reward
- like
- 1
- Repost
- Share
User_MVS:
Looks like we've found the bottom, what do you think?