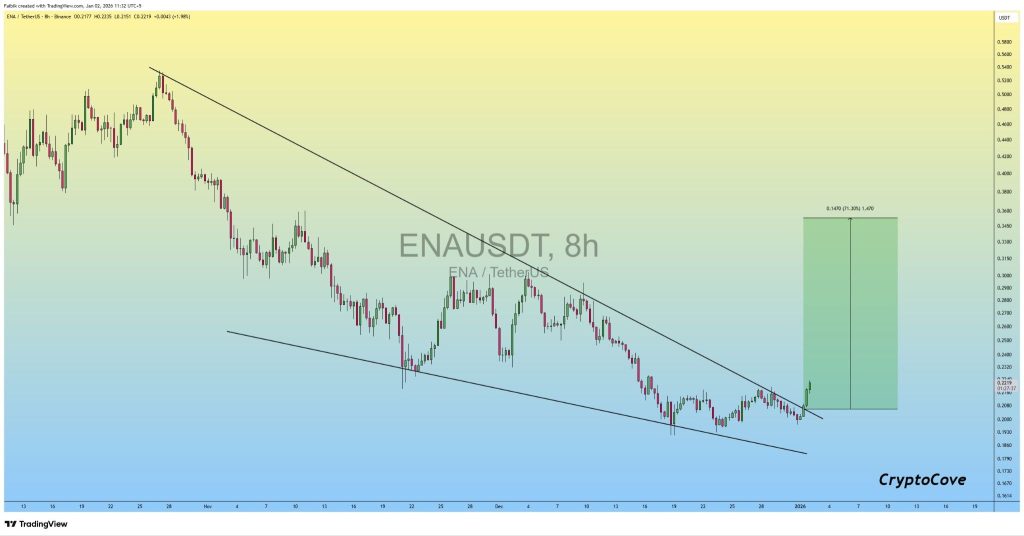
 ENA is finally starting to show some life after weeks of steady downside pressure. On the 8-hour chart, the price has pushed out of a clear falling wedge, a pattern that usually shows up near the end of a correction.
Captain Faibik pointed out that the breakout is already confirmed, and that alone makes this setup worth paying attention to.
What makes this move interesting isn’t just the breakout itself, but the way it formed. The ENA price spent a long time compressing inside a narrowing range, which usually means sellers are losing control rather than gaining it.
ENA is finally starting to show some life after weeks of steady downside pressure. On the 8-hour chart, the price has pushed out of a clear falling wedge, a pattern that usually shows up near the end of a correction.
Captain Faibik pointed out that the breakout is already confirmed, and that alone makes this setup worth paying attention to.
What makes this move interesting isn’t just the breakout itself, but the way it formed. The ENA price spent a long time compressing inside a narrowing range, which usually means sellers are losing control rather than gaining it.
- What the ENA Chart Is Telling Us
- Why This Breakout Matters for ENA
- What to Watch Next for ENA
What the ENA Chart Is Telling Us
Looking at the structure Faibik shared, ENA had been trending lower for a while, printing lower highs and lower lows inside the wedge. That showed consistent selling, but also fading momentum. Each push down became weaker than the last.
Over the past several sessions, that dynamic started to change. The ENA price stopped breaking down and began moving sideways near the lower boundary of the wedge.
Source: X/@CryptoFaibik
Instead of rolling over, ENA held its base and eventually pushed through the upper trendline. That kind of move often signals that buyers are finally absorbing supply.
The breakout itself was clean. The price didn’t slowly grind above resistance, it pushed through and stayed there. That usually marks the shift from a corrective phase into the early stages of recovery.
Read Also: Cardano Price Prediction: ADA Is Flashing a Familiar Setup
Why This Breakout Matters for ENA
Falling wedges tend to resolve higher, especially when they appear after extended declines. In ENA’s case, the pattern developed over several weeks, which gives the breakout more weight.
The measured move on the chart indicates a potential upside of around 70%, with the next major area of interest sitting near the $0.34–$0.36 zone. That doesn’t mean ENA moves straight there, but it helps frame what this structure could open up if momentum continues to build.
Just as important, the breakout invalidates the immediate bearish setup. As long as the price stays above the former wedge resistance, the market is no longer operating in a sell-first environment.
What to Watch Next for ENA
From here, the most important thing is whether ENA can hold above the breakout zone. If the price stays above former resistance and possibly retests it successfully, the bullish structure remains intact.
If the ENA price slips back inside the wedge, the setup weakens and indicates the market needs more time. For now though, the chart supports the idea that this falling wedge breakout is real. ENA may still be early in its move, but structurally, this is the clearest shift it has shown in weeks.
Disclaimer: The information on this page may come from third parties and does not represent the views or opinions of Gate. The content displayed on this page is for reference only and does not constitute any financial, investment, or legal advice. Gate does not guarantee the accuracy or completeness of the information and shall not be liable for any losses arising from the use of this information. Virtual asset investments carry high risks and are subject to significant price volatility. You may lose all of your invested principal. Please fully understand the relevant risks and make prudent decisions based on your own financial situation and risk tolerance. For details, please refer to
Disclaimer.
Related Articles
BTC Short-term Rise 1.25%: Whale Buying and Key Level Breakthrough Drive Market Acceleration Upward
During 2026-03-16 03:30-03:45 (UTC), BTC recorded a +1.25% return with a price range of 72,851.9 to 74,300.0 USDT, reaching an amplitude of 1.99%. The K-line candle showed significant volume expansion during this period, with increased market attention and notable short-term volatility. Investors rapidly entered the market, with trading volume exceeding daily average levels, reflecting capital-driven momentum behind the price movement.
The primary drivers of this unusual movement were concentrated whale fund buying and a breakout through key technical levels. On-chain monitoring data showed 4 transactions each exceeding 1,000 BTC during the anomaly period.
GateNews10m ago
ETH rises 0.87% in 15 minutes: Large capital inflows and Layer2 ecosystem positive catalysts drive rally
Between 2026-03-16 03:15 and 03:30 (UTC), ETH spot price rose 0.87% within the range of 2180.04 to 2209.64 USDT, with a volatility amplitude of 1.36%. During this period, trading volume and on-chain transfer activity increased significantly, with elevated market attention and intensified short-term fluctuations. Long and short positions engaged in fierce competition, with net capital inflows notably favoring ETH, driving rapid price appreciation.
The primary driver of this price movement was multiple large-scale ETH transfers on-chain and a surge in stablecoin conversion volumes, with major capital inflows into leading exchanges, boosting both spot and derivatives trading activity.
GateNews25m ago
Santiment: Large Bitcoin Wallets Resume Accumulation, Fear and Greed Index May Diverge from ETF Inflows
According to data from on-chain analytics firm Santiment, as Bitcoin's price stabilizes near $71,000, large address holders now control approximately 68.17% of circulating supply, demonstrating an accumulation trend. Bitcoin reserves on exchanges have also fallen to eight-year lows, indicating that holders are more inclined toward long-term storage rather than selling. Despite the market's fear index remaining elevated, the renewed accumulation by large holders may signal a potential price rebound and provide structural support to the market.
MarketWhisper45m ago
Strait of Hormuz shipping crisis impacts industrial metals, BTC reclaims $71,300
Middle East tensions escalate as U.S. military takes action against Iranian energy facilities. Iran warns of retaliation, Strait of Hormuz transit volume declines, shipping risks rise, and aluminum supply chains tighten. U.S. 2022 GDP revised down to 0.7%, PCE remains at 3.1%, and the job market stays resilient. In the crypto market, BTC returns to the key level of 71,300 dollars.
GateNews1h ago
Spot/Futures Trading Volume Ratio of ETH on a Certain CEX Drops to Lowest Level Since 2023
According to analyst Darkfost's report, ETH open interest on a certain CEX platform has decreased significantly, with open positions declining by approximately 400,000 ETH since January. The spot-to-futures trading volume ratio has fallen to its lowest level since 2023, indicating weakness in the Ethereum spot market, with investor sentiment affected by selling activity.
GateNews1h ago
Bitcoin Approaching $73,000: Strong ETF Capital Inflows, BTC May Challenge $80,000 Level
Bitcoin's recent price rebound is approaching $73,000, driven by institutional capital inflows and geopolitical factors. Mainstream crypto assets such as Ethereum and XRP have also risen in sync. Research indicates that Bitcoin's gains are primarily sourced from ETF capital inflows and increased institutional holdings, with market sentiment recovering. Technical analysis shows $70,000 to $71,000 as support levels, with a breakthrough above $75,000 potentially triggering stronger gains.
GateNews1h ago