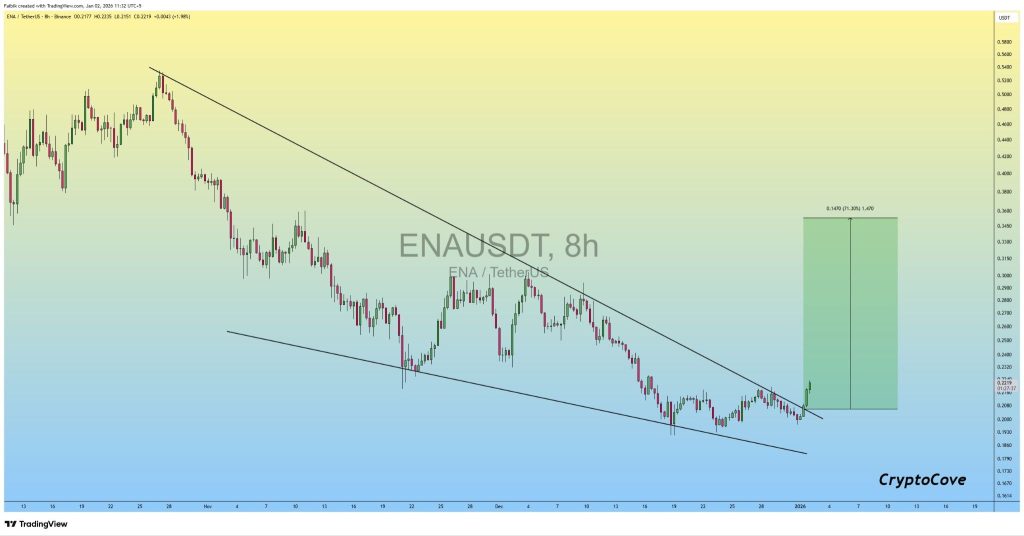
 ENA is finally starting to show some life after weeks of steady downside pressure. On the 8-hour chart, the price has pushed out of a clear falling wedge, a pattern that usually shows up near the end of a correction.
Captain Faibik pointed out that the breakout is already confirmed, and that alone makes this setup worth paying attention to.
What makes this move interesting isn’t just the breakout itself, but the way it formed. The ENA price spent a long time compressing inside a narrowing range, which usually means sellers are losing control rather than gaining it.
ENA is finally starting to show some life after weeks of steady downside pressure. On the 8-hour chart, the price has pushed out of a clear falling wedge, a pattern that usually shows up near the end of a correction.
Captain Faibik pointed out that the breakout is already confirmed, and that alone makes this setup worth paying attention to.
What makes this move interesting isn’t just the breakout itself, but the way it formed. The ENA price spent a long time compressing inside a narrowing range, which usually means sellers are losing control rather than gaining it.
- What the ENA Chart Is Telling Us
- Why This Breakout Matters for ENA
- What to Watch Next for ENA
What the ENA Chart Is Telling Us
Looking at the structure Faibik shared, ENA had been trending lower for a while, printing lower highs and lower lows inside the wedge. That showed consistent selling, but also fading momentum. Each push down became weaker than the last.
Over the past several sessions, that dynamic started to change. The ENA price stopped breaking down and began moving sideways near the lower boundary of the wedge.
Source: X/@CryptoFaibik
Instead of rolling over, ENA held its base and eventually pushed through the upper trendline. That kind of move often signals that buyers are finally absorbing supply.
The breakout itself was clean. The price didn’t slowly grind above resistance, it pushed through and stayed there. That usually marks the shift from a corrective phase into the early stages of recovery.
Read Also: Cardano Price Prediction: ADA Is Flashing a Familiar Setup
Why This Breakout Matters for ENA
Falling wedges tend to resolve higher, especially when they appear after extended declines. In ENA’s case, the pattern developed over several weeks, which gives the breakout more weight.
The measured move on the chart indicates a potential upside of around 70%, with the next major area of interest sitting near the $0.34–$0.36 zone. That doesn’t mean ENA moves straight there, but it helps frame what this structure could open up if momentum continues to build.
Just as important, the breakout invalidates the immediate bearish setup. As long as the price stays above the former wedge resistance, the market is no longer operating in a sell-first environment.
What to Watch Next for ENA
From here, the most important thing is whether ENA can hold above the breakout zone. If the price stays above former resistance and possibly retests it successfully, the bullish structure remains intact.
If the ENA price slips back inside the wedge, the setup weakens and indicates the market needs more time. For now though, the chart supports the idea that this falling wedge breakout is real. ENA may still be early in its move, but structurally, this is the clearest shift it has shown in weeks.
Disclaimer: The information on this page may come from third parties and does not represent the views or opinions of Gate. The content displayed on this page is for reference only and does not constitute any financial, investment, or legal advice. Gate does not guarantee the accuracy or completeness of the information and shall not be liable for any losses arising from the use of this information. Virtual asset investments carry high risks and are subject to significant price volatility. You may lose all of your invested principal. Please fully understand the relevant risks and make prudent decisions based on your own financial situation and risk tolerance. For details, please refer to
Disclaimer.
Related Articles
Supported by ETF fund inflows, Bitcoin shows "strong" rebound near $72,800
Under the influence of capital inflows into U.S. spot cryptocurrency ETFs, Bitcoin prices stabilized last week and touched a high of 73,927 USD, with gains of approximately 6% to 7%. Ethereum also rebounded, indicating a recovery in market risk appetite. ETF capital inflows became the main support factor. Despite volatility in macroeconomic market sentiment, reassuring commentary on inflation and oil price risks helped stabilize prices.
区块客3m ago
Bitcoin Breaks Through $74,000 Resistance Level, Crypto Market Strengthens Collectively, ETH and SOL Lead Weekly Gains
On March 16, the crypto market continued to rise, with Bitcoin surpassing $74,000, up 2.9% in 24 hours. Ethereum and Solana showed larger gains, indicating capital flowing toward higher-risk crypto assets. An improving macroeconomic environment provided market support, with falling oil prices and a weakening dollar aiding liquidity release. The market is focused on the upcoming Federal Reserve meeting, which could impact future interest rate expectations.
GateNews12m ago
Bitcoin Breaks Above 50-Day Moving Average Approaching $74,000, BTC Upward Momentum Strengthens But $75,000 May Become Key Resistance Level
Bitcoin's price surged over 3% on March 16, reclaiming the 50-day moving average and breaking through $71,125, indicating strengthened market momentum. Despite external uncertainties, Bitcoin demonstrated resilience and gradually recovered above the $70,000 level. Analysts noted that stabilization above the 50-day moving average may signal a trend reversal, but technical breakthroughs don't necessarily guarantee long-term gains. The market is watching whether Bitcoin can break through $75,000, with trading volume and capital inflows being key factors.
GateNews16m ago
Bitcoin Breaks Through $73,000! Outperforms Gold Amid US-Iran War, EF Sells 10.2 Million ETH
Bitcoin recently broke through $73,000 with strong performance, decoupling from tech stocks and gold. Analysts predict that if the market stabilizes, it could rise to $75,000 to $80,000. However, geopolitical risks and extremely fearful market sentiment continue to pressure prices. Meanwhile, the Ethereum Foundation sold Ether for approximately $10.2 million to maintain operations.
CryptoCity58m ago
On-chain activity is exploding, but Ethereum can't seem to gain momentum? Experts reveal the "fatal weakness": could drop to $1,500
CryptoQuant's latest report indicates that Ethereum is facing an "adoption paradox," where network activity reaches new highs, but the token price continues to decline. Analysts predict that if the bear market persists, Ether could fall to $1,500. Despite thriving on-chain activity, it has decoupled from the token price, and the high proportion of Ether flowing into exchanges suggests heavy selling pressure and weak investment demand.
区块客1h ago
Bitcoin Breaks Through $74,000! 24-Hour Surge of 3.68%, ETFs Continue to Attract Capital, Multiple Factors Provide Support
Bitcoin broke through $74,000 on March 16th, with a gain of 3.68%, primarily driven by ETF capital inflows, halving supply effects, and geopolitical safe-haven demand. While market sentiment remains optimistic, short-term volatility is intensifying, and investors should carefully manage risk and monitor future support levels and selling pressure.
動區BlockTempo1h ago