Revealed through 5 years of empirical data: 90% of short-term trading underperforms simply holding coins. Only a 4-hour cycle combined with moderate leverage can generate excess returns. ETH 4-hour cycle x3.0 leverage yields a 552% return, far surpassing the 53% from just holding coins. This article is based on an original piece by Michel Athayde, organized, translated, and written by PANews.
(Background: Female stock goddess predicts the US: Trump will buy 1 million BTC as Bitcoin’s national reserve)
(Additional context: Bitwise CIO: Can Bitcoin迎來長線牛市 in 2026? The key is to overcome three major tests)
Table of Contents
-
Warning: This is a wake-up call “Report”
-
Benchmark Data: The “Passing Line” You Must Beat
-
MACD Strategy Data Summary
-
- Painful Lesson: 90% of short-term trading is in “negative optimization”
-
- BTC 1-hour cycle “busywork”
-
- Complete failure of short-term trading (15m / 30m)
-
- The Only Counterattack: “Excess Returns” in 4-hour cycle
-
- BTC 4h: A narrow escape victory
-
- ETH 4h: Absolute domination
-
- The True Meaning of Leverage: Amplify “Win Rate” or “Gambling Nature”?
-
- x2.0 – x3.0: The secret of the golden zone
-
- x5.0: The “inversion” of returns
-
- Your “Death Matrix” Report (The Death Matrix)
-
- Final Decision Guide: What Should You Do?
-
Core Conclusions
Warning: This is a wake-up call “Report”
Have you ever had this illusion:
- “4 hours is too slow, I want to do 5-minute short-term trading, 1% daily compounding, and become the richest person in the world in a year.”
- “Spot trading is too slow, I leverage 3x, 5x, as long as the direction is correct, I can earn several times more than others.”
To verify these “get-rich-quick fantasies,” we not only backtested the 4-hour cycle but also pulled out all the 15m (15m), 30m (30m), 1h (1H) data for “zombie slaughter”;
We examined not only spot but also simulated the real outcomes of extreme market conditions with 200% (2x), 300% (3x), 500% (5x) leverage.
The conclusion is brutally harsh: Without leverage, after 5 years of reckless trading, 90% of people cannot even beat “dumb holding”.
Benchmark Data: The “Passing Line” You Must Beat
Before evaluating any strategy, we must first see how much “lying flat” can earn. Based on the past 5 years of spot data:
- BTC pure spot: +48.86%
- ETH pure spot: +53.00% (Note: This means if you bought and unloaded the app 5 years ago, you now have about 50% profit. This is the “pass line” that strategies must beat.)
MACD Strategy Data Summary
I backtested the past 5 years, analyzing MACD performance across different cycles and leverage levels for BTC/ETH:
| Chart Label ( |
Meaning ) |
| Strategy Backtest |
Strategy Backtest Analysis |
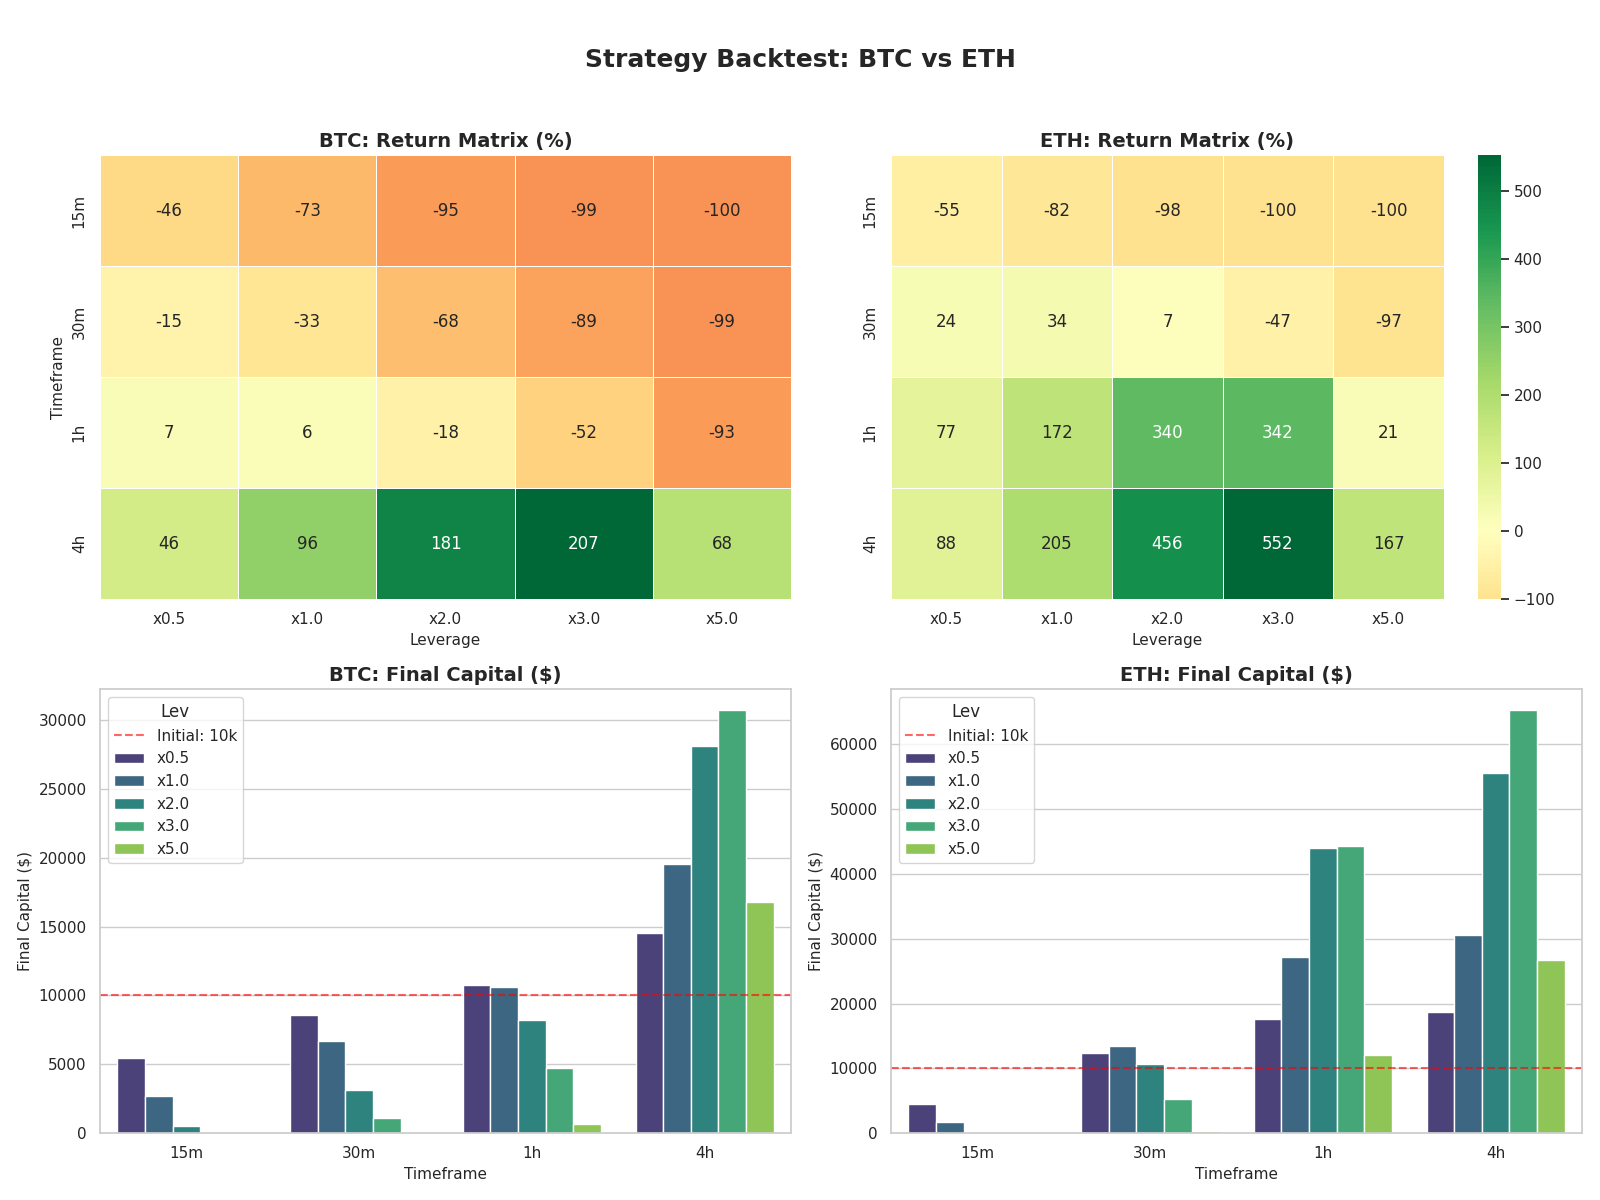
| Return Matrix (%) |
Profitability Heatmap (The redder, the more loss; greener, the more profit) |
| Final Capital ($) |
Final Capital (Initial principal 10,000 U) |
| Timeframe (TF) |
Time Cycle (15m, 30m, 1h, 4h) |
| Leverage (Lev) |
Leverage Multiple (x0.5, x1.0, x2.0, x3.0, x5.0) |
| Initial: 10k |
Initial Principal (Red dashed baseline) |
-
Top-left & Top-right (Heatmap – Returns ):
- Danger Zone (Red/Dark Orange): Concentrated on short cycles like 15m and 30m. Especially with high leverage (x3.0, x5.0), capital nearly wiped out (-99%, -100%).
- Golden Zone (Deep Green): Focused on 4h cycle. ETH performs especially well in 4h, almost all blocks are green.
-
Bottom-left & Bottom-right (Bar Charts – Final Capital ):
- Red dashed line (10k): The breakeven line. Bars below the line indicate loss, above indicate profit.
- BTC vs ETH: Pay attention to the ETH 4h bars at bottom right. When using x2.0 or x3.0 leverage, capital bars are extremely tall, far exceeding BTC’s performance, confirming ETH’s higher volatility in trending markets yields greater excess returns.
( 1. Painful Lesson: 90% of Short-term Trading Is in “Negative Optimization”
Data reveals a cruel fact: in medium-small cycles (15m, 30m, 1h), MACD strategies not only fail to generate alpha but also, due to overtrading and wear, significantly underperform “dumb holding.”
)# 1. BTC 1-hour Cycle “Busywork”
-
Strategy performance: BTC 1h x1.0 yields +6%.
-
Benchmark performance: BTC spot holding yields +48.86%.
-
Deep interpretation: At 1-hour level, you tirelessly monitor for 5 years, trading MACD crossovers thousands of times, paying huge fees, ending up with only 6%. Doing nothing, you could have earned 49%.
Conclusion: Running MACD strategy on 1H cycle essentially destroys value. Your frantic operations turn gains positive into negative (opportunity cost).
(# 2. Complete Failure of Short-term Trading (15m / 30m)
) 2. The Only Counterattack: “Excess Returns” in 4-hour Cycle
Only when the cycle extends to 4 hours does MACD show the ability to beat “holding”. This is the only meaningful purpose of quantitative trading.
(# 1. BTC 4h: Narrow Escape Victory
- MACD x1.0 )Spot(: Returns about +96%.
- Holding benchmark: +48.86%.
- Winning logic: MACD in 4H successfully helped BTC avoid deep bear market declines (e.g., 2022 crash). Although it missed some gains in bull markets, the risk-avoidance advantage allowed it to ultimately outperform buy-and-hold.
)# 2. ETH 4h: Absolute Domination
- MACD x1.0 (Spot): Returns about +205%.
- Holding benchmark: +53.00%.
- MACD x3.0 (Optimal leverage): Returns +552%.
- Winning logic: ETH has strong trending characteristics. While buy-and-hold enjoyed gains, it also endured -80% drawdowns. MACD in bear markets preserved profits by avoiding full exposure, then compounded in next bull cycle. Returns 4 times higher than holding (205% vs 53%) prove timing’s huge value in ETH.
3. The True Meaning of Leverage: Amplify “Win Rate” or “Gambling”?
Combining benchmark data, we redefine leverage’s role.
1. x2.0 – x3.0: The Secret of the Golden Zone
- BTC 4h x3.0 ###+207%### vs BTC hold ###+48.86%(: With 3x leverage, returns are amplified 4 times. This is a healthy leverage ratio, indicating the strategy captures genuine trends, leverage acts as a “tailwind”.
- ETH 4h x3.0 )+552%### vs ETH hold (+53.00%): Returns amplified 10 times! This is the peak of quant trading—on highly volatile assets, with reasonable leverage and correct cycles, achieving leapfrog gains.
(# 2. x5.0: The “Inversion” of Returns
- ETH 4h x5.0 )+167%###: Note! Although it beats holding (+53%), it far underperforms the lower leverage strategy (+552%).
- Warning: Doubling leverage to 5x is essentially working for exchanges (high fees) and paying the market (high volatility costs). You risk liquidation to zero, but only get mediocre returns.
4. Your “Death Matrix” Report (The Death Matrix)
To dishearten you, we list the final outcomes under different configurations.
| Asset |
Cycle |
Leverage |
Status |
Final Return |
Evaluation |
| BTC |
15m |
x5.0 |
💥 Liquidation |
-100% |
Certain death. Pure gambling, fees can wipe you out. |
| BTC |
15m |
x1.0 |
|
-73% |
Chronic suicide. Better to save in bank. |
| BTC |
1h |
x1.0 |
|
+6% |
Busywork. Underperforms holding (+49%), wastes 5 years. |
| BTC |
4h |
x1.0 |
✅ |
+96% |
Excellent. Outperforms holding, steady mindset. |
| BTC |
4h |
x3.0 |
✅ |
+207% |
Outstanding. Max gains, manageable risk. |
| — |
— |
— |
— |
— |
— |
| ETH |
15m |
x5.0 |
💥 |
-100% |
Certain death. Victim of noise trading. |
| ETH |
1h |
x1.0 |
✅ |
+172% |
Still okay. ETH volatile, short-term can earn a bit, but cumulative loss. |
| ETH |
4h |
x1.0 |
✅ |
+205% |
Excellent. 4x the holding return, no late nights needed. |
| ETH |
4h |
x3.0 |
✅ |
+552% |
King. The holy grail zone of quant trading. |
| ETH |
4h |
x5.0 |
✅ |
+167% |
Lame. Risk skyrockets, returns decline (fees + wear). |
( 5. Final Decision Guide: What Should You Do?
Based on the “holding +50%” benchmark, we give final strategic advice:
-
If you don’t want to fuss / have no time / poor psychology:
- Strategy: Pure holding )Buy & Hold( or MACD 4h x1.0 )spot(.
- Expected: ~50% – 100% returns.
- Cost: Must tolerate drawdowns, but vastly better than losing money through reckless trading.
-
If you want to beat the market )BTC###:
- Strategy: MACD 4h (x1.5 – x2.0).
- Expected: ~150% – 200% returns.
- Key: Strict stop-loss, only trade 4H cycles, never look at 15m.
-
If you pursue excess returns ###ETH(:
- Strategy: MACD 4h )x2.0 – x3.0###.
- Expected: ~400% – 550% returns.
- Key: This is the best sweet spot. Use ETH’s high volatility + moderate leverage. Never exceed 3x.
-
If you are a gambler / short-term trader:
- Strategy: MACD 15m/1h + x5.0 or higher.
- Expected: -100% (to zero).
- Warning: Data proves this cannot beat holding, may as well donate your money.
( Core Conclusions
“Since spot holding for 5 years yields only about 50% return, this actually proves the value of excellent quantitative strategies.”
But this value is only valid at the 4-hour level.
At cycles below 1 hour, all your efforts are counterproductive; better to lie flat.
Only at the 4H + 3x golden crossover point can you truly laugh at those “dead holding” people.
)Data based on historical backtesting, not indicative of future results. Market risks exist, leverage should be used cautiously.(
Disclaimer: The information on this page may come from third parties and does not represent the views or opinions of Gate. The content displayed on this page is for reference only and does not constitute any financial, investment, or legal advice. Gate does not guarantee the accuracy or completeness of the information and shall not be liable for any losses arising from the use of this information. Virtual asset investments carry high risks and are subject to significant price volatility. You may lose all of your invested principal. Please fully understand the relevant risks and make prudent decisions based on your own financial situation and risk tolerance. For details, please refer to
Disclaimer.