Has Sui (SUI) Hit Its Potential Bottom? This Emerging Bullish Fractal Suggests So!

Key Takeaways
-
SUI has dropped nearly 67% from its recent peak, placing it in a potential bottoming zone.
-
Current price action closely mirrors Solana’s 2025 bottoming fractal, which preceded a strong reversal.
-
A reclaim of the 50-day moving average could confirm a trend shift and open the door for a broader recovery.
SUI, the native token of Sui’s Layer-1 blockchain, has struggled to live up to its early hype in recent months, especially when compared to** Solana’s (SOL)** 2021 explosive performance. A broader market correction has only added pressure, dragging SUI nearly 50% lower over the past 90 days.
But zooming out and looking beneath the surface, the current price structure tells a more interesting story. On the charts, SUI is starting to resemble a bottoming fractal previously seen in Solana—a setup that eventually led to a sharp and sustained upside move.
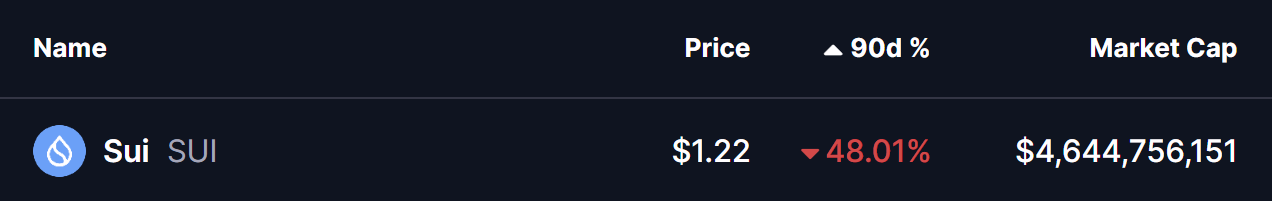
Source: Coinmarketcap
SUI Mirrors SOL’s Bottoming Path
A side-by-side comparison of SUI and SOL reveals striking similarities.
Back in early 2025, **Solana **topped near $295 before entering a sharp corrective phase. Price slipped below the 50-day moving average, signaling weakening momentum. The sell-off eventually stretched into a deep 67% drawdown, flushing out late longs and marking a clear sentiment reset.
That low proved pivotal.
Once SOL reclaimed its 50-day moving average, the trend structure flipped. What followed was a 163% rally, one of the most notable reversals of 2025.
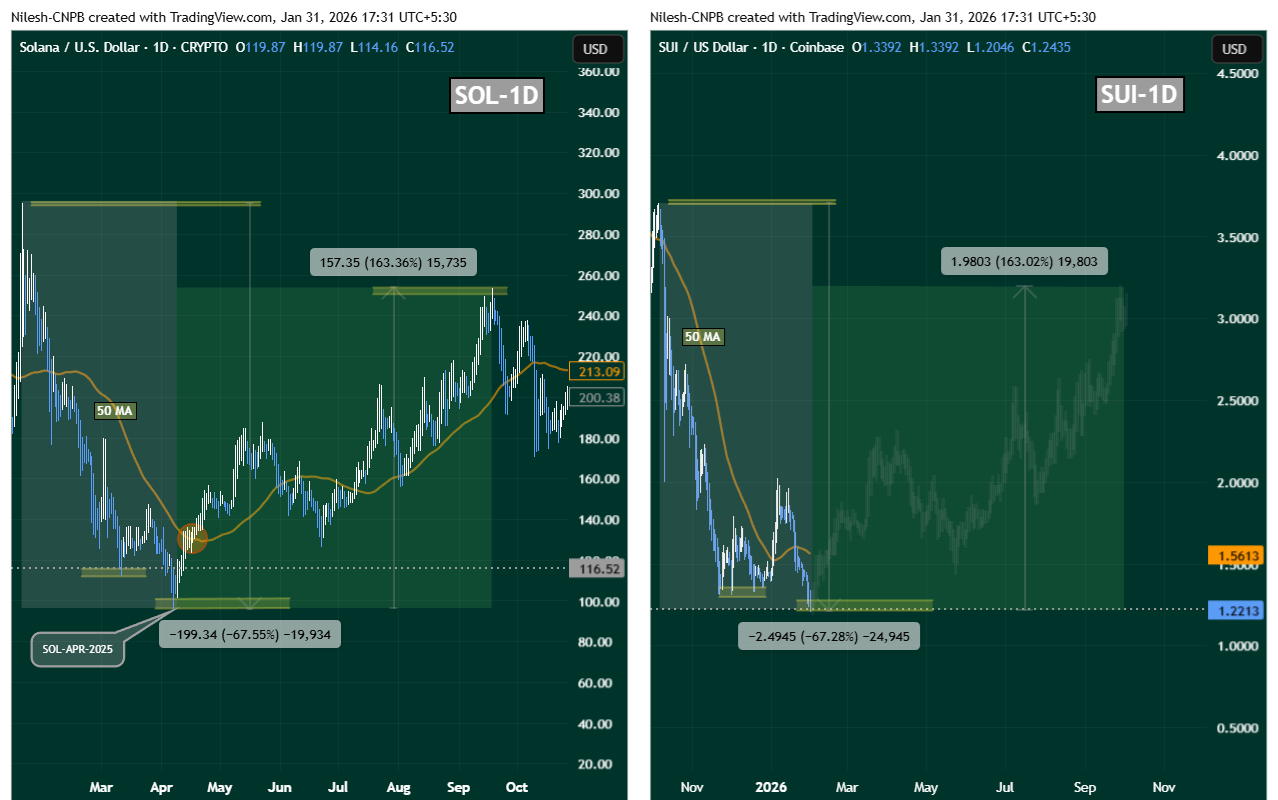
SOL and SUI Fractal Chart/Coinsprobe (Source: Tradingview)
SUI now appears to be following a similar script.
After peaking around $3.70 in October 2025, SUI entered a steep correction, losing its 50-day moving average and sliding into a nearly identical 67% drawdown. Momentum faded, volatility compressed, and price action began to flatten—classic characteristics of a market searching for a base.
What’s Next for SUI?
From a technical perspective, SUI is now sitting near a critical inflection zone around $1.20–$1.22, an area that could act as a potential bottom if buyers continue to defend it.
The first major confirmation bulls will want to see is a reclaim of the 50-day moving average, currently hovering near $1.56. A sustained move above this level would signal that bearish momentum is fading and that buyers are regaining control.
If that reclaim occurs, SUI could transition into a broader recovery phase. In a scenario where the SOL fractal continues to play out, upside expansion toward the $3.00–$3.20 region would come back into focus over the medium term.
Key Risk Note
While fractal comparisons can offer valuable context, they are not guarantees. Each asset trades within its own liquidity environment, sentiment cycle, and macro backdrop. For SUI, confirmation still matters—especially through moving average reclaims and consistent follow-through buying.
Until then, the structure suggests risk is compressing, not expanding.
Disclaimer: The views and analysis presented in this article are for informational purposes only and reflect the author’s perspective, not financial advice. Technical patterns and indicators discussed are subject to market volatility and may or may not yield the anticipated results. Investors are advised to exercise caution, conduct independent research, and make decisions aligned with their individual risk tolerance.
About Author: Nilesh Hembade is the Founder and Lead Author of Coinsprobe, with over 5 years of experience in the cryptocurrency and blockchain industry. Since launching Coinsprobe in 2023, he has been providing daily, research-driven insights through in-depth market analysis, on-chain data, and technical research.
Related Articles
HBAR Consolidates at $0.095 as Critical $0.094–$0.096 Zone Draws Focus
Solana Compresses Beneath $90 After Sharp Range Reclaim
Analysis: The Ethereum MVRV indicator shows that the price has entered a long-term bottom zone.
Analysis: The crypto community's concerns that Iran's cutoff of oil supplies could disrupt the market may be exaggerated.
Data shows: You need to hold Bitcoin for at least three years to avoid losses