ผู้เขียน: Kevin
ระบบนิเวศของ Gold Vaults บนแพลตฟอร์ม Hyperliquid มอบหน้าต่างพิเศษให้กับนักลงทุนในการสังเกตและเข้าร่วมกลยุทธ์อนุพันธ์บนบล็อกเชนที่ดำเนินการโดยผู้จัดการมืออาชีพ บทความนี้จะวิเคราะห์เชิงปริมาณและถอดรหัสกลยุทธ์ของ Gold Vaults ชั้นนำที่โดดเด่นที่สุดในระบบนิเวศนี้อย่างเป็นระบบ
กรอบการประเมินและระเบียบวิธีข้อมูล
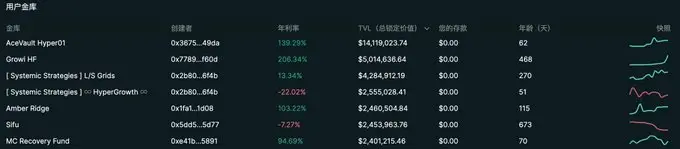
เพื่อเปรียบเทียบอย่างเป็นกลางและหลายมิติ เราได้คัดเลือก Gold Vaults ตัวแทน 5 รายที่มีขนาดการบริหารและผลการดำเนินงานอยู่ในอันดับต้น ๆ บน Hyperliquid ได้แก่ AceVault, Growi HF, Systemic Strategies, Amber Ridge และ MC Recovery Fund
กรอบการประเมินของเราจะเน้นที่ตัวชี้วัดหลักดังต่อไปนี้ เพื่อสร้างภาพรวมกลยุทธ์ของแต่ละ Gold Vault อย่างครบถ้วน:
ตัวชี้วัดผลการดำเนินงาน:
ผลตอบแทนที่ได้ในช่วงเวลา (PNL), จำนวนครั้งที่กำไร, จำนวนเทรดทั้งหมด, อัตราการชนะ (Win Rate), กำไร/ขาดทุน (PNL) factor (Profit Factor)
ตัวชี้วัดประสิทธิภาพการเทรด:
กำไร/ขาดทุน (PNL) เฉลี่ยต่อเทรด, กำไรเฉลี่ยต่อเทรด, สูญเสียเฉลี่ยต่อเทรด
ตัวชี้วัดการควบคุมความเสี่ยง:
การขาดทุนสูงสุด (Max Drawdown), ส่วนเบี่ยงเบนมาตรฐานของกำไร/ขาดทุน (PNL) ต่อเทรด, อัตราส่วนความผันผวนของกำไร/ขาดทุน (PNL) (กำไร/ขาดทุน (PNL) เฉลี่ย/ส่วนเบี่ยงเบนมาตรฐาน)
ตัวชี้วัดการวิเคราะห์กลยุทธ์:
การมีส่วนร่วมของกำไร/ขาดทุน (PNL) ในแต่ละเหรียญ, ความชอบตำแหน่งซื้อ/ขายในเหรียญเฉพาะ
ในด้านการดึงข้อมูล เราได้สกัดข้อมูลประวัติการเทรดที่ยาวที่สุดที่สามารถใช้ได้ของแต่ละ Gold Vault ที่จัดเก็บโดย Hyperliquid ต้องระบุว่า เนื่องจากข้อจำกัดการจัดเก็บข้อมูลของแพลตฟอร์ม Gold Vaults ที่เป็น HFT จะมีช่วงข้อมูลประวัติที่สั้นกว่า โดยหน้าต่างการวิเคราะห์ที่เราสามารถดึงได้อยู่ระหว่าง 3 วันถึง 2 เดือน สำหรับกลยุทธ์ที่มีความถี่เทรดต่ำ เราสามารถสังเกตผลการดำเนินงานในอดีตได้ยาวนานกว่า
AceVault Hyper01
ช่วงข้อมูลที่วิเคราะห์: 16 ตุลาคม 2025 - 20 ตุลาคม 2025
1.1 ภาพรวมกลยุทธ์และสถานะในตลาด
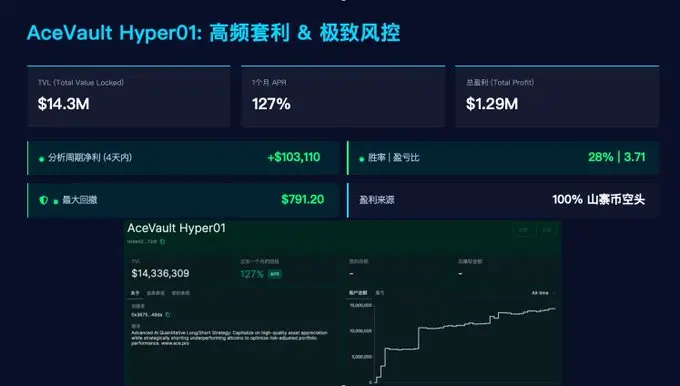
AceVault Hyper01 ไม่เพียงแต่เป็นหนึ่งใน Gold Vaults ที่มีขนาดสินทรัพย์ (TVL) ใหญ่ที่สุดในระบบนิเวศ Hyperliquid แต่ผลการดำเนินงานก็โดดเด่นเช่นกัน ณ วันที่ 20 ตุลาคม 2025 Gold Vault นี้มี TVL สูงถึง 14.33 ล้านดอลลาร์ ตั้งแต่เริ่มดำเนินการในเดือนสิงหาคม 2025 กลยุทธ์นี้ทำกำไรรวมแล้ว 1.29 ล้านดอลลาร์ โดยอัตราผลตอบแทนที่ได้ต่อปี (APR) ในช่วงเดือนล่าสุดสูงถึง 127% แสดงถึงศักยภาพในการสร้าง Alpha ที่แข็งแกร่งและยั่งยืน
(# 1.2 พฤติกรรมการเทรดและการวัดผล
ในช่วง 4 วันที่เลือกวิเคราะห์ Gold Vault นี้มีบันทึกการปิดสถานะทั้งหมด 19,338 รายการ ให้ตัวอย่างที่แม่นยำสำหรับการถอดรหัสกลยุทธ์
ตัวชี้วัดหลัก:
กำไรสุทธิ )Total PNL(: +$103,110.82
![])https://img-cdn.gateio.im/webp-social/moments-635ddec3eeafef510d16a28560353be7.webp###
อัตราการชนะ (Win Rate): 28%
กำไร/ขาดทุน (PNL) factor (Profit Factor): 3.71
โครงสร้างกำไร/ขาดทุน (PNL):
กำไร/ขาดทุน (PNL) เฉลี่ยต่อเทรด (Avg. PNL): +$5.33
กำไรเฉลี่ยต่อเทรด (Avg. Win): +$26.00
สูญเสียเฉลี่ยต่อเทรด (Avg. Loss): $2.70
ตัวชี้วัดความเสี่ยง:
การขาดทุนสูงสุด (Max Drawdown): $791.20
ส่วนเบี่ยงเบนมาตรฐานของกำไร/ขาดทุน (PNL) ต่อเทรด (StdDev of PNL): 26.84
อัตราส่วนความผันผวนของกำไร/ขาดทุน (PNL) (Avg. PNL / StdDev): 0.199
(# 1.3 ภาพกลยุทธ์และการวิเคราะห์ความเสี่ยง
ภาพกลยุทธ์: ความถี่สูง, ไม่สมมาตร, ระบบขาย
AceVault มีความถี่ในการเทรดสูงที่สุดในบรรดา Gold Vaults ทั้งหมด เป็นกลยุทธ์ HFT โดยแท้จริง อัตราการชนะเพียง 28% แต่กำไร/ขาดทุน (PNL) factor สูงถึง 3.71 สะท้อนลักษณะของกลยุทธ์ตามเทรนด์หรือโมเมนตัม: กลยุทธ์ไม่ได้พึ่งพาการชนะบ่อย แต่ใช้การเทรดที่กำไรมาก (กำไรเฉลี่ย $26.00) มาชดเชยการสูญเสียจำนวนมากแต่ถูกควบคุมอย่างเข้มงวด (สูญเสียเฉลี่ย $2.70)
โครงสร้างกำไร/ขาดทุน (PNL) ที่ไม่สมมาตรนี้คือหัวใจของโมเดลการทำกำไร
การวิเคราะห์กำไร: ชัยชนะจากการชอร์ต alts อย่างเป็นระบบ
กลยุทธ์นี้เทรดหลากหลาย (ครอบคลุม 77 สินทรัพย์) แต่การดำเนินการซื้อ/ขายมีความสม่ำเสมอและมีวินัยสูง:
ตำแหน่งซื้อ: ดำเนินการเฉพาะกับ BTC, ETH และ HYPE สามสินทรัพย์หลัก
ตำแหน่งขาย: ดำเนินการชอร์ตกับ alts อีก 74 เหรียญเท่านั้น
![])https://img-cdn.gateio.im/webp-social/moments-e155530d0fd293750afed4124b36a0dc.webp(
ในช่วงวิเคราะห์นี้ แหล่งกำไรชัดเจนมาก:
ตำแหน่งขาย: กำไรรวม +$137,804
ตำแหน่งซื้อ: สูญเสียรวม $33,726
แสดงว่า กำไรสุทธิทั้งหมดของ AceVault มาจากการชอร์ต alts 74 เหรียญอย่างเป็นระบบ ตำแหน่งที่ทำกำไรมากที่สุดคือ )สถานะ Short###+$34,579( ส่วนการสูญเสียกระจุกตัวที่ )ตำแหน่งซื้อ(-$16,100)
การควบคุมความเสี่ยง: การจำกัดการสูญเสียอย่างสุดขีด
กลยุทธ์นี้แสดงให้เห็นถึงความสามารถในการควบคุมความเสี่ยงระดับตำรา ใน TVL 14.33 ล้านดอลลาร์ และความถี่เทรดเกือบ 20,000 ครั้ง การขาดทุนสูงสุดใน 4 วันถูกจำกัดไว้ที่ $791.20 ซึ่งโดดเด่นมาก สอดคล้องกับสูญเสียเฉลี่ยต่อเทรด -$2.70 พิสูจน์ว่ากลยุทธ์นี้มีระบบ stop loss ที่เข้มงวดและเป็นระบบ
$FXS # 1.4 สรุป
AceVault Hyper01 เป็นกลยุทธ์ความถี่สูงที่มีตรรกะชัดเจน ดำเนินการอย่างเข้มงวดและเป็นระบบสูง โหมดหลักคือการถือครองตำแหน่งซื้อในสินทรัพย์หลัก (อาจใช้เป็น BETA hedge หรือถือระยะยาว) พร้อมกับดำเนินการชอร์ต alts ในตลาดกว้างอย่างเป็นระบบด้วยความถี่สูง
ในช่วงตลาดที่วิเคราะห์ กลยุทธ์นี้สร้างผลตอบแทนที่ได้ส่วนเกินจากการจับเทรนด์ร่วงของ alts ได้อย่างแม่นยำ ระบบควบคุมความเสี่ยงระดับสูงสุดช่วยให้การดำเนินกลยุทธ์อัตราการชนะต่ำ การสูญเสียถูกจำกัดในกรอบที่ควบคุมได้ ส่งผลให้กำไรโดยรวมแข็งแกร่งและมีสุขภาพดี
( สรุป
จากการวิเคราะห์เชิงลึก Gold Vaults ชั้นนำ 5 ราย (AceVault, Growi HF, Systemic Strategies, Amber Ridge, MC Recovery Fund) บน Hyperliquid เราสามารถเจาะลึกผ่านภาพลวงตาของ APR สูงและกำไรรวม เพื่อเข้าใจแก่นแท้ของกลยุทธ์—ไม่ใช่ทุกผลตอบแทนที่ได้จะ “เท่าเทียมกันโดยกำเนิด”
![])https://img-cdn.gateio.im/webp-social/moments-f82dd4c84dff2dd173e4201214b70085.webp$HYPE
การวิเคราะห์ของเราเผยข้อสรุปสำคัญหลายประการ:
-
การควบคุมความเสี่ยง ไม่ใช่อัตราการชนะ คือรากฐานของกลยุทธ์ชั้นนำ: ตรงข้ามกับความเชื่อเดิม Gold Vaults ที่ประสบความสำเร็จที่สุดในบทวิเคราะห์นี้ไม่ได้พึ่งพาอัตราการชนะสูง (AceVault 28%, Growi HF 38%, MC Recovery 48%) แต่ชัยชนะมาจากตรรกะร่วมที่ถูกดำเนินการอย่างเข้มงวด: โครงสร้างกำไร/ขาดทุน (PNL) ที่ไม่สมมาตร
-
ตัวอย่าง “ชัยชนะไม่สมมาตร”: MC Recovery Fund คือสุดยอดของโมเดลนี้ กำไร/ขาดทุน (PNL) factor 43.1 น่าทึ่งมาก เบื้องหลังคือการควบคุมความเสี่ยงเกือบสมบูรณ์แบบ: สูญเสียเฉลี่ยต่อเทรดเพียง $18 แต่กำไรเฉลี่ยสูงถึง +$862 Growi HF (กำไร/ขาดทุน (PNL) factor 10.76) ก็เช่นกัน แสดงว่ากำไรของพวกเขาไม่ได้มาจาก “ชนะบ่อย” แต่จาก “สูญเสียเล็กน้อยเมื่อแพ้ และจับกำไรใหญ่เมื่อชนะ”
-
การขาดทุนสูงสุดคือ “stress test” ของกลยุทธ์: เปรียบเทียบ “การขาดทุนสูงสุด” และ “สัดส่วนการขาดทุน” ในตาราง จะเห็นความแข็งแกร่งของกลยุทธ์ MC Recovery Fund ###ขาดทุน $3,922### และ AceVault (ขาดทุน $791) แสดงการควบคุมความเสี่ยงระดับตำรา การขาดทุนสูงสุดในอดีตแทบไม่มีนัยสำคัญ
ในทางกลับกัน Amber Ridge มีการขาดทุนสูงสุดถึง $340,000 คิดเป็น 87% ของกำไรรวม หมายความว่านักลงทุนเกือบเผชิญความผันผวนสุดขีด “กำไรเป็นศูนย์” Systemic Strategies ก็มีการขาดทุนสูงสุด $128,000 ในช่วงหลัง เผยให้เห็นความเปราะบางของโมเดล
- แหล่งที่มาของ Alpha แตกต่างกัน: เส้นทางสู่ความสำเร็จของแต่ละกลยุทธ์ไม่เหมือนกัน AceVault ทำกำไรจากการชอร์ต alts ด้วยระบบความถี่สูง Growi HF เป็นสายดุดันล่าตำแหน่งซื้อ จับเทรนด์ภายใต้การควบคุมความเสี่ยงเข้มงวด MC Recovery Fund แสดงความสมดุลระหว่างตำแหน่งซื้อ/ขาย เป็นกลยุทธ์ “ทุกสภาพอากาศ” พิสูจน์ความลึกของระบบนิเวศ Hyperliquid ที่เปิดโอกาสให้กลยุทธ์ Alpha หลากหลายอยู่ร่วมกัน
สำหรับนักลงทุน การประเมิน Gold Vaults ไม่ควรดูแค่ APR ภายนอก คุณค่าที่แท้จริงของกลยุทธ์ซ่อนอยู่ในกำไร/ขาดทุน (PNL) factor และการควบคุมความเสี่ยงที่การขาดทุนสูงสุดเปิดเผย ในสนามแข่งขัน Hyperliquid ที่มีความผันผวนและเลเวอเรจสูง โครงสร้างกำไร/ขาดทุน (PNL) ที่ไม่สมมาตรคือหัวใจของการทำกำไรระยะยาว และการควบคุมความเสี่ยงอย่างสุดขีดคือเส้นทางเดียวสู่ชัยชนะ
