2025 AMP Fiyat Tahmini: Flexa'nın Token'ı Dijital Ödeme Ekosisteminde Yeni Zirvelere Ulaşacak mı?


Giriş: AMP'nin Piyasa Konumu ve Yatırım Değeri
AMP (AMP), Flexa ödeme ağının yerel teminat token'ı olarak, 2020'de piyasaya sürülmesinden bu yana kayda değer ilerlemeler sağladı. 2025 itibarıyla AMP'nin piyasa değeri 210.831.060 Amerikan Doları'na ulaştı; dolaşımdaki arz yaklaşık 84.231.346.590 token ve fiyatı 0,002503 Amerikan Doları civarında seyrediyor. "Ödeme teminatı öncüsü" olarak anılan bu varlık, kripto para ödemelerinin güvenli ve verimli şekilde gerçekleşmesinde giderek daha önemli bir rol oynuyor.
Bu makalede, AMP'nin 2025-2030 dönemindeki fiyat hareketleri; tarihsel gelişim, piyasa arz-talep dengesi, ekosistem gelişimi ve makroekonomik etkiler ışığında detaylı olarak incelenecek, yatırımcılara profesyonel fiyat tahminleri ve uygulanabilir yatırım stratejileri sunulacaktır.
I. AMP Fiyat Geçmişi ve Güncel Piyasa Durumu
AMP'nin Tarihsel Fiyat Gelişimi
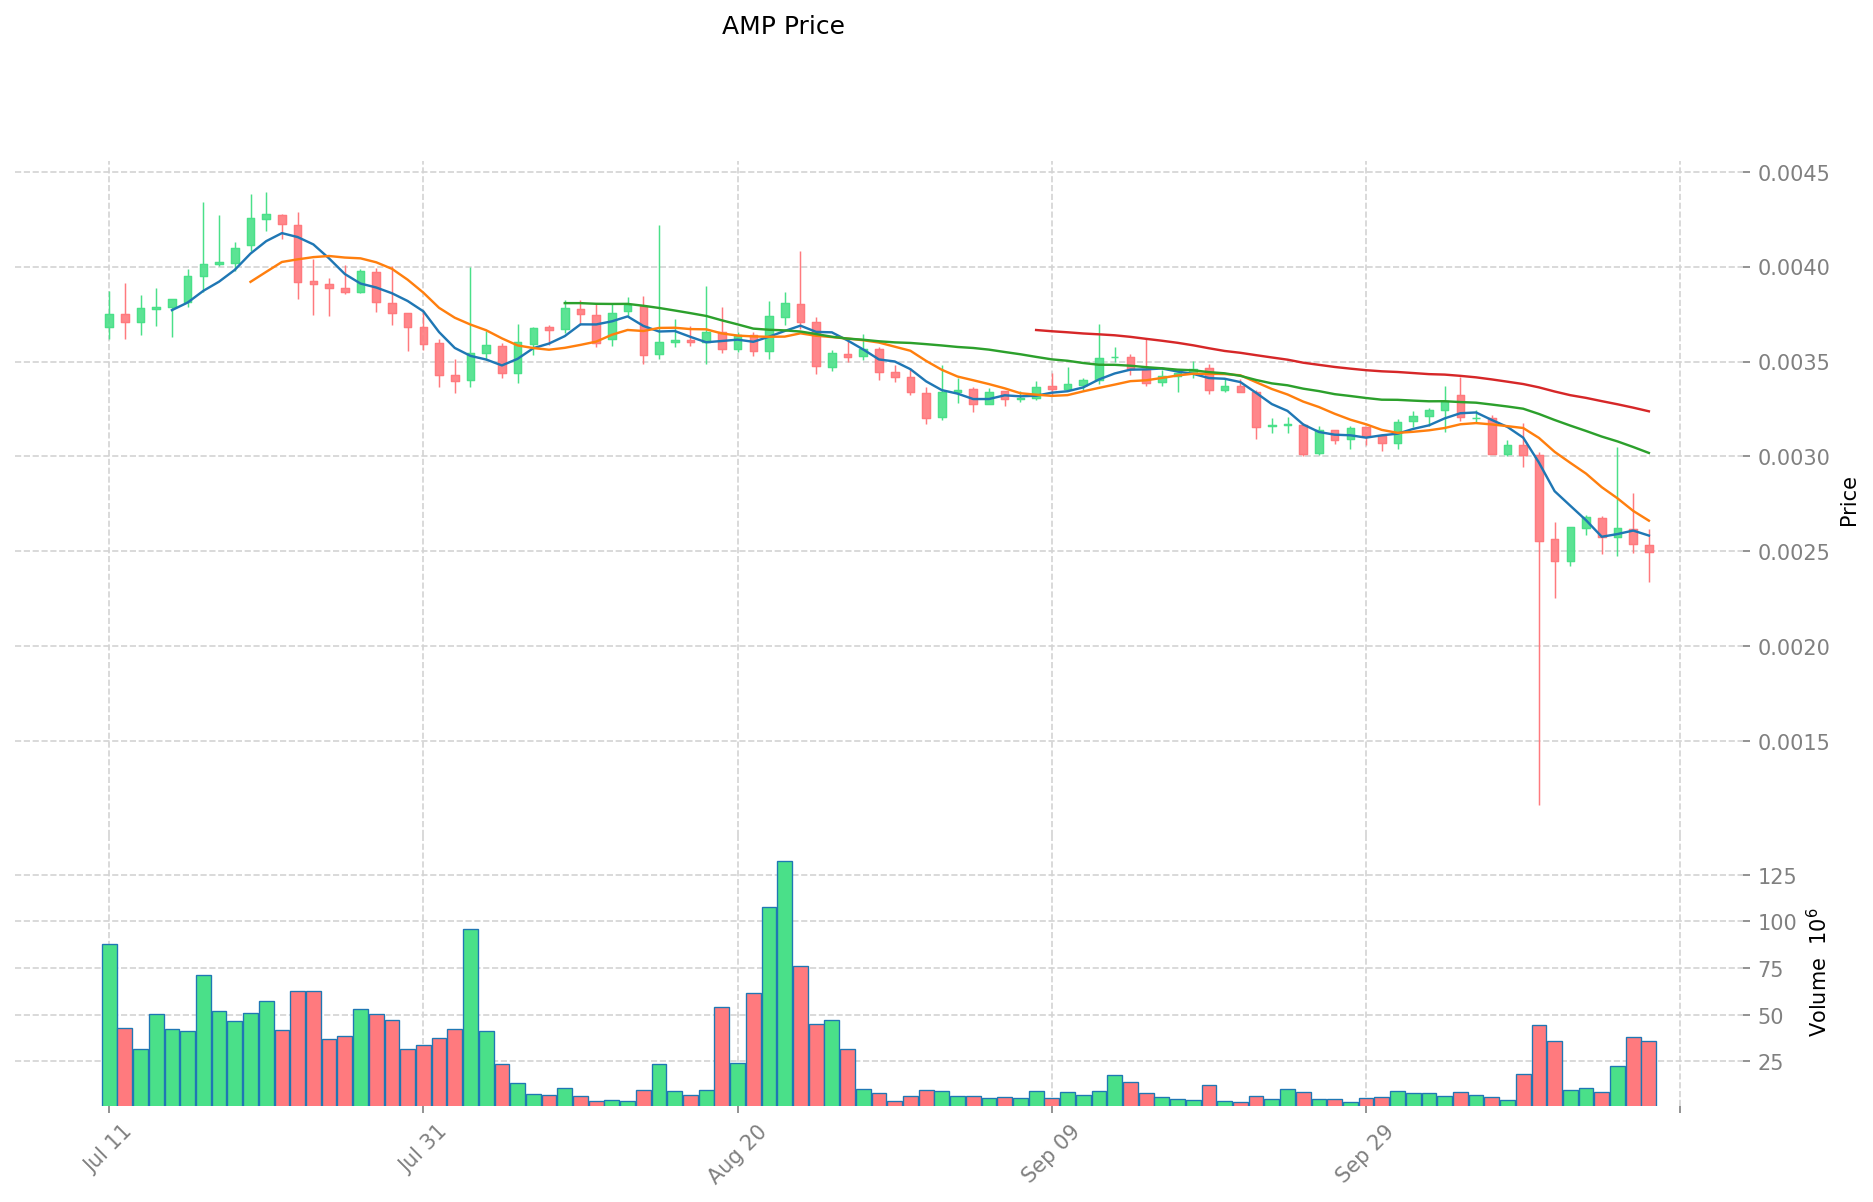
- 2020: AMP token piyasaya sürüldü, başlangıç fiyatı yaklaşık 0,00167 Amerikan Doları
- 2021: 17 Haziran'da tüm zamanların en yüksek seviyesi olan 0,120813 Amerikan Doları'na ulaştı
- 2023: Piyasa düşüşüyle, 13 Ekim'de tüm zamanların en düşük seviyesi olan 0,00140933 Amerikan Doları'na geriledi
AMP Güncel Piyasa Görünümü
18 Ekim 2025 itibarıyla AMP, 0,002503 Amerikan Doları seviyesinden işlem görüyor. Son 24 saatte %1,02 oranında değer kaybederken, işlem hacmi 89.796 Amerikan Doları oldu. AMP'nin piyasa değeri 210.831.060 Amerikan Doları'na ulaşarak kripto para sıralamasında 259. sırada yer aldı. Mevcut fiyat, tüm zamanların en yüksek seviyesinden %97,93 oranında gerilese de, tüm zamanların en düşük seviyesinden %77,6 oranında toparlandı. Son bir haftada AMP %6,51 artış göstererek kısa vadede yukarı yönlü hareket potansiyeli sergiledi. Ancak, son 30 gün ve 1 yıl fiyat değişimleri sırasıyla -%27,55 ve -%34,03 ile uzun vadeli düşüş baskısının sürdüğünü gösteriyor.
Güncel AMP piyasa fiyatını görmek için tıklayın
AMP Piyasa Duyarlılık Göstergesi
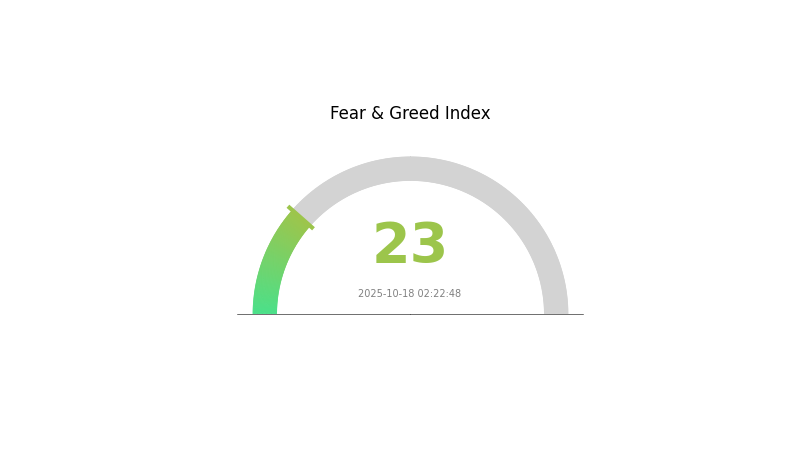
18 Ekim 2025 Korku ve Açgözlülük Endeksi: 23 (Aşırı Korku)
Güncel Korku ve Açgözlülük Endeksi için tıklayın
Kripto piyasasında aşırı korku hakim; Korku ve Açgözlülük Endeksi 23 seviyesine geriledi. Bu denli düşük bir duyarlılık, genellikle karşıt yatırımcılar için potansiyel alım fırsatına işaret eder. Yine de, piyasa kırılgan olduğu için dikkatli olunmalı. Yatırımcılar kritik destek seviyelerini izlemeli ve ani dalgalanmalara hazırlıklı olmalıdır. Korkunun hakim olduğu dönemlerde, tarihsel olarak bu tip dip seviyeler önemli yükselişlerin öncüsü olmuştur. Unutmayın, kapsamlı araştırma ve etkin risk yönetimi, belirsiz piyasa koşullarında çok önemlidir.
AMP Varlık Dağılımı
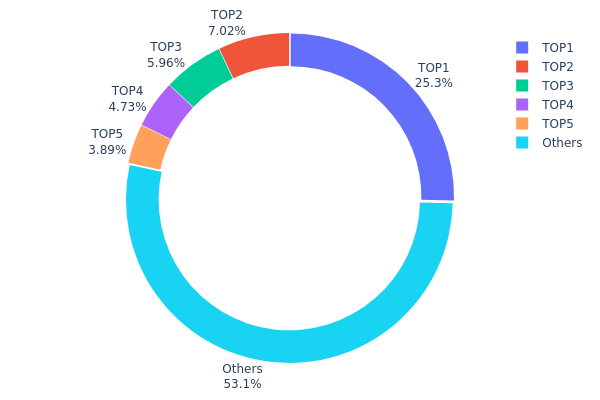
AMP'nin adres varlık dağılımı verileri, token'ların önemli bir kısmının az sayıda büyük adreste toplandığını gösteriyor. En büyük adres toplam arzın %25,34'ünü elinde bulunduruyor; diğer dört büyük adresin ise her biri %3,88 ile %7,01 arasında varlığa sahip. İlk beş adres, AMP token'larının toplamda %46,91'ini elinde tutarken kalan %53,09 ise diğer adresler arasında dağılmış durumda.
Bu yapı, AMP token dağılımında orta düzeyde bir merkezileşmeye işaret ediyor. Yoğunluk aşırı olmasa da, üst adreslerin büyük payları piyasa hareketlerini etkileyebilir. Özellikle bir adresin arzın dörtte birinden fazlasına sahip olması, piyasa manipülasyonu riski ve büyük işlemlerde fiyat oynaklığı ihtimalini artırabilir.
Bununla birlikte, token'ların yarısından fazlasının ilk beş adres dışında tutulması, daha geniş bir sahip tabanına dağılımı gösteriyor. Bu dağılım, büyük paydaşlar ve küçük yatırımcılar arasında bir denge sunarak piyasada istikrar ve likiditeyi destekler; ancak, büyük sahiplerin piyasa üzerindeki etkisi göz önünde bulundurulmalıdır.
Güncel AMP Varlık Dağılımı için tıklayın
| En Büyük | Adres | Varlık Miktarı | Varlık (%) |
|---|---|---|---|
| 1 | 0x5d27...1d675f | 25.277.710,73K | 25,34% |
| 2 | 0x9eda...69fd62 | 7.000.000,00K | 7,01% |
| 3 | 0x0c3a...60c7bd | 5.938.990,20K | 5,95% |
| 4 | 0x706d...e7c578 | 4.717.268,90K | 4,73% |
| 5 | 0xafcd...45c5da | 3.874.174,72K | 3,88% |
| - | Diğerleri | 52.911.855,81K | 53,09% |
II. AMP'nin Gelecekteki Fiyatını Etkileyecek Temel Unsurlar
Arz Mekanizması
- Token Yakımı: AMP, toplam arzı zamanla azaltmak için token yakım mekanizması uygular; bu durum kıtlık ve değer artışı yaratabilir.
- Tarihsel Etki: Geçmiş token yakımları genellikle kısa vadeli fiyat artışına yol açmıştır.
- Güncel Beklenti: Yaklaşan token yakımının AMP fiyatına olumlu etki yapması bekleniyor; ancak etki derecesi piyasa koşullarına bağlı olarak değişebilir.
Kurumsal ve Büyük Yatırımcı Dinamikleri
- Kurumsal Varlıklar: Son aylarda birçok büyük kripto yatırım firması AMP varlıklarını artırdı.
- Kurumsal Benimsenme: Bazı fintech şirketleri AMP'yi ödeme sistemlerine entegre etmeye başladı.
Makroekonomik Ortam
- Para Politikası Etkisi: Merkez bankalarının parasal sıkılaştırma uygulamaları, kripto piyasasında likiditenin azalmasına ve AMP'nin fiyatına olumsuz yansıyabilir.
- Enflasyona Karşı Koruma: AMP, enflasyon dönemlerinde belirli bir dayanıklılık göstermiştir; fakat geleneksel enflasyon koruma araçları kadar güçlü değildir.
Teknik Gelişim ve Ekosistem Büyümesi
- Ölçeklenebilirlik Güncellemesi: Yakında yapılacak işlem kapasitesi artırımı, AMP'nin yüksek hacimli ödeme senaryolarında faydasını yükseltecek.
- Çapraz Zincir Entegrasyonu: AMP'nin çoklu blockchain ağlarında kullanılmasını sağlayacak geliştirmeler, yeni kullanım alanları ve daha geniş piyasa erişimi sağlayabilir.
- Ekosistem Uygulamaları: AMP ağı üzerinde merkeziyetsiz finans ve ödeme çözümlerine odaklanan çeşitli DApp'ler inşa edildi; bu büyüyen ekosistemi destekliyor.
III. AMP 2025-2030 Fiyat Tahmini
2025 Öngörüsü
- Temkinli tahmin: 0,00183 Amerikan Doları - 0,00250 Amerikan Doları
- Tarafsız tahmin: 0,00250 Amerikan Doları - 0,00278 Amerikan Doları
- İyimser tahmin: 0,00278 Amerikan Doları - 0,00305 Amerikan Doları (olumlu piyasa duyarlılığı ve benimsenme artışı gerektirir)
2027-2028 Öngörüsü
- Piyasa aşaması beklentisi: Artan volatilite ile büyüme dönemi ihtimali
- Fiyat aralığı tahmini:
- 2027: 0,00204 Amerikan Doları - 0,00452 Amerikan Doları
- 2028: 0,00283 Amerikan Doları - 0,00448 Amerikan Doları
- Kilit katalizörler: AMP'nin ödeme sistemlerinde yaygın benimsenmesi, olumlu regülasyon gelişmeleri
2030 Uzun Vadeli Öngörü
- Temel senaryo: 0,00449 Amerikan Doları - 0,00467 Amerikan Doları (istikrarlı büyüme ve benimsenme varsayımıyla)
- İyimser senaryo: 0,00467 Amerikan Doları - 0,00626 Amerikan Doları (AMP kullanım alanlarının hızla büyümesiyle)
- Dönüştürücü senaryo: 0,00626 Amerikan Doları ve üzeri (büyük ortaklıklar veya teknolojik atılımlar gibi aşırı olumlu koşullarda)
- 31 Aralık 2030: AMP 0,00626 Amerikan Doları (iyimser projeksiyona göre potansiyel zirve fiyat)
| Yıl | Tahmini Maksimum Fiyat | Tahmini Ortalama Fiyat | Tahmini Minimum Fiyat | Değişim Oranı (%) |
|---|---|---|---|---|
| 2025 | 0,00305 | 0,0025 | 0,00183 | 0 |
| 2026 | 0,00392 | 0,00278 | 0,00181 | 10 |
| 2027 | 0,00452 | 0,00335 | 0,00204 | 33 |
| 2028 | 0,00448 | 0,00393 | 0,00283 | 56 |
| 2029 | 0,00514 | 0,00421 | 0,00219 | 67 |
| 2030 | 0,00626 | 0,00467 | 0,00449 | 86 |
IV. AMP Profesyonel Yatırım Stratejileri ve Risk Yönetimi
AMP Yatırım Metodolojisi
(1) Uzun Vadeli Tutma Stratejisi
- Uygunluk: Uzun vadeli perspektife sahip, risk toleransı yüksek yatırımcılar
- İşlem önerileri:
- Piyasa geri çekilmelerinde AMP token biriktirmek
- Flexa ağında AMP staking yaparak ödül kazanmak
- AMP token'larını güvenli donanım cüzdanında muhafaza etmek
(2) Aktif Alım-Satım Stratejisi
- Teknik analiz araçları:
- Hareketli Ortalamalar: Trend ve olası giriş/çıkış noktalarını belirlemek için kullanılır
- Göreceli Güç Endeksi (RSI): Aşırı alım/aşırı satım koşullarını takip edin
- Dalgalı alım-satım için ana noktalar:
- Flexa ağının benimsenme durumunu ve ortaklıklarını izleyin
- Genel kripto para piyasası duyarlılığına dikkat edin
AMP Risk Yönetimi Çerçevesi
(1) Varlık Dağılımı Prensipleri
- Koruyucu yatırımcılar: Kripto portföyünün %1-3'ü
- Agresif yatırımcılar: Kripto portföyünün %5-10'u
- Profesyonel yatırımcılar: Kripto portföyünün %15'e kadar
(2) Riskten Korunma Çözümleri
- Diversifikasyon: Yatırımlarınızı birden fazla kripto para arasında dağıtın
- Zarar durdur emirleri: Potansiyel kayıpları sınırlamak için önceden belirlenmiş çıkış noktaları oluşturun
(3) Güvenli Saklama Çözümleri
- Donanım cüzdan önerisi: Gate Web3 cüzdan
- Yazılım cüzdan alternatifi: Resmi AMP cüzdan (mevcutsa)
- Güvenlik önlemleri: İki faktörlü doğrulama etkinleştirin, güçlü şifreler kullanın
V. AMP'nin Potansiyel Riskleri ve Zorlukları
AMP Piyasa Riskleri
- Oynaklık: AMP fiyatında ciddi dalgalanmalar yaşanabilir
- Likidite: Büyük kripto paralara kıyasla daha düşük işlem hacmi
- Rekabet: Ödeme ağında başka teminat token'ları ortaya çıkabilir
AMP Regülasyon Riskleri
- Belirsiz regülasyonlar: Kripto para düzenlemelerinde olası değişiklikler
- Uyum sorunları: Flexa ağı bazı ülkelerde regülasyon zorluklarıyla karşılaşabilir
- Vergi etkileri: Değişen vergi yasaları AMP token sahiplerini etkileyebilir
AMP Teknik Riskleri
- Akıllı kontrat açıkları: AMP token sözleşmesinde güvenlik zaafları oluşabilir
- Ağ ölçeklenebilirliği: Flexa ağı büyüdükçe teknik zorluklar ortaya çıkabilir
- Entegrasyon riskleri: Flexa teknolojisinin iş yeri entegrasyonunda sorunlar yaşanabilir
VI. Sonuç ve Eylem Önerileri
AMP Yatırım Değeri Değerlendirmesi
AMP, kripto ödeme sektöründe özgün bir değer sunuyor ve uzun vadede büyüme potansiyeline sahip. Ancak, kısa vadeli volatilite ve regülasyon belirsizlikleri ciddi riskler oluşturuyor.
AMP Yatırım Tavsiyeleri
✅ Yeni başlayanlar: Detaylı araştırma sonrası küçük ve uzun vadeli pozisyonlar alın ✅ Deneyimli yatırımcılar: Dolar-maliyet ortalaması uygulayın ve sıkı risk yönetimi sağlayın ✅ Kurumsal yatırımcılar: AMP'yi çeşitlendirilmiş kripto portföyünde değerlendirin; özellikle ödeme ağlarındaki rolüne odaklanın
AMP İşlem Katılım Yöntemleri
- Spot işlem: Gate.com üzerinden AMP token satın alabilirsiniz
- Staking: Flexa ağında AMP staking'e katılın
- DeFi entegrasyonu: AMP token'ını içeren olası DeFi fırsatlarını değerlendirin
Kripto para yatırımları son derece yüksek risk içerir; bu makale yatırım tavsiyesi değildir. Yatırımcılar, kararlarını kendi risk toleranslarına göre dikkatlice vermeli ve profesyonel finansal danışmanlardan destek almalıdır. Asla kaybetmeyi göze alabileceğinizden fazla yatırım yapmayın.
Sıkça Sorulan Sorular
AMP kripto 1 Amerikan Doları'na ulaşabilir mi?
Uzun vadede iddialı hedefler için AMP'nin 1 Amerikan Doları'na ulaşması mümkündür; bunun için benimsenme ve piyasa büyümesi gereklidir. Fakat bu, kripto ekosisteminde ve Flexa ağında büyük gelişmeler gerektirir.
AMP Coin'in geleceği var mı?
Evet, AMP coin için gelecek umut verici. Flexa ağının teminat token'ı olarak dijital ödemelerde benimsenmesinin artması muhtemel; bu da değerini ve kullanımını önümüzdeki yıllarda yükseltebilir.
AMP'nin 2025 hisse fiyatı tahmini nedir?
Piyasa trendleri ve uzman analizlerine göre, AMP'nin 2025 fiyat tahmini token başına 0,15 ile 0,20 Amerikan Doları arasındadır; bu da mevcut değerlere göre önemli büyüme potansiyeli taşır.
AMP yükselişe geçecek mi?
Evet, AMP'nin yükseliş potansiyeli güçlü. Ödeme ağlarındaki işlevi ve artan benimsenmesi, önümüzdeki yıllarda belirgin fiyat artışını destekliyor.
Share
Content
Giriş: AMP'nin Piyasa Konumu ve Yatırım Değeri
I. AMP Fiyat Geçmişi ve Güncel Piyasa Durumu
II. AMP'nin Gelecekteki Fiyatını Etkileyecek Temel Unsurlar
III. AMP 2025-2030 Fiyat Tahmini
IV. AMP Profesyonel Yatırım Stratejileri ve Risk Yönetimi
V. AMP'nin Potansiyel Riskleri ve Zorlukları
VI. Sonuç ve Eylem Önerileri
Sıkça Sorulan Sorular
How to Buy Cryptocurrency


Trending Cryptocurrencies


TRON ($TRX) AUD Fiyatı ve Potansiyeli

2025 REQ Fiyat Tahmini: Piyasa Trendleri ve Olası Büyüme Faktörlerinin Analizi

2025 yılında XLM, önde gelen rakipleriyle nasıl bir performans sergiliyor?
Dash, performans ve pazar payı bakımından rakipleriyle nasıl kıyaslanıyor?

XLM Performans ve Pazar Payı Açısından Rakipleriyle Nasıl Karşılaştırılır?
2025 AMP Fiyat Tahmini: Bu kripto para yeni zirvelere ulaşacak mı yoksa piyasa düzeltmesiyle mi karşılaşacak?

MNT Nedir: Yönetilen Ağ Hizmetleri ve Teknoloji Çözümlerine Kapsamlı Bir Rehber

DAI nedir: Merkeziyetsiz stabilcoin’in ve DeFi ekosistemindeki rolünün detaylı bir incelemesi

SHIB nedir: Shiba Inu Token ve Kripto Para Piyasasındaki Rolüne Dair Kapsamlı Bir Rehber

HBAR nedir: Hedera'nın yerel kripto parası ve ekosistemdeki rolüne kapsamlı bir rehber

2025 SUI Fiyat Tahmini: Sui Önümüzdeki Yıl Yeni Rekorlar Kıracak mı?