The US Stock Market, Bitcoin (BTC) and various altcoins are striving to regain their momentum after a sharp plummet on Friday, when US President Donald Trump unexpectedly announced a 100% tax on imports from China.
The drop has been described by analysts as “brutal”, with data from CoinGlass showing that around 20 billion USD in positions were liquidated in just 24 hours. Many traders using high leverage and lacking risk management discipline have suffered heavy losses.
However, this deep adjustment also has a positive significance as it helps to “wash away some bubbles” in the market, creating an opportunity for long-term capital to return and buy in at more attractive price levels. Although the recovery momentum has begun to form, analysts believe that the likelihood of an immediate strong rally is low.
Economist Timothy Peterson shared on Sunday that Bitcoin may enter a “cooling-off period” lasting 3 to 4 weeks before resuming its upward trend, but “at a slower pace than before.”
The question now is: Do Bitcoin and altcoins have enough strength to continue recovering, or will higher price levels again become the trigger point for profit-taking sell-offs? Let's analyze the charts of the top 10 cryptocurrencies to find the answer.
Technical Analysis of SPX
The S&P 500 (SPX) index sharply reversed downwards on Friday, breaking through the 20-day exponential moving average (EMA, around 6,652 points), indicating increased profit-taking pressure from investors.
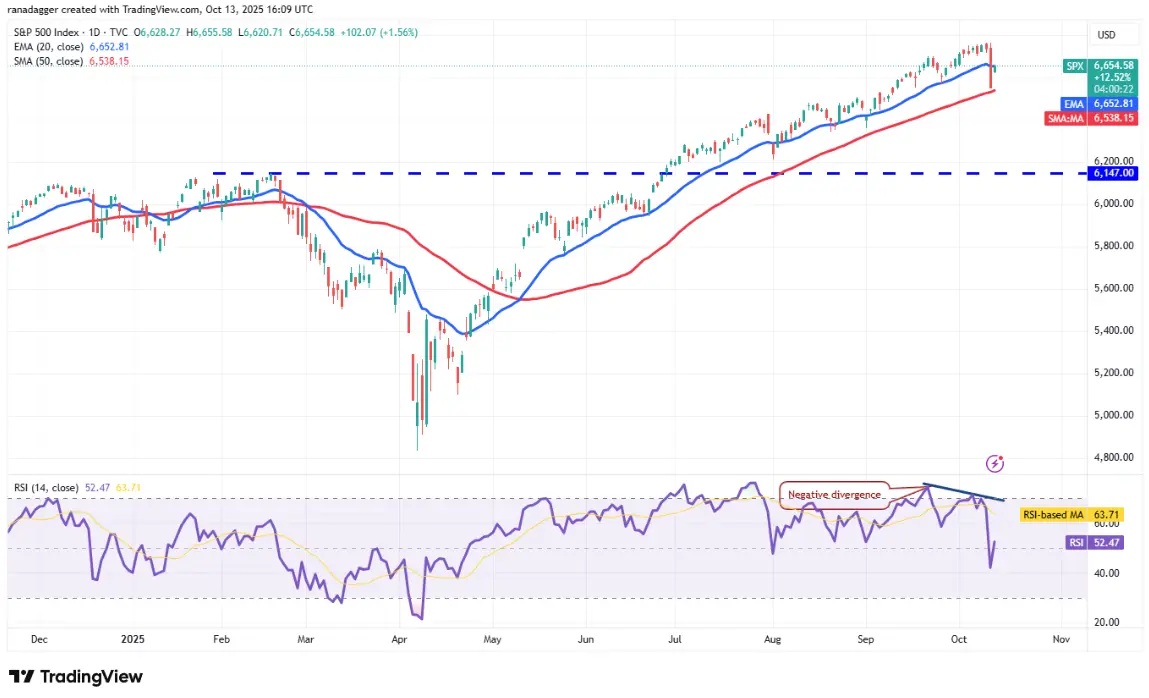 Daily SPX Chart | Source: TradingViewHowever, buying pressure quickly emerged at the 50-day simple moving average (SMA, around 6,538 points), helping the index to recover slightly and head back towards the EMA 20. If this upward momentum is halted at the EMA 20, bears may take the opportunity to reassert control, pulling SPX below the 50-day SMA. In that scenario, the correction could extend to the support zone of 6,350, even 6,200 points.
Conversely, if the closing price remains solid above the EMA 20 line, this signal will indicate that the short-term correction phase has been completed, opening up the possibility for the index to continue advancing towards testing the historical peak of 6,764 points.
Technical Analysis of DXY
The USD index (DXY) closed above the moving averages on Tuesday, indicating that the bears are gradually losing control.
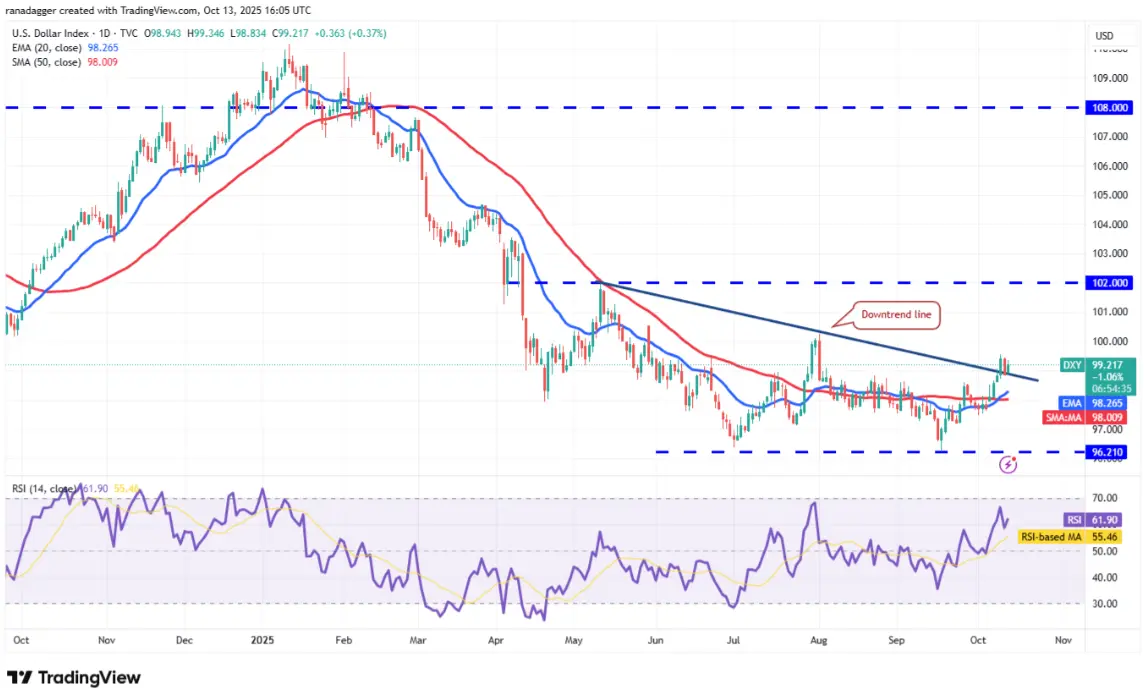 DXY Daily Chart | Source: TradingViewThe bulls pushed the price above the downtrend line on Thursday, but have not been able to maintain the breakout momentum. Likely, the bears will try to pull the price below the 20-day EMA (98,26) — an important short-term support area to watch.
If the price strongly rebounds from the EMA 20 line, the chances of breaking above the 100.50 mark will increase, paving the way for the DXY to move towards the 102 range.
On the contrary, if the closing price is below the moving averages, it indicates that the market has “rejected” the breakout of the downtrend. At that point, the DXY could plummet towards the 97 level and further to the strong support level of 96.21.
Technical Analysis of BTC
The bears have failed to complete the double top pattern on Bitcoin, as the price could not close below the support area of 107,000 USD.
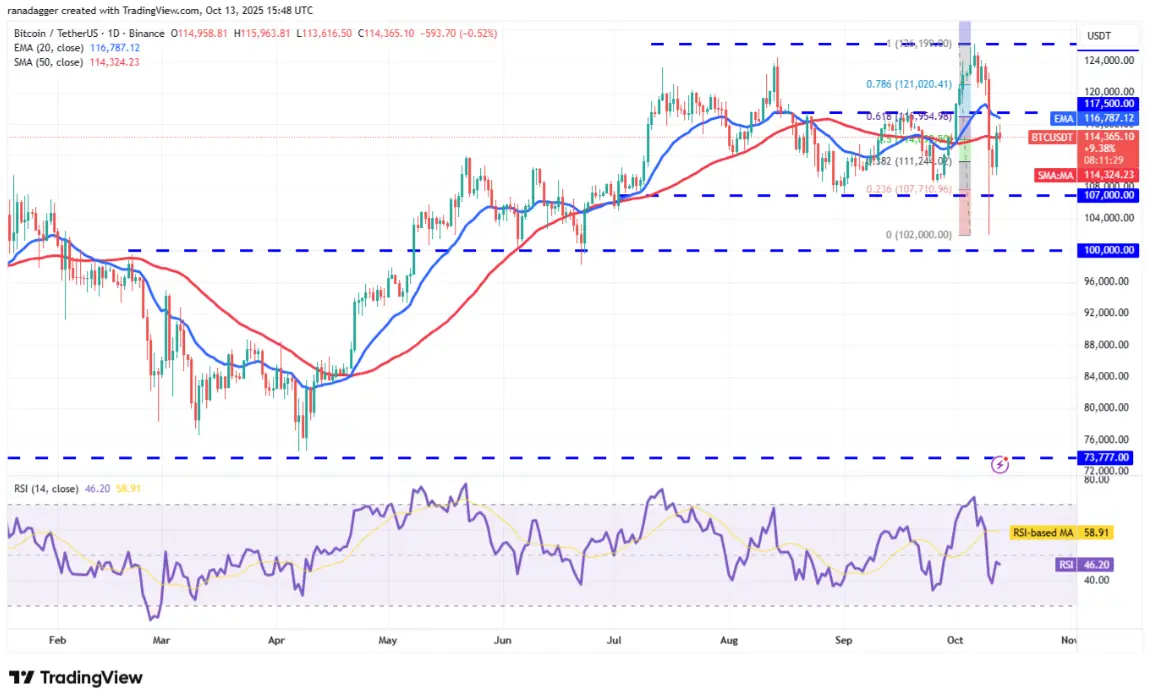 BTC/USDT Daily Chart | Source: TradingViewBTC price dropped to 102,000 USD on Friday but quickly bounced back, indicating that buying support has emerged at lower price levels. The BTC/USDT pair is expected to face resistance at the 61.8% Fibonacci retracement level around 116,955 USD.
If the bulls break through this resistance zone, the price could rise to 121,020 USD, further to the historical peak of 126,199 USD.
On the contrary, if the price is strongly rejected at the current level, the nearest support levels are 109,500 USD and 107,000 USD. The bulls are likely to fiercely defend the 107,000 USD mark, as a break below this level would increase the risk of BTC dropping deep below 100,000 USD.
Technical Analysis of ETH
The bears have pulled the price of Ether (ETH) below the descending price channel on Friday and Saturday, but were unable to maintain the lower price level.
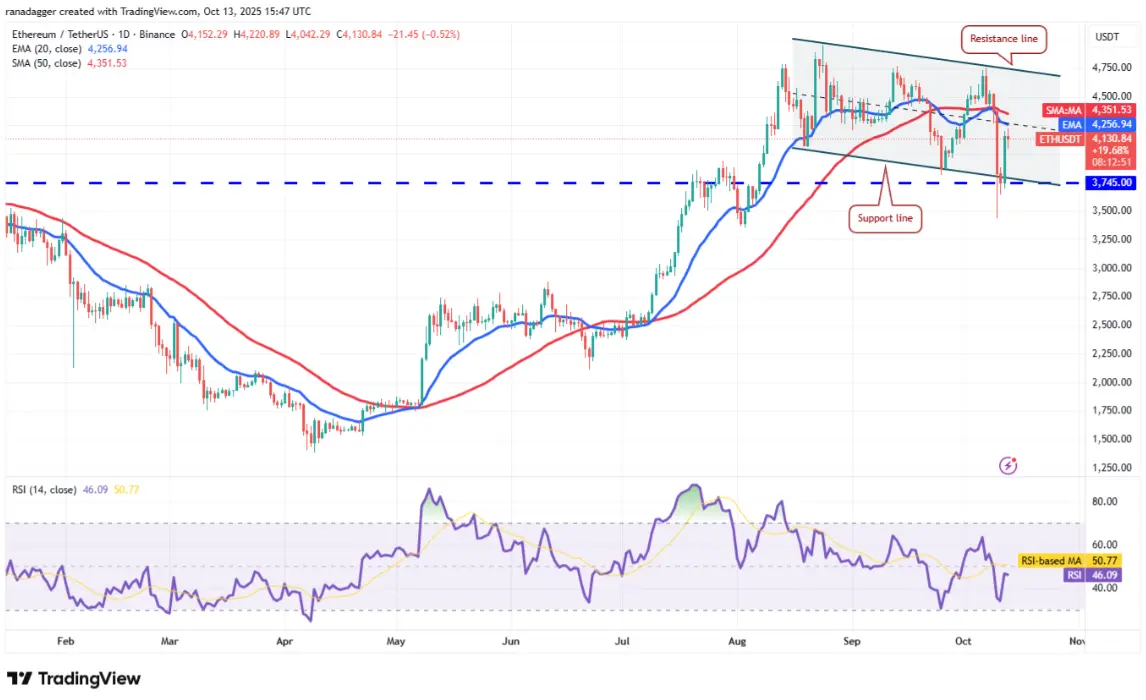 ETH/USDT daily chart | Source: TradingViewBy Sunday, ETH had regained its position in the channel, indicating strong buying demand at the bottom. If the price reverses down from the moving averages, the bears will once again try to push the ETH/USDT pair below the price channel. If successful, this could signal that a short-term peak has formed.
On the contrary, if the price breaks above the moving averages, it indicates that ETH may still fluctuate within the channel for some time. A breakout and close above the resistance line will open up the prospects for resuming the bullish trend.
Technical Analysis of BNB
BNB (BNB) has witnessed significant volatility in recent days. The bears pushed the price below the EMA 20 (1.145 USD) on Friday, but the bulls quickly reclaimed this area on Saturday.
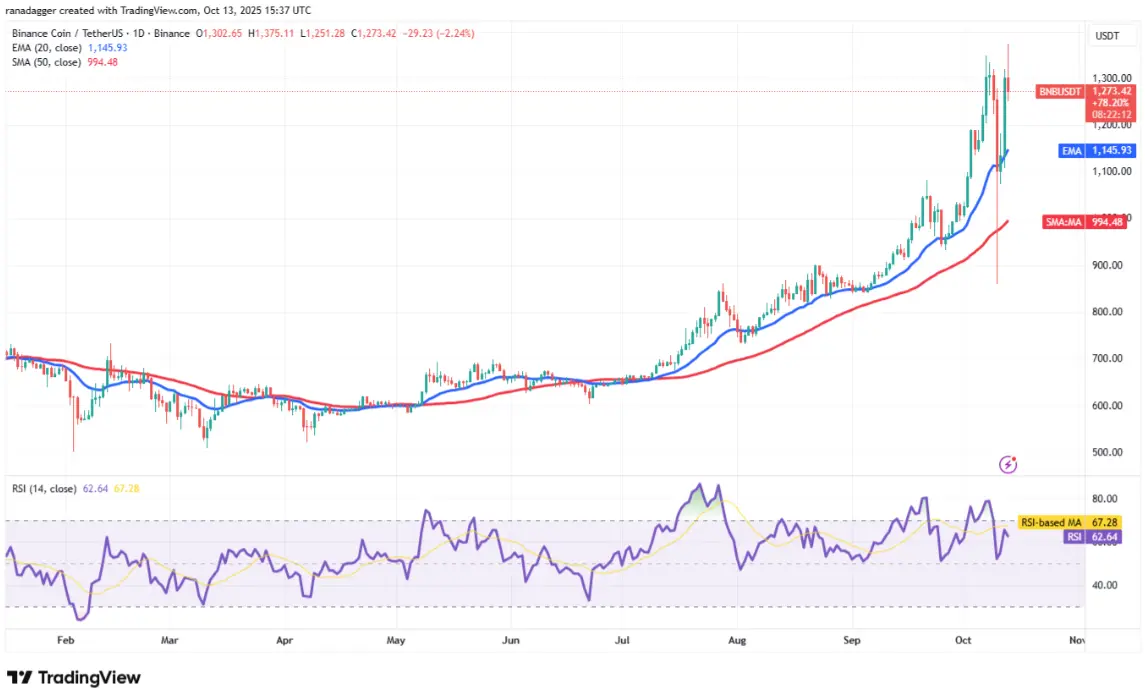 Daily BNB/USDT Chart | Source: TradingViewThis reflects a positive sentiment as investors view the dips as buying opportunities. The price of BNB has surged to a new all-time high of 1,375 USD on Monday, but the buying strength is gradually weakening at the high levels, indicating that profit-taking pressure is emerging.
The bears will try to regain dominance by pulling the price below the EMA 20 line. If successful, this could confirm a short-term peak.
Conversely, if the price breaks and closes above 1,350 USD, it indicates that the bulls are still in control of the market. At that point, the BNB/USDT pair may target the next zone around 1,609 USD.
Technical Analysis of XRP
The price of XRP (2.61 USD) has completed a descending triangle pattern ( with negative signals) on Friday and plummeted sharply, breaking through the pattern target at 1.72 USD.
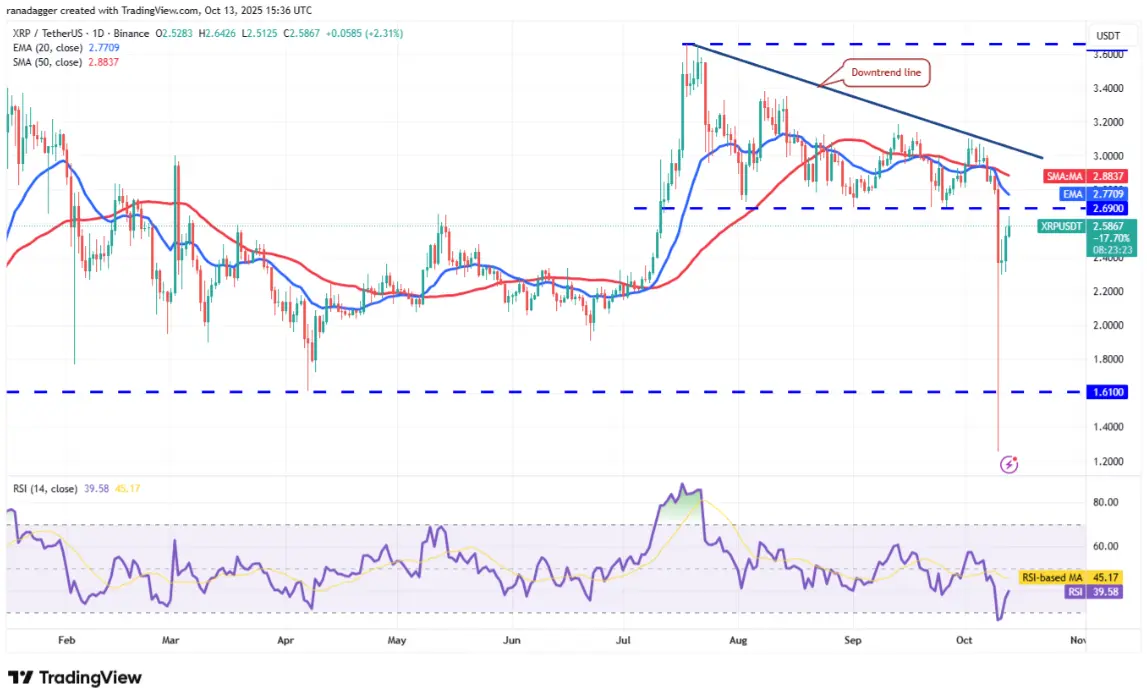 XRP/USDT Daily Chart | Source: TradingViewOne small positive point is that the price of XRP has recovered quite strongly from the bottom range of 1.25 USD, showing strong buying pressure at low price levels. This technical rebound is expected to potentially reach the 20-day exponential moving average (EMA) around 2.77 USD, where the bears are likely to reappear. If the price reverses and decreases from the EMA 20, the XRP/USDT pair may continue to slide down to the 2.20 USD range, and further down to 2 USD.
To confirm a bullish reversal signal, the bulls need to push the price above the downtrend line. Until that happens, pullbacks are still likely to be heavily sold.
Technical Analysis of SOL
The price of Solana (SOL) has fallen below the ascending channel pattern on Friday, indicating that the bears are trying to take control.
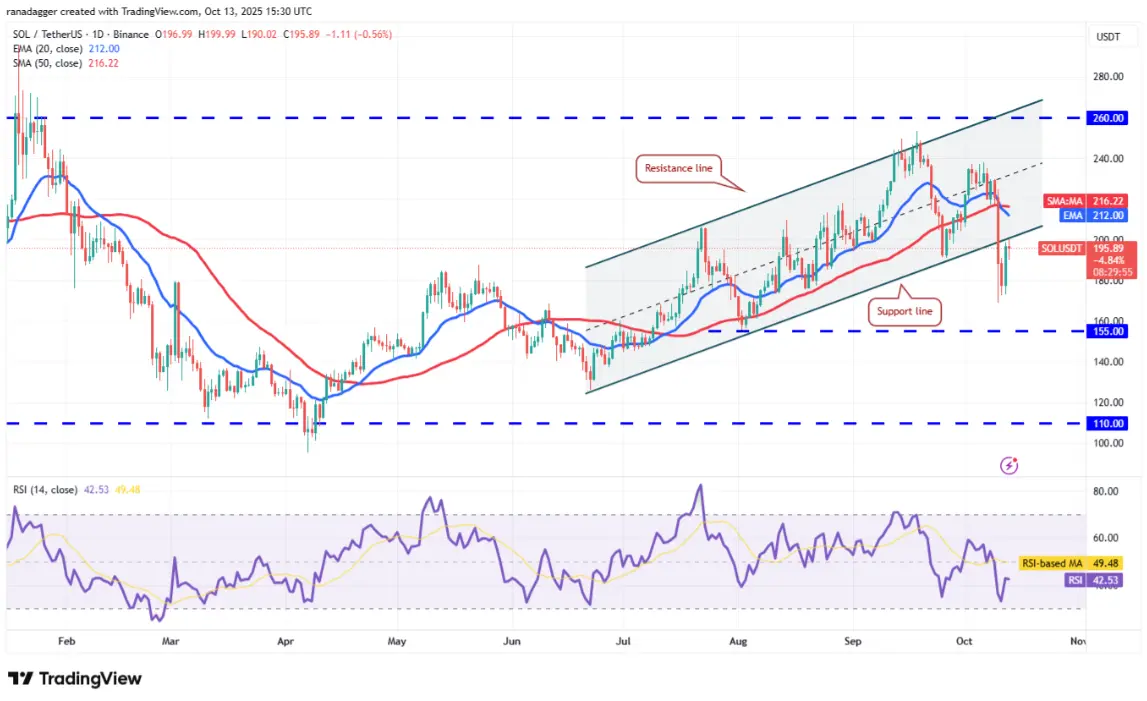 Daily SOL/USDT Chart | Source: TradingViewHowever, buying pressure is not easily giving up as investors quickly “catch the bottom” around the 168 USD area, helping the price to rebound strongly on Sunday and bringing the SOL/USDT pair back to the breakout region of the price channel.
If the price turns around and drops below 168 USD, it indicates that market sentiment has shifted to negative, increasing the likelihood of the price continuing to fall to 155 USD.
Conversely, the bulls will regain the initiative if they can push the price of Solana above the moving averages. At that point, the SOL/USDT pair could target the strong resistance level at 260 USD.
Technical Analysis of DOGE
The bears have pulled the price of Dogecoin (DOGE) below the support level of 0.14 USD on Friday, but were unable to maintain a closing level below this threshold.
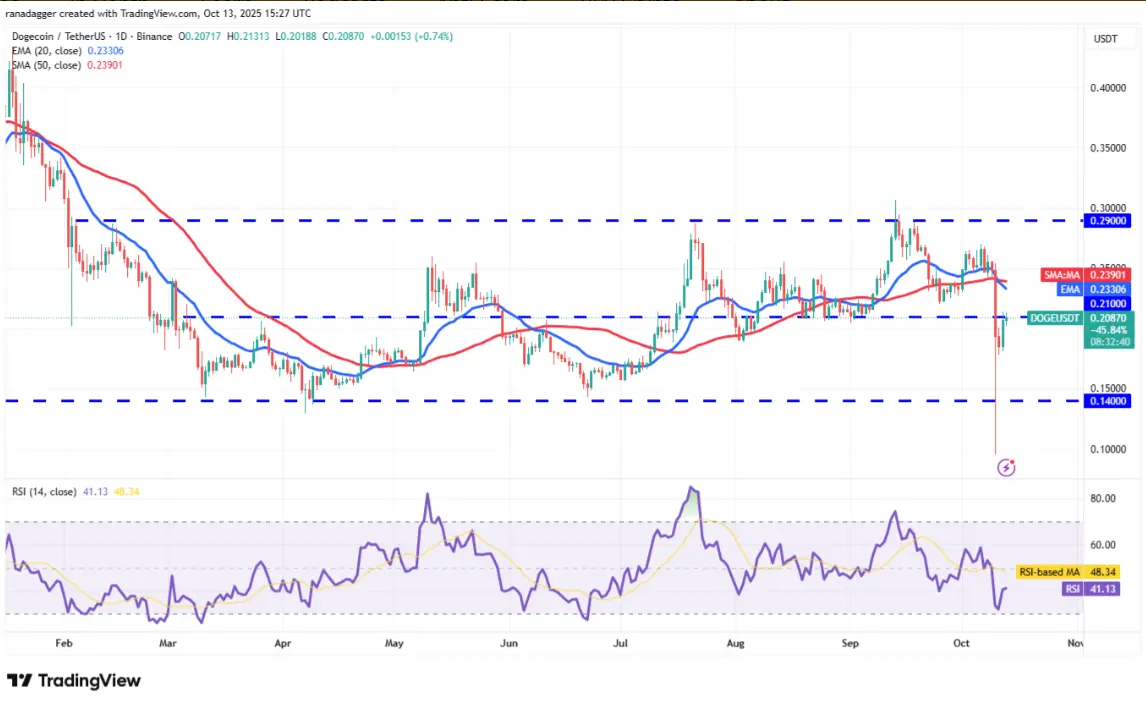 Daily DOGE/USDT chart | Source: TradingViewShortly after, DOGE price surged sharply, returning to the wide oscillation range between 0.14 USD – 0.29 USD. The bulls are currently trying to push the price up to the 20-day exponential moving average (EMA, around 0.23 USD), where new selling pressure may emerge. If the price is rejected here, the DOGE/USDT pair could drop back to 0.18 USD, or even 0.16 USD.
The clear next trend will only form when the closing price is above 0.29 USD or below 0.14 USD. Before that happens, the currency pair is likely to continue fluctuating within this range.
Technical Analysis of ADA
The price of Cardano (ADA) fell out of the descending channel model on Friday and plummeted to a low of 0.27 USD.
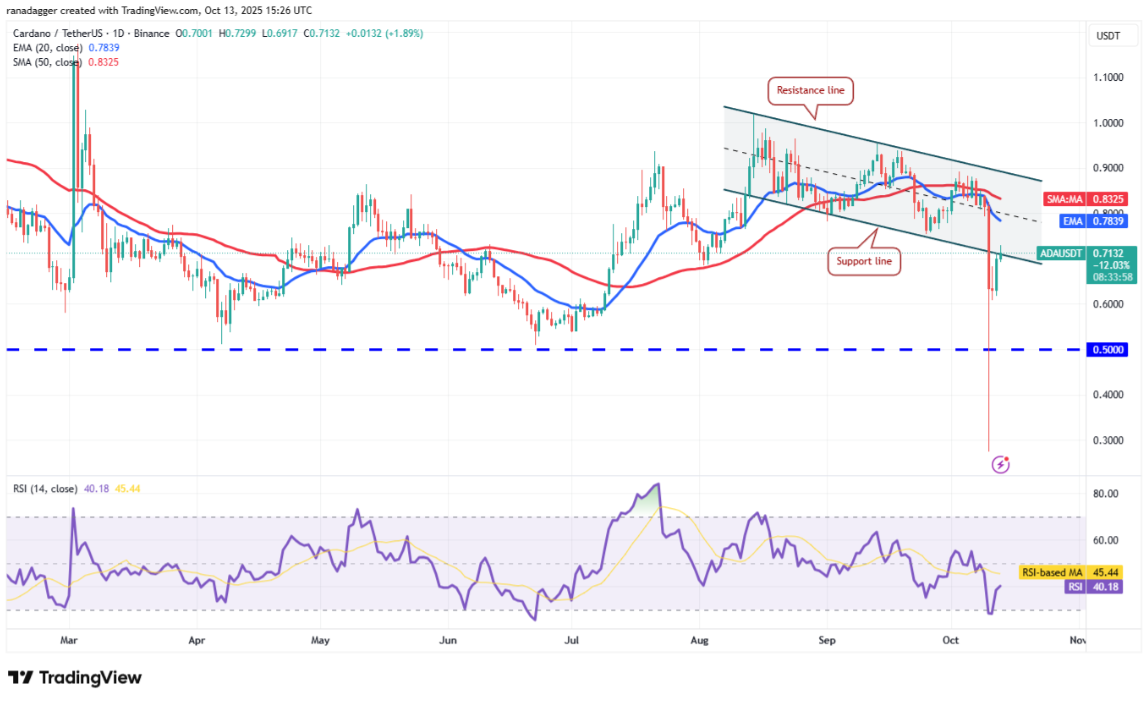 Daily chart ADA/USDT | Source: TradingViewHowever, the low price area has triggered strong buying power from the bulls, pulling the price back to the breakout area of the channel. Nevertheless, the bears are expected to exert strong pressure in the area between the support line and the 20-day EMA (0.78 USD).
If the price of Cardano sharply reverses from this resistance zone, it indicates that the bears are still in control. At that point, the ADA/USDT pair could drop to 0.60 USD, even 0.50 USD.
This negative scenario will be invalidated if the price continues to rise and breaks above the resistance line of the pattern.
HYPE Technical Analysis
Hyperliquid (HYPE) has completed the Head & Shoulders pattern ( on Friday and has plummeted towards the technical target at 21 USD.
![])https://img-cdn.gateio.im/webp-social/moments-8d743815cc4e7336e485dd7100a7c9ae.webp(Daily HYPE/USDT Chart | Source: TradingViewStrong buying at the low price area has helped the price bounce back to the )neckline( of the pattern, where bears are expected to set up strong defense. If the price is rejected here and drops back, bears will try to pull the HYPE/USDT pair below the support area of 35.50 USD. If successful, the price of Hyperliquid could continue to decrease to 30.50 USD.
However, the bulls seem to have a different plan: they will try to push the price above the moving averages – a signal that the correction phase may be about to end.
SN_Nour
