Bitcoin's price is stable above $104,000, and the sideways movement of Bitcoin has dampened expectations for a big pump in Moonvember. Historically, November has always been a strong month for Bitcoin. Crypto Assets trader Mayne pointed out that a short-term bottom seems to have appeared around $98,000, predicting that Bitcoin could experience a “super pump” to $200,000 in early 2026.
Moonvember Myth Shattered but Weekly Still Strong
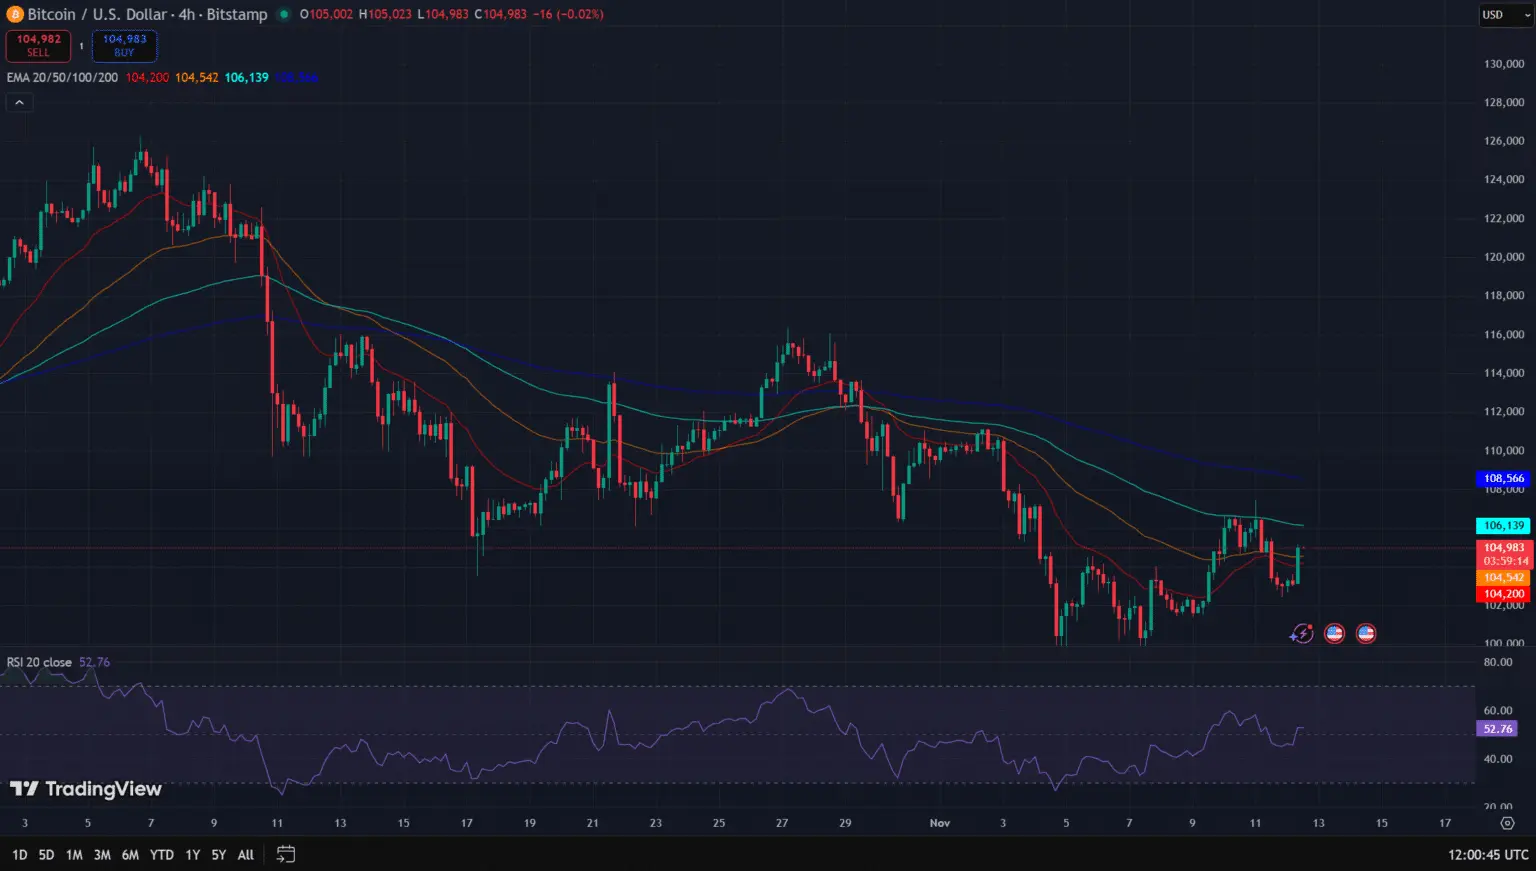
(Source: Trading View)
The price trend indicates that Bitcoin is currently in a sideways phase. However, the upcoming U.S. economic data release and the end of the U.S. government shutdown could disrupt this balance and bring about greater price volatility. As it stands, this news has not yet impacted the price trend of Bitcoin, but how it will unfold in the future remains uncertain.
The sideways consolidation of Bitcoin has left people disappointed in the expectation of a big pump in November. The term “Moonvember” comes from the crypto community's anticipation for November, as historical data shows it is one of the strongest performing months for Bitcoin. According to data from CoinGlass, November has historically been a strong month for Bitcoin, with an average pump of about 41.78% since 2013. This astonishing figure makes the crypto community excitedly look forward to the arrival of “Moonvember” every year, hoping for prices to soar like a moon landing.
However, the Moonvember of 2025 currently appears to break this historical pattern. On Monday, the price briefly climbed to $106,453 but failed to break through that level, dropping nearly 3% the next day. This failure to break through before a key resistance level is a typical signal of weakening technicals. Over the past 30 days, Bitcoin has fallen by 11.09%, which stands in stark contrast to the historical performance of Moonvember.
Despite the soft performance on a daily and monthly basis, Bitcoin has still increased by 3.35% from the weekly chart, showing a slight recovery. This weekly resilience indicates that the market has not completely collapsed, but is consolidating at high levels. This consolidation may be accumulating momentum for the next pump or forming a top pattern. In terms of trading volume, the recent sideways movement has been accompanied by a contraction in volume, which usually means that the market is waiting for a clear catalyst to determine direction.
From a technical perspective, if Bitcoin can close above $106,453, it is expected to continue rising to the next key level of $109,755. The Relative Strength Index (RSI) is currently at 53, indicating that the market is in a neutral state. There is currently uncertainty in the market, waiting for a catalyst to determine the direction of the next round of upswing or downswing, depending on news reports. This neutral RSI reading is neither overbought nor oversold, meaning that the price can break out in either direction.
Crypto Assets traders believe that Bitcoin's fundamentals are strong and that it is still undervalued compared to other investments. This view is mainly based on structural factors such as accelerated institutional adoption, improved regulatory environment, and long-term supply and demand relationships. Even if the short-term price is Sideways, these fundamental factors have not changed.
Institutional funds inflow of 520 million USD provides support
At the same time, institutional investors' interest in this encryption gold is growing. On November 11, 2025, the Bitcoin ETF listed in the United States saw new investments exceeding $520 million. This is an important data point as it shows that even in the context of the Moonvember myth being shattered and Bitcoin's price moving sideways, institutional funds are still continuously flowing in.
A net inflow of 520 million USD in a single day is quite a considerable scale in the current market environment. Compared to the inflows of billions of dollars daily during Uptober, this figure may not be astonishing, but maintaining a stable net inflow during the Sideways consolidation phase is already a positive signal. It indicates that institutional investors have not lost confidence due to short-term price weakness; instead, they are taking the opportunity of the Sideways movement to accumulate at lower prices.
The continuous buying from BlackRock's IBIT, Fidelity's FBTC, and other major Bitcoin ETFs provides structural support for Bitcoin prices. This institutional-level buying differs from retail speculative trading; it is usually based on long-term allocation needs rather than short-term price fluctuations. Even if Bitcoin prices are sideways or even decline in the short term, these institutional buy orders will provide strong defense near key support levels.
In the short term, this news has not yet had any immediate impact on the price trend of Bitcoin, but how it will develop in the future is uncertain. If institutional capital inflows continue to accelerate, along with other positive catalysts such as the end of government shutdowns, improving economic data, or the Federal Reserve confirming interest rate cuts, Bitcoin may experience a corrective rally in late November or December, and the delayed Moonvember effect may still be realized.
Trader Mayne predicts that the bottom of 98,000 has appeared
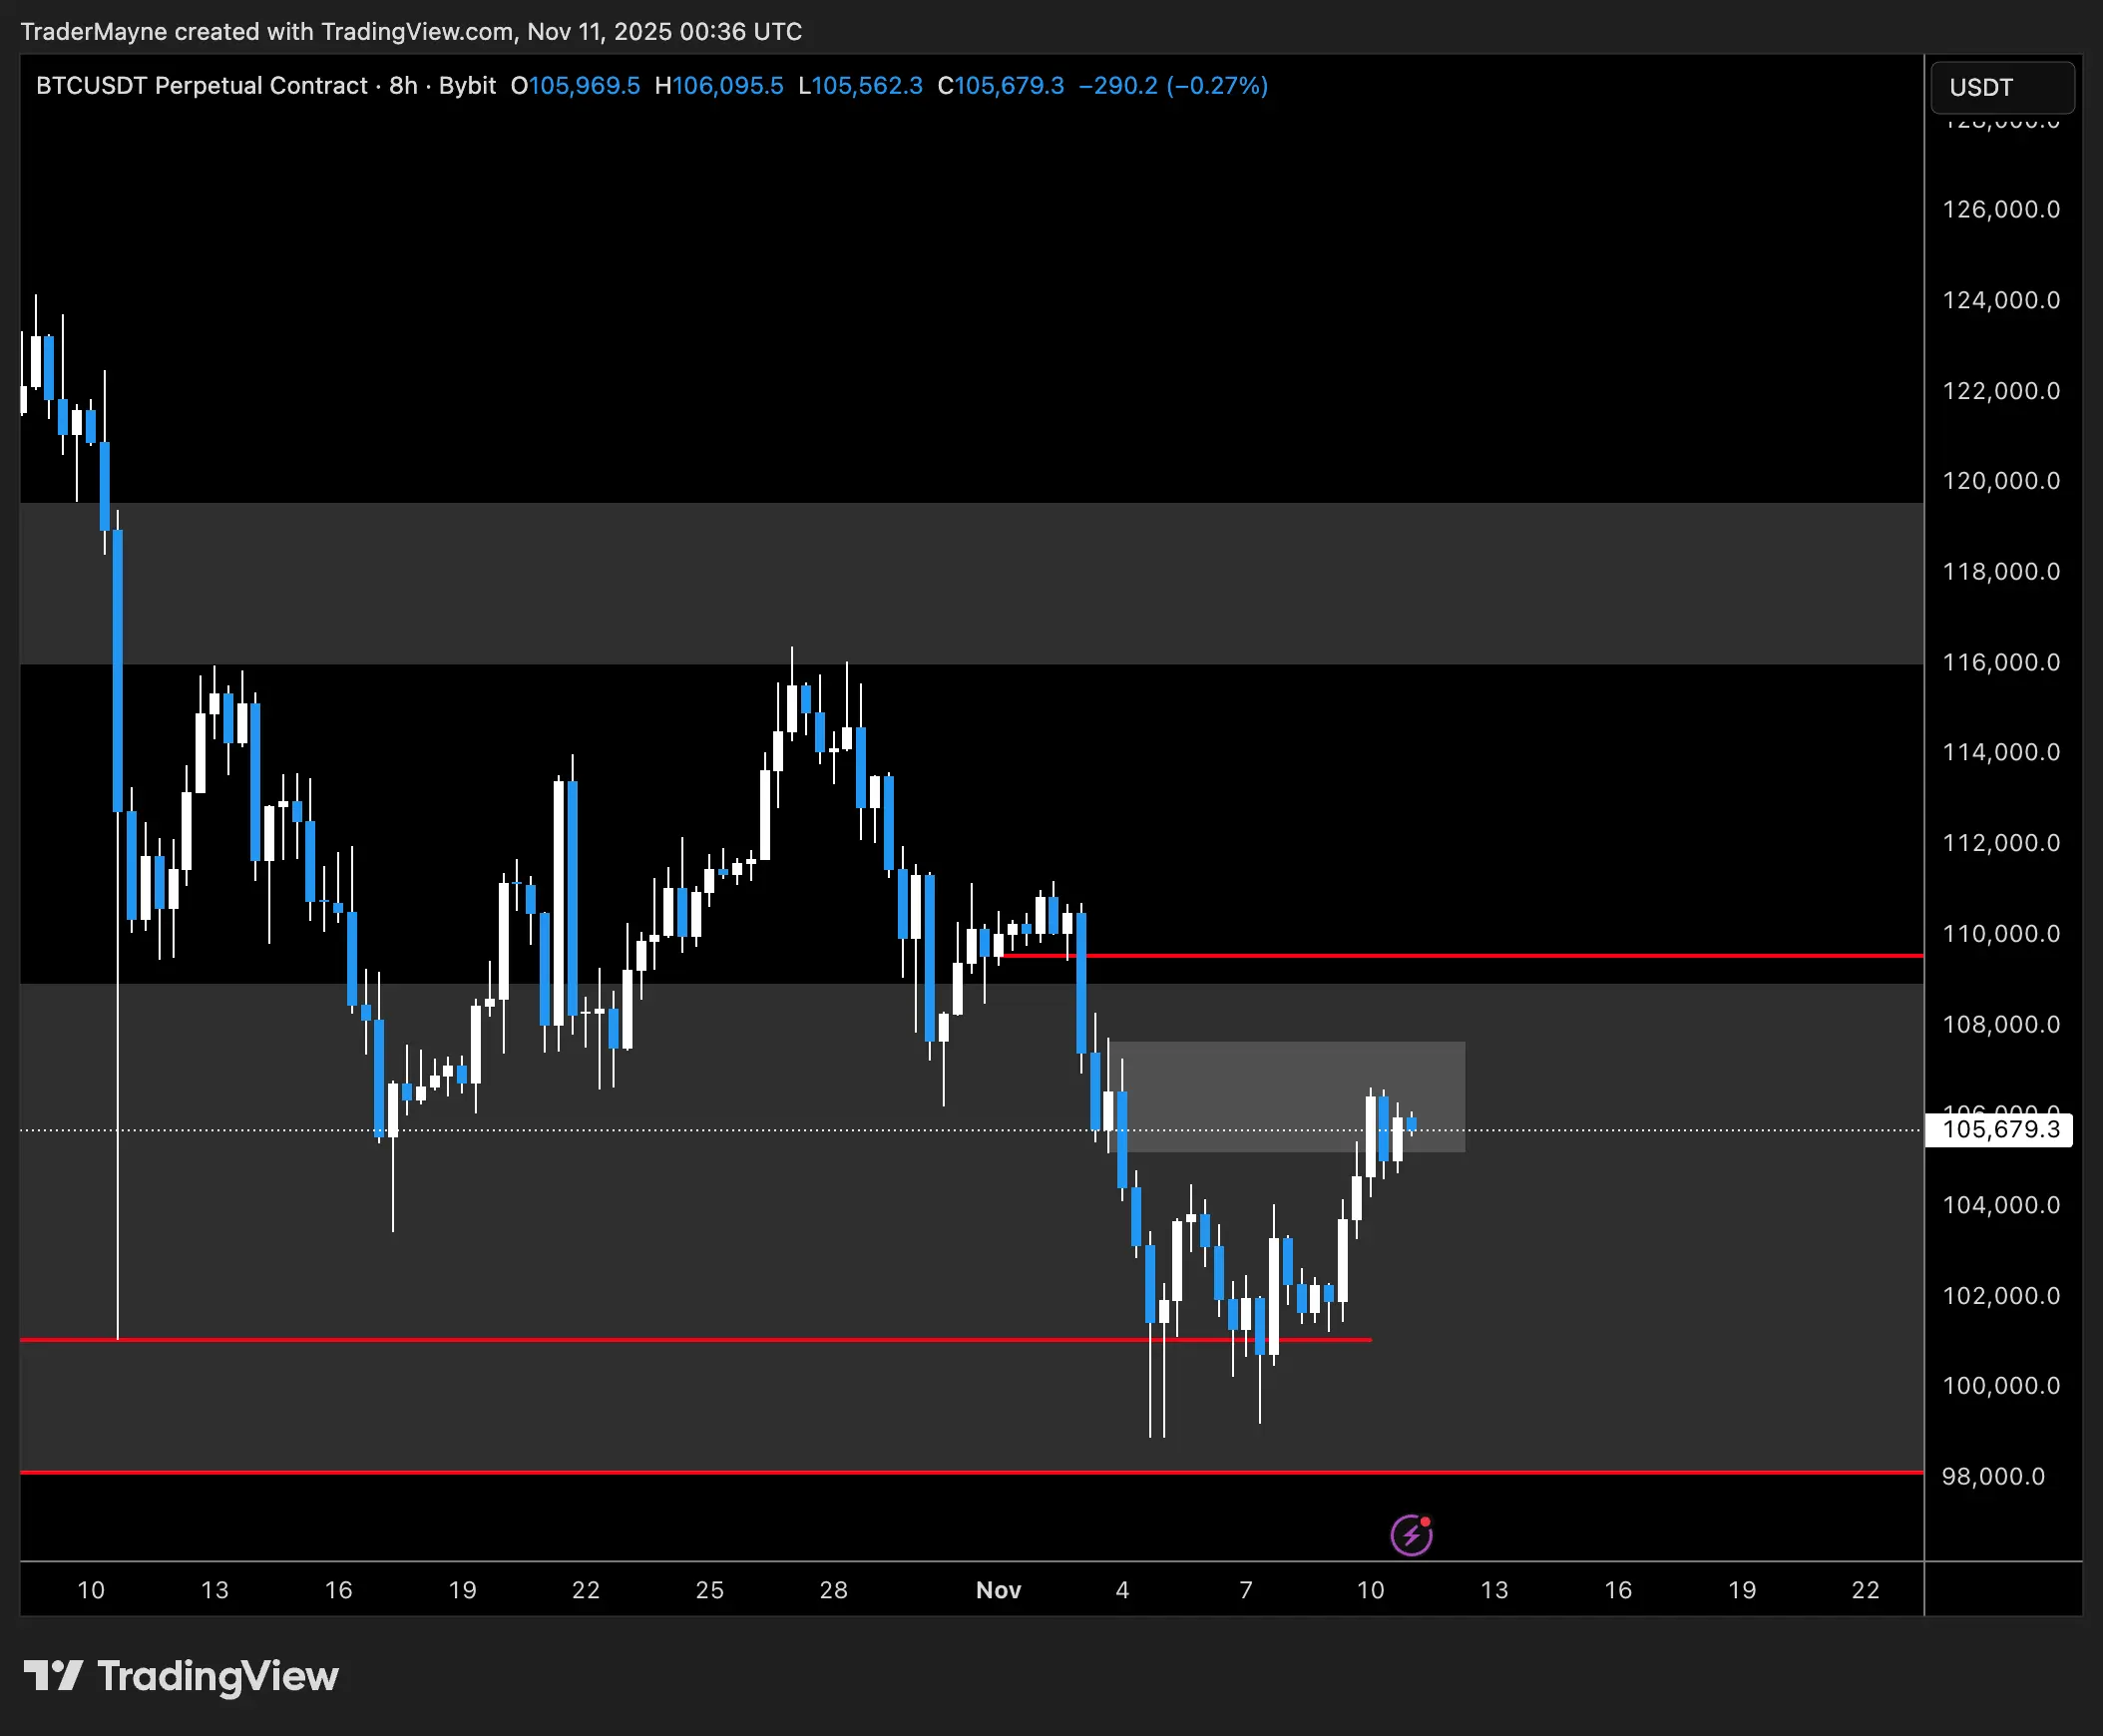
(Source: Trading View)
The short-term bottom for Bitcoin seems to have emerged around $98,000. Crypto Assets trader Mayne pointed out that this price level coincides with previous cycle lows of $25,000, $50,000, and $75,000. Additionally, it overlaps with Bitcoin's 50-week moving average. This resonance of multiple technical factors makes $98,000 a highly convincing support level.
The regularity of the previous cycle's low points is worth noting. $25,000 is the bottom of the 2022 bear market, $50,000 is the retest support after the breakout in 2023, and $75,000 is the key breakout level at the beginning of 2024. These price levels are all integer multiples of $25,000, indicating that the market may follow some mathematical rules. Although $98,000 is not an exact integer multiple relationship, it is close to the integer threshold of $100,000, which has strong psychological support.
The 50-week moving average is an important indicator of long-term trends. When the price is above the 50-week moving average, it is typically seen as a long-term upward trend; conversely, it indicates a downward trend. Bitcoin quickly rebounded after reaching $98,000 and has regained a position above the 50-week moving average, confirming that the long-term upward trend remains valid. As long as Bitcoin can stay above this moving average, the bulls still have control of the situation.
Earlier this week, the price of Bitcoin rebounded to $106,000, followed by a phase of sideways movement, indicating that the market has not completely given up on Bitcoin. Maine stated in his podcast that if Bitcoin can return above $110,000, it could potentially set a new historical high. However, in the short term, resistance is expected to be between $105,000 and $107,000.
He predicts that the price of Bitcoin may rebound by 50%-60% from a low of $98,000, which could drive the price of Bitcoin to levels between $140,000 and $160,000 by the end of December or early 2026, possibly even reaching $200,000, which he refers to as a “super big pump market.” A 50%-60% rebound means rising from $98,000 to between $147,000 and $156,800, which is basically in line with his $140,000 to $160,000 target. The extreme target of $200,000 would require about a 104% increase.
Mayne's Bitcoin Price Prediction Framework
Key Bottom: $98,000 (overlapping with the 50-week moving average and historical cycle low)
Short-term resistance: the range of $105,000 to $107,000
Breakthrough threshold: Returning above 110,000 USD is expected to create a historical new high.
Target Price: $140,000 to $160,000 (base scenario), $200,000 (super big pump scenario)
Timeframe: Reaching a peak by the end of December or early 2026, followed by a bear market.
Maine stated that as long as the price remains above $98,000, he remains optimistic. If the price falls below $98,000 or fails to return to the level of $110,000, it would indicate the end of the current cycle. This perspective sets $98,000 and $110,000 as the bull-bear boundary, providing traders with a clear operational framework.
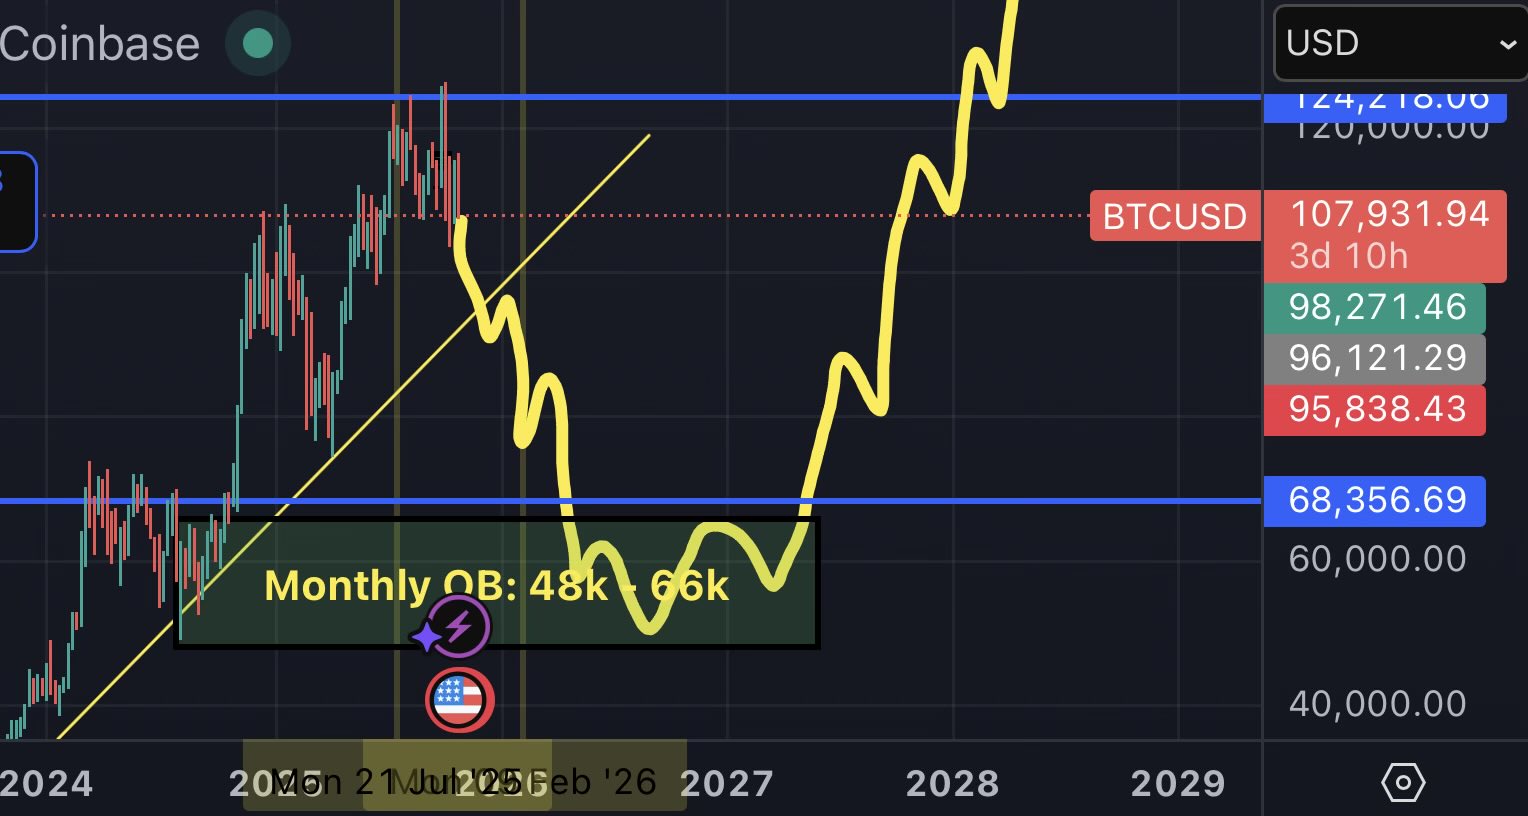
(Source: Trading View)
He continues to follow the 4-year cycle pattern of Bitcoin, expecting the next peak to arrive in late 2025 or early 2026, followed by a decline. This is basically in line with the views of Bitwise's Matt Hougan, who also believes that the top of the current cycle may occur in 2026 rather than at the end of 2025.
He also pointed out that the current panic and negative sentiment in the market may actually signal an upcoming rally. “In any case, I believe the end days are approaching,” he said. “Most of 2026 will be a bear market.” The logic of this contrarian thinking is that when market sentiment is extremely pessimistic, it is often the moment when the bottom is formed; when everyone is in a panic, smart money starts to enter.
The end of the government shutdown and economic data are key variables
The upcoming U.S. economic data and the end of the U.S. government shutdown may break this balance and bring about greater price volatility. The U.S. House of Representatives is expected to vote on the funding bill this week, and if it passes successfully and is signed by Trump, the government will reopen before Friday. This will eliminate a source of uncertainty that has lasted for over 40 days, potentially boosting market confidence.
The release of U.S. economic data is also crucial. Indicators such as inflation data, employment reports, and GDP growth will affect expectations for the Federal Reserve's interest rate cut in December. Currently, the market believes there is a 67.9% chance that the Federal Reserve will cut rates at the meeting on December 10. If economic data shows a decline in inflation and robust economic growth, expectations for a rate cut may heat up again, pushing Bitcoin prices to break through the current sideways range.
Everything is not over yet; there may still be opportunities in the second half of Moonvember. If Bitcoin can break through $106,453 and stay above $110,000 in the next two weeks, along with the continuous inflow of institutional funds and positive macro catalysts, the historical average increase of 41.78% in Moonvember may be challenging to achieve, but a double-digit rise is still possible. Investors should closely monitor the results of the House vote, the release of economic data, and whether Bitcoin can break through the $107,000 resistance level.
