December 16, TON dropped to $1.4953, significantly underperforming the overall cryptocurrency market which declined by 1.8%, indicating a clear relative weakness. Even more noteworthy is that trading volume exceeded 640,000 tokens, with both selling and rebound periods showing higher-than-average activity. The trend suggests that even if conditions in other markets improve, sellers remain active.
Independent Weakness: Why Is TON Underperforming the Market?
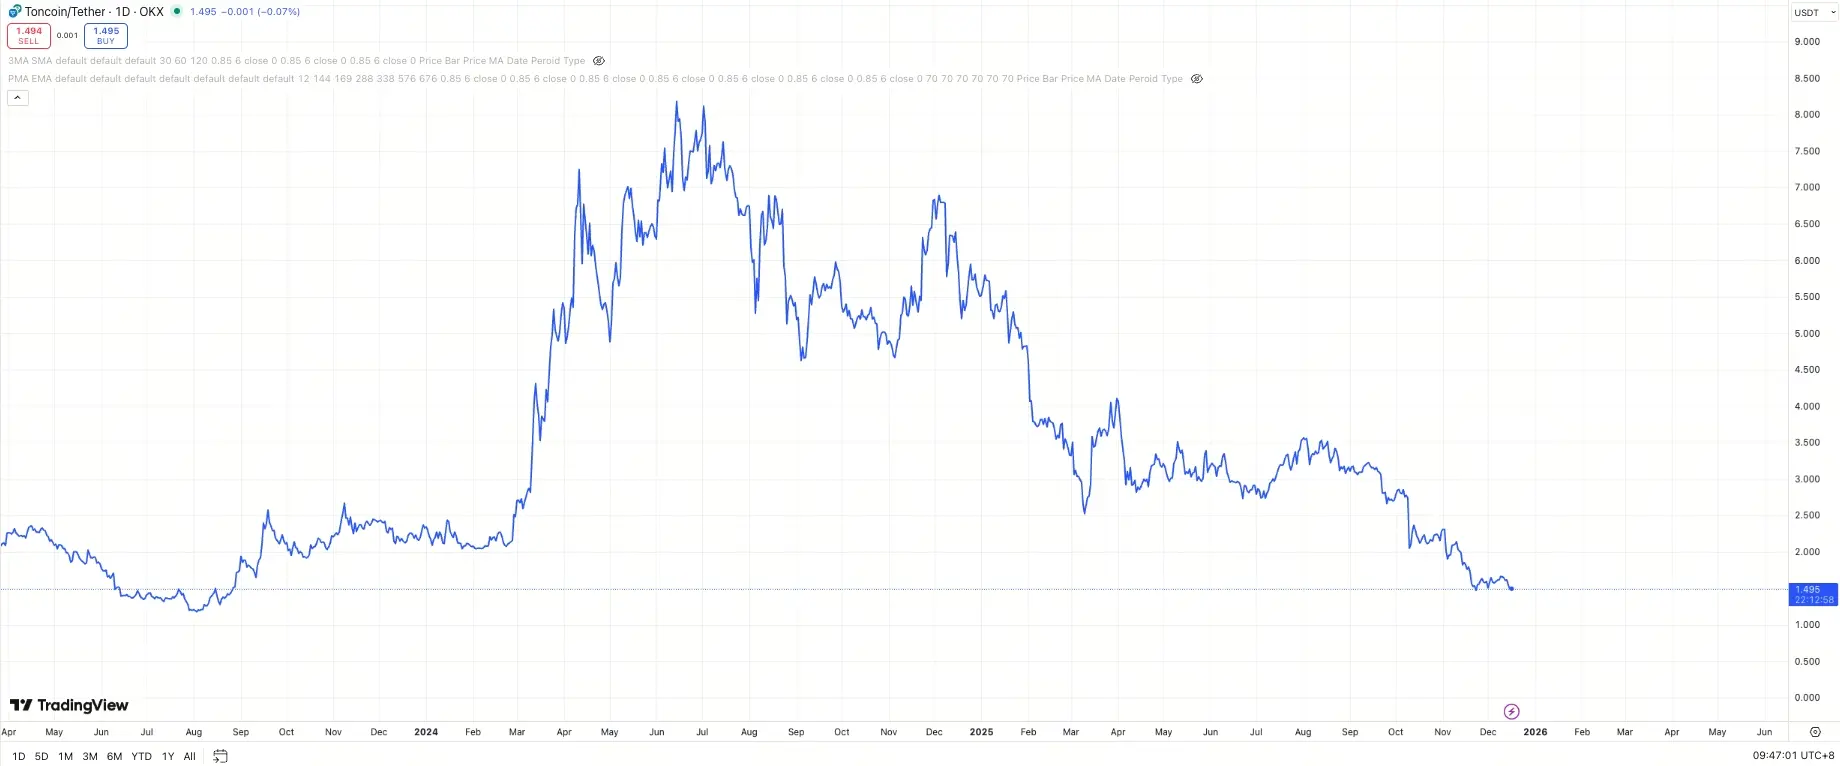
(Source: Trading View)
The performance gap between TON and the broader cryptocurrency market has further widened, making this relative weakness worth in-depth analysis. When the overall market falls by 1.8%, TON drops by 3.4%, meaning its decline is nearly twice that of the market. This “independent weakness” often stems from fundamental issues with the token or a loss of market confidence.
The token has experienced several brief rebounds but ultimately continued its downward trend. This pattern of failed rebounds is typical of a downtrend: each price recovery attracts new selling pressure, causing subsequent rebounds to diminish. From a technical analysis perspective, this movement is called a “descending channel” or “bear flag,” which usually indicates that the downtrend has not yet ended.
The relative underperformance compared to the market may reflect several factors. First, as a token closely linked to the Telegram ecosystem, its performance is influenced by Telegram’s platform development and regulatory environment. If Telegram faces regulatory pressure in certain regions or user growth slows, it will directly impact TON’s demand. Second, TON’s liquidity is relatively small, making it more susceptible to overselling during market panic. Third, there may be large holders or project team selling behaviors, as evidenced by high trading volume.
From a market psychology perspective, when a token consistently underperforms the market, it can create negative market expectations. Investors may start questioning the reasons for holding the token, and funds might flow into stronger-performing assets. This psychological effect can reinforce itself, further widening the relative weakness. Currently, TON seems to be caught in this vicious cycle.
The Game Behind the Surge in Trading Volume
Trading volume exceeding 640,000 tokens, far above the daily average, is a key indicator for understanding current market dynamics. High trading volume combined with falling prices typically has two interpretations: either panic selling has peaked, or large investors are accumulating but have not yet completed their positions. Based on price behavior, TON leans more toward the former.
According to CoinDesk Research’s technical analysis data model, the fluctuation range within the trading interval is close to 4.3%, a level of intraday volatility not common among mainstream tokens outside stablecoins. High volatility coupled with high trading volume indicates market participants are readjusting their positions, but not necessarily in a clear direction. This reflects market uncertainty, with active but cautious participants.
Three Possible Explanations for Abnormal Trading Volume
Peak Panic Selling: Long-term holders sell off in bulk due to loss of confidence, with the surge in trading volume representing a liquidation wave. If this is the case, the price may bottom out and rebound after the selling exhausts.
Institutional or Large Holder Distributions: Institutions or major holders sell in batches, taking advantage of each rebound to offload, causing repeated failed attempts at recovery. Under this scenario, prices may remain under pressure until the large holders complete their selling.
Active Short Selling Suppression: Derivatives market short sellers profit by dumping in the spot market, with high trading volume partly driven by hedging related to short positions. In this case, the price could experience more severe declines.
Can the Key Support at $1.5449 Hold?
Technical indicators remain mixed. The token found support near $1.5449, which is the day’s lowest point and a focal point of short-term bulls and bears. Based on order book data and historical transactions, there may be large buy orders or psychological support around this level, leading to a brief rebound to approximately $1.58 after touching it.
However, the rebound failed again, indicating that buyers’ short-term entry was met with renewed selling pressure. These movements suggest that major market participants may be interested, but without sustained follow-through, TON will continue to weaken. The failed rebound is an important technical signal, often indicating an imminent further decline.
If support at $1.5449 breaks, the next support levels could be at the psychological $1.50 mark or even lower near $1.45. Breaking below $1.50 could trigger a cascade of stop-loss orders, accelerating the decline. Conversely, if TON can stabilize above $1.5449 and regain above $1.60, it may temporarily ease selling pressure.
This decline has intensified the overall poor performance trend of the asset. Currently, traders are closely watching for signs of market stabilization or further selling. From a risk management perspective, investors should set clear stop-loss levels to avoid blindly bottom-fishing in a downtrend. Waiting for signs of stabilization and decreasing volume might be a wiser strategy.
Disclaimer: The information on this page may come from third parties and does not represent the views or opinions of Gate. The content displayed on this page is for reference only and does not constitute any financial, investment, or legal advice. Gate does not guarantee the accuracy or completeness of the information and shall not be liable for any losses arising from the use of this information. Virtual asset investments carry high risks and are subject to significant price volatility. You may lose all of your invested principal. Please fully understand the relevant risks and make prudent decisions based on your own financial situation and risk tolerance. For details, please refer to
Disclaimer.
Related Articles
Michael Saylor: Bitcoin may have already hit bottom, but quantum risks have been exaggerated
Strategy Executive Chairman Michael Saylor believes Bitcoin hit its bottom around $60,000 this February, because all forced sellers in the market have already exited. He said that the catalyst for the next bull market will be a bitcoin-based banking credit system, while he believes the threat from quantum computing is being exaggerated, and he pointed out that the technical community has enough time to deal with this threat.
MarketWhisper1h ago
Glassnode: Is the Bitcoin rebound just a dead cat bounce? Where is the key pressure level?
Glassnode reports that although the Bitcoin price rebounded to $72k due to a U.S.-Iran ceasefire, the market structure is still in a bear market. In the short term, the downside may be limited, but the $78k level faces pressure overhead. ETF capital inflows have ticked up slightly, but they have not yet fully returned; trading activity in derivatives remains sluggish, indicating insufficient market confidence. Going forward, we need to monitor changes in the futures trading and options markets.
ChainNewsAbmedia2h ago
Why is Bitcoin down today? The Iran–Israel ceasefire is on the verge of collapse, and the Strait of Hormuz shuts down again
Bitcoin has recently been trading below $72,000 and faces risks from the failure of the U.S.-Iran ceasefire talks and the Strait of Hormuz closing again, which has weighed on market sentiment. At the same time, Federal Reserve meeting minutes show that the likelihood of further rate hikes is rising, further affecting the valuation of risk assets. Bitcoin’s key resistance level is $75,000 and its support level is $68,000; the market is currently waiting for a clear direction confirmation signal.
MarketWhisper2h ago
The Crypto Fear and Greed Index drops to 14, and the market remains in extreme fear
Gate News message, April 9, according to Alternative data, today’s Crypto Fear and Greed Index is 14 (yesterday was 17), and the market remains in extreme fear. The index ranges from 0-100 and provides a composite assessment of six indicators: volatility (25%), market trading volume (25%), social media buzz (15%), market surveys (15%), Bitcoin’s share of the entire market (10%), and Google trending topic analysis (10%).
GateNews3h ago
Optimism over the Iran-U.S. ceasefire helped drive a broad rebound in U.S. stocks, and Bitcoin rose to a three-week high.
The United States and Iran reached a two-week ceasefire agreement, and global financial markets turned optimistic, with the S&P 500 rising 2.51%. U.S. crude oil prices fell to below $95 per barrel, easing concerns about an energy crisis. Bitcoin at one point rose 5% to $72,841, hitting a three-week high. Expectations that the Federal Reserve will cut interest rates have also increased.
ChainNewsAbmedia3h ago
Bitcoin ETF attracts $470 million, setting a 6-week high! Analyst: “A breakout rally is brewing.”
U.S. spot Bitcoin ETF inflows hit a new six-week high on Monday, signaling a rebound in institutional investor confidence. Total net inflows of $471.3 million came mainly from institutions such as BlackRock and Fidelity. Even though market sentiment is gradually improving, broader macroeconomic and geopolitical risks could still affect Bitcoin’s upward momentum. Analysts said that sustained structural buying can support Bitcoin, but future price action will still need to be monitored for changes in external factors.
区块客3h ago